

Abstract
The hippocampus is proposed to be critical in distinguishing between similar experiences by performing pattern separation computations that create orthogonalized representations for related episodes. Previous neuroimaging studies have provided indirect evidence that the dentate gyrus (DG) and CA3 hippocampal subregions support pattern separation by inferring the nature of underlying representations from the observation of novelty signals. Here, we use ultra-high-resolution fMRI at 7 T and multivariate pattern analysis to provide compelling evidence that the DG subregion specifically sustains representations of similar scenes that are less overlapping than in other hippocampal (e.g., CA3) and medial temporal lobe regions (e.g., entorhinal cortex). Further, we provide evidence that novelty signals within the DG are stimulus specific rather than generic in nature. Our study, in providing a mechanistic link between novelty signals and the underlying representations, constitutes the first demonstration that the human DG performs pattern separation.
SIGNIFICANCE STATEMENT A fundamental property of an episodic memory system is the ability to minimize interference between similar episodes. The dentate gyrus (DG) subregion of the hippocampus is widely viewed to realize this function through a computation referred to as pattern separation, which creates distinct nonoverlapping neural codes for individual events. Here, we leveraged 7 T fMRI to test the hypothesis that this region supports pattern separation. Our results demonstrate that the DG supports representations of similar scenes that are less overlapping than those in neighboring subregions. The current study therefore is the first to offer compelling evidence that the human DG supports pattern separation by obtaining critical empirical data at the representational level: the level where this computation is defined.
Keywords: 7 T fMRI, hippocampal subfields, medial temporal lobe, memory, MVPA, pattern separation
Introduction
The hippocampus (HC) is widely acknowledged to be critical to episodic memory (Cohen and Eichenbaum, 1993; Eichenbaum, 2004; Davachi, 2006). To avoid confusing memories for similar experiences, the HC should assign distinct neuronal codes to related episodes. This process, often referred to as pattern separation, is generally viewed to be a critical computation performed by an episodic memory system, specifically, the dentate gyrus (DG) subregion of the HC (Marr, 1971; O'Reilly and McClelland, 1994; Rolls and Treves, 1994; Norman and O'Reilly, 2003). Although empirical evidence demonstrates that the hippocampal DG region in rodents supports pattern separated representations (Leutgeb et al., 2007; McHugh et al., 2007; Colgin et al., 2008; Neunuebel and Knierim, 2014; Lee et al., 2015), previous studies in humans have provided only indirect evidence for a role for the DG in this process (Bakker et al., 2008; Lacy et al., 2011; Azab et al., 2014; Reagh and Yassa, 2014; Kyle et al., 2015) and lacked the anatomical resolution to distinguish between DG and CA3.
Specifically, a previous study used an fMR adaptation paradigm to show that items that were similar to those previously experienced (“lures”) elicited elevated levels of activity in DG/CA3 (i.e., comparable to that elicited by the initial presentation) compared with exact repetitions of the item (Bakker et al., 2008; also see follow-up studies: Yassa et al., 2010, 2011; Lacy et al., 2011; Bakker et al., 2012). Although this lure-associated novelty signal was used to infer the existence of pattern-separated representations for the original and lure item in the DG/CA3 region, there is an alternative possibility that cannot be discounted: that these novelty signals may reflect the output of a match–mismatch process in which the lure item triggers pattern completion of the original stored item and a resultant mismatch signal (Kumaran and Maguire, 2009). Therefore, these previous studies do not necessarily imply a role for the human DG/CA3 in pattern separation.
The current study, therefore, was configured to provide a more definitive test of the hypothesis that the human DG performs pattern separation. First, we were able to distinguish between the DG and CA3 subregions by obtaining high-field fMRI data at 7 T with a functional resolution of 0.8 × 0.8 × 0.8 mm (corresponding to a volume of 0.51 mm3) covering the whole medial temporal lobe (MTL) memory system including the HC, entorhinal cortex (EC), perirhinal cortex (PRC), and parahippocampal cortex (PHC). In contrast, previous fMRI studies of the MTL that investigated pattern separation relied on 3 T fMRI and isotropic voxel sizes up to 1.5 mm (corresponding to a volume of 3.375 mm3; Bakker et al., 2008; Carr et al., 2010). Second, we used multivariate fMRI methods to investigate whether the DG performs pattern separation, an analytic technique that is particularly appropriate given that this computation is defined at the level of the underlying representations (Treves and Rolls, 1994; McClelland et al., 1995; Norman and O'Reilly, 2003; Haynes and Rees, 2006; Davis and Poldrack, 2013; Haynes, 2015; Knierim and Neunuebel, 2016). Strong evidence for pattern separation would require the demonstration that multivoxel activity patterns for similar stimuli in the DG were more distinct than in regions upstream the HC such as the EC, PRC, and PHC. To optimize our paradigm for multivariate pattern analysis (MVPA), we used a modified repetition suppression paradigm that included only two stimuli (A,B) (cf. Bakker et al., 2008 that used trial-unique stimuli). The stimuli constituted very similar versions of the same spatial environment inspired by A-B-B-A type paradigms used in nonhuman primate studies in which repetition suppression responses are observed even with highly familiar stimuli (Miller and Desimone, 1994; Hölscher and Rolls, 2002). In addition, this allowed us to investigate whether the DG generates stimulus specific novelty responses that can be related to the underlying representations detected by MVPA analysis.
Materials and Methods
Subjects
Twenty young subjects (11 male, recruited at the campus of the Otto-von-Guericke University Magdeburg, mean age 27.6 ± 4 years, range = 21–35) participated in the experiment. Subjects were screened for known metabolic disorders and neurologic or psychiatric history and excluded from further examination in case of incidents reported during history taking. All subjects had normal or corrected to normal vision and were right handed. One subject was discarded from further analyses due to too many incorrect responses (19% incorrect). The study was conducted and designed in accordance with the Declaration of Helsinki (Williams, 2008) and all subjects gave informed and written consent for their participation in accordance with ethic and data security guidelines of the Otto-von-Guericke University Magdeburg. The study was approved by the local ethics committee.
Task and design
Before scanning subjects had to complete a 4 min training and stimulus familiarization phase outside of the scanner (10 stimulus sequences). During the following fMRI session, the same two stimuli (A and B; Fig. 1) were presented in short sequences consisting of three to five stimulus presentations. Sequences were presented in an event-related design. Each stimulus was presented for 2 s and stimuli were separated by a presentation of a scrambled noise picture for 3.5 s (±1 s) to prevent an afterimage or pop-out effects. Sequences were separated by a presentation of a fixation star for 4.5 s. Subjects had to indicate the third occurrence of the first item seen in a sequence via button press with their right index finger. This provided a behavioral measure of mnemonic discrimination performance.
Figure 1.

Experimental paradigm. Stimuli A and B were presented in short sequences (three to five stimuli; a–d show selected examples). Subjects were instructed to indicate the third occurrence of the first item seen in a sequence via button press. In half of the sequences, there was a repetition of identical stimuli in the beginning (repetition trials; a, b). In the other half, stimuli changed in the very beginning (lure trials; c, d). We included only the first and second stimulus in further analyses as indicated by the blue line. R indicates the appropriate response for each example sequence. We refer to the first stimulus in each sequence as “first presentation” although only the two scenes displayed in the figure were used in the entire experiment and therefore each scene was highly familiar. Note that the length and order of the sequences was counterbalanced between stimulus A and B repetitions and lures.
For the fMRI analysis, we focused only on the first and second stimulus presentation within each sequence to counterbalance stimuli and to exclude the motor response. All sequences were counterbalanced in terms of stimulus A and B. In addition, the length and order of the sequences was counterbalanced between stimulus A and B repetitions and lures (see Fig. 1 for example sequences). We presented 32 sequences in each of the four runs. This resulted in a total of 128 sequences. Although, in half of the sequences, the first stimulus was repeated (repetitions), in the other half, there was a change of the stimulus within the first two stimulus presentations (lures). Therefore, we could include 128 first presentations, 64 repetitions, and 64 lures in the subsequent fMRI analyses.
Immediately after the scanning procedure, there was a postscan debriefing in which we asked subjects to draw both stimuli in as detailed a manner as possible. This was done to make sure that all subjects were not only aware of the difference between both stimuli, but that they also had a detailed representation of the whole living room scene.
Stimuli
The stimuli consisted of two colored computer-generated (3ds Max; Autodesk) and isoluminant images. The images showed two similar versions of the same living room with a size of 800 × 600 pixels (Fig. 1). A scrambled “noise” picture with identical dimensions was shown between the images. The fixation target was a black image with identical dimensions and a white fixation star in the center. Stimuli were projected onto the center of a screen and the participants watched them through a mirror mounted on the head coil, subtending a visual angle of ∼±3° × ±2°.
MRI
MRI data were acquired using a 7 T MR system (Siemens). A 32-channel head coil was used. The same scanning protocol was used as previously reported in a high-resolution fMRI study on the MTL (Maass et al., 2014). Furthermore, task residuals from the data of the recent study were used for functional connectivity analyses of MTL regions previously (Maass et al., 2015). Before the fMRI session, a whole head MP-RAGE volume (TE = 2.8 ms, TR = 2500 ms, TI = 1050 ms, flip angle = 5°, resolution 0.6 mm isometric) was acquired. Subsequently, the four fMRI sessions were run (see “fMRI data acquisition” section), followed by the acquisition of a high-resolution partial structural volume (T2*-weighted imaging, TE = 18.5 ms, TR = 680 ms, resolution 0.33 mm × 0.33 mm, 45 slices, slice thickness 1.5 mm + 25% gap, FOV 212 mm × 179 mm, matrix 640 × 540), with a slice alignment orthogonal to the HC main axis. Total MRI duration was ∼100 min.
fMRI data acquisition
Each subject's fMRI scan consisted of 1600 volumes, each comprising 28 T2*-weighted echo planar slices with a resolution of 0.8 × 0.8 mm (TE = 22 ms, TR = 2000 ms, slice thickness 0.8 mm, FOV 205 mm, matrix 256 × 256, parallel imaging with grappa factor 4) in 4 sessions of 13.5 min.
The slices were acquired in an odd–even interleaved fashion oriented parallel to the HC long axis. EPI volumes were distortion corrected using a point spread function mapping method (Zaitsev et al., 2004) and motion corrected during the online reconstruction.
fMRI data analyses
Univariate analysis.
fMRI data preprocessing and statistical modeling was done using SPM8 (Wellcome Trust Centre for Neuroimaging, University College London) and FSL (Centre for Functional Magnetic Resonance Imaging of the Brain, University of Oxford). Raw image data were converted to NIfTI images while preserving the original image parameters. Because the data were already corrected for distortions and for motion (see “fMRI data acquisition” section), the preprocessing included only slice timing correction and smoothing with a 2 mm full-width half-maximum Gaussian kernel (FWHM). A 2 mm smoothing kernel was used because it provides a good compromise between high sensitivity and high specificity, as we reported previously (Maass et al., 2014). Coregistration of the functional and structural images was done using boundary-based registration on a white matter segmentation of the structural MPRAGE image using FSL (Greve and Fischl, 2009).
To model the functional data, delta functions defined by the onset of a stimulus on a trial-by-trial basis were convolved with a hemodynamic response function (HRF) and its first temporal derivative. First- and second-level data were analyzed using a mixed-effect general linear model (GLM) approach (Worsley and Friston, 1995) and experimental conditions were entered into the GLM as separate regressors for first presentations, repetitions, and lures for A and B stimuli, respectively. An additional regressor for all other trials, as well as a regressor including motor responses, was entered into the GLM. Furthermore, six motion correction parameters were added as regressors of no interest to minimize false-positive activations due to task-correlated motion (Johnstone et al., 2006). In total, this resulted in 16 conditions for each of the four sessions.
To assess differences in activity, two types of contrasts were calculated. First, we contrasted all first presentations to repetitions (first > repetitions) to capture activation due to the immediate repetition of a stimulus (repetition suppression). Conversely, we contrasted lures to repetitions (lures > repetitions) to identify voxels that show less repetition suppression to lures compared with repetitions. All models were calculated in native space.
Cross-participant alignment for univariate group analyses.
To visualize and compare group activity levels in the HC, we created a sample specific template for optimal cross-participant alignment of the functional data (Avants et al., 2010, 2011) using Region-of-Interest Advanced Normalization Tools (ROI-ANTs; Klein et al., 2009). This nonlinear diffeomorphic mapping procedure optimizes regional alignment (based on anatomically defined ROIs) across subjects. The sample-specific template was constructed based on coregistered individual MP-RAGE images of all 19 subjects. For subsequent ROI-based alignment, regions in the hippocampal head and body, as well as in the EC, PRC, and PHC, were segmented on specific slices on the T1 template. We then applied the expectation-based point set registration to register the individual MP-RAGE images to the T1 template based on the labeled point sets (= MTL ROIs). Each participant's contrast image for lures > repetitions and firsts > repetitions was then aligned to the sample-specific template space. Finally, the aligned contrast images were submitted to a second-level group analysis in SPM (one-sample t test).
Simulation of type-1 error rates.
To determine the probability of false-positive clusters (type 1 error) for a given smoothness, voxelwise threshold (p < 0.005), and cluster size, we used 3dClustSim implemented in AFNI (http://afni.nimh.nih.gov/afni/). These analyses were restricted to the bilateral HC because our hypotheses were specifically focused on neural processing within the subfields of the HC. 3dClustSim computes the cluster size threshold at chosen values for the α significance level and voxelwise threshold (α = Prob(Cluster ≥ given size)). 3dClustSim requires an estimate of the spatial correlation across voxels, which was determined in SPM with respect to the applied smoothing kernel of 2 mm (FWHM = 2.5 × 2.8 × 2.1 mm3). For visualization, second-level result maps were thresholded at pvoxel level < 0.005 and a cluster size of 35 voxels. The type 1 error rates of the resulting clusters are listed in Table 1.
Table 1.
Group activation after ROI-based alignment
| Cluster size | Cluster puncorr | Alpha (sim) | Peak T | Peak location | Template x, y, z (mm) | Hemisphere |
|---|---|---|---|---|---|---|
| Contrast lures vs repetitions | ||||||
| 41 | 0.005 | <0.05 | 4.14 | DG (head) | 22.4 28.1 −18.6 | R |
| 16 | 0.061 | >0.05 | 3.73 | CA1/DG (body) | 25.6 11.8 −10.1 | R |
| Contrast firsts vs repetitions | ||||||
| 55 | 0.003 | <0.05 | 5.39 | CA1 (body) | 18.4 16.9 −9.3 | R |
| 25 | 0.031 | >0.05 | 5.69 | CA1 (body) | −22.4 13.1 −12.7 | L |
| 17 | 0.085 | >0.05 | 4.47 | Subiculum (body) | 23.2 18.6 −15.9 | L |
| 15 | 0.069 | >0.05 | 4.19 | CA1 (body) | −20.0 16.0 −12.5 | R |
| 13 | 0.120 | >0.05 | 3.74 | CA1 (head) | −16.8 13.2 −10.9 | L |
| 12 | 0.107 | >0.05 | 3.36 | Subiculum (body) | −24.8 26.6 −19.6 | L |
Hippocampal subregions showing group-level activation (thresholded at pvoxel level < 0.005; k = 10 voxels; n = 19) for the repetition suppression (firsts > repetitions) and lure-related novelty contrast (lures > repetitions). Alpha levels (type 1 error rates) were simulated using 3dClustSim (AFNI). Regions in bold survive corrections for multiple comparisons.
MVPA.
Raw image data were converted to NIfTI images while preserving the original image parameters. The preprocessing included only slice timing correction (SPM8). We avoided spatial smoothing to keep the high-resolution and fine-grained structure of activity. All models were calculated in native space.
We estimated trial-by-trial activation patterns using an effective approach for rapid event-related designs (Mumford et al., 2012). We obtained each trial's estimate through a GLM including a regressor for that trial as well as another regressor for all other trials. The first derivative of the HRF was included in the model to take individual onset variations of the HRF into account. This process was repeated for each stimulus and resulted in 256 separate GLMs. Therefore, we could include 128 first presentations, 64 repetitions, and 64 lures as samples in the multivariate classification procedure. There were no missing trials and the data were balanced in terms of samples for stimulus A and B for every run.
For our main analysis, we did not remove the mean pattern (“cocktail blank removal”; Op de Beeck, 2010) or the mean value of the ROI (“mean centering”; Coutanche, 2013) from our multivoxel patterns before our MVPA because recent studies have highlighted the negative effects of mean pattern removal (e.g., inducing negative correlations; Garrido et al., 2013; Walther et al., 2015), but also argue against the removal of the mean value (Davis and Poldrack, 2013).
Trial estimates (64 per session, 256 in total) were analyzed for multivariate effects using PyMVPA 2.2.0 (Hanke et al., 2009). Each sample consisted of the β estimate of a specific trial as well as its first derivative. Independent data chunks were defined by each of the four sessions. For the purpose of evaluation of classification validity, a leave-one-run-out cross-validation was performed. In each of the four validation steps, a linear support vector machine (Chang and Lin, 2011) was trained on the data of three runs and tested on the remaining run. We followed an anatomical feature selection approach (see “Segmentation of subregions in the MTL” section). Therefore, the analysis was done for each condition (first presentations, repetitions, and lures), hippocampal subregion (subiculum, CA1, CA2/3, and DG) and subject. In a second analysis, this was also done for the EC, PRC, and PHC. Because the regions in the anterior MTL are more affected by signal dropouts, this analysis was done separately and excluded four subjects with dropouts in the EC or PRC. Accuracy of the validation step was calculated as the proportion of the samples that were classified correctly. Overall classification accuracy was defined as the mean accuracy of all four validation steps. There were more trial estimates for first presentations (128) compared with repetitions and lures (64). To parallel the analysis, we randomly chose 64 first presentations that were balanced between stimulus A and B, as well as run one to four. This procedure was repeated 100 times and decoding accuracies were averaged across all permutations.
Group analysis.
Results were first tested for significance using one-sample t tests and permutation testing was also applied. We averaged the accuracy of all subjects to get the “true” group accuracy value. In a second step, we relabeled the samples of the training set 1000 times and tested them on the testing set using the same leave-one-run-out cross-validation scheme as before. This was to generate the individual null distributions that we used to calculate 1000 group means. Finally, we used the 1000 group means to generate the group null distribution. By comparing the “true” group accuracy value, we could identify the rank and thus the p-value (1000 permutations allow for p < 0.001) of the true group accuracy value (Nichols and Holmes, 2002). We used a 3 × 4 repeated-measures ANOVA with the within-subject factors condition (first presentations, repetitions, and lures) and subfield (subiculum, CA1, CA2-3, and DG) to test whether there are significant differences in classifier performance across task conditions and hippocampal subfields. Greenhouse–Geisser correction was used to correct for violations of sphericity.
Segmentation of subregions in the MTL
For each subject, ROIs for the subfields of the HC were traced manually on the high-resolution T2*-weighted images acquired orthogonal to the long axis of the HC (Fig. 2A,B). The coregistered T1-weighted MPRAGE images provided additional information due to different contrast, lower slice thickness, and less susceptibility artifacts. This was the case especially in the anterior MTL, including the PRC and EC. Therefore, the EC, PRC, and PHC were labeled manually only on the high-resolution T1-weighted MPRAGE images. All ROIs were coregistered and resliced to the mean functional image. Finally, segmented masks were verified and adjusted (if necessary) on the mean functional images (see Fig. 2C for the overlay of masks on a mean EPI).
Figure 2.
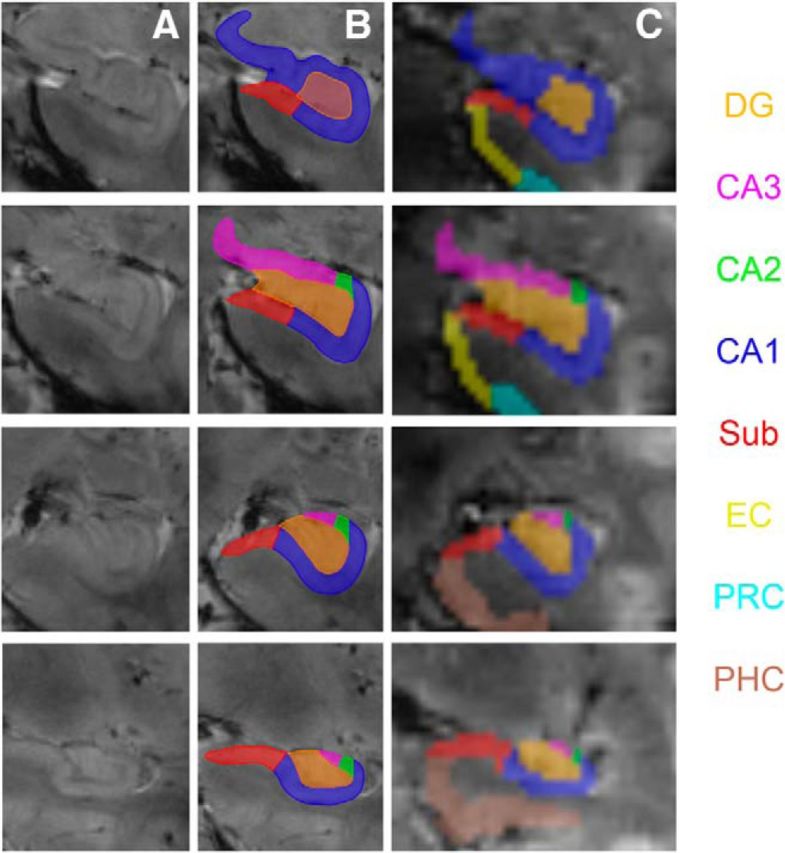
Segmentation of MTL subregions and hippocampal subfields. Hippocampal ROIs were traced on high-resolution T2* images (A, B), whereas EC, PRC, and PHC were traced on the high-resolution T1 images. All ROIs were later coregistered and resliced to the mean functional image (C). sub, Subiculum.
ROIs were identified in bilateral MTL and traced on consecutive coronal slices. Segmentation was performed for each hemisphere separately using a freehand spline drawing tool based on MeVisLab (MeVis Medical Solutions). This tool provided a user-friendly interface for spline drawing and editing, with which the outer borders of the ROIs were traced closely. The freehand drawing technique offers a higher accuracy than conventional voxel-by-voxel drawing techniques. The outer border contours were converted to NIfTI images for further processing (Wisse et al., 2012; Kuijf, 2013).
Subfields in the head and body of the HC were traced according to the recently published protocol for hippocampal subfield segmentation at 7 T (Wisse et al., 2012). The hippocampal head and body was divided into the subiculum, CA1, CA2, CA3, and DG. For further analyses, the CA2 was collapsed with CA3 to a combined CA2-3 region.
An important aim in our study was to separate the DG and CA3 functionally. The Wisse et al. (2012) protocol is the only segmentation protocol that enables the division of these subfields on 7 T MRI data. However, it has to be noted that the suggested boundary between CA3 and DG slightly underestimates CA3 because it does not include the part of CA3 that is folded within DG. Because this boundary was not visible on our T2*-weighted images, we relied on the geometrical boundary suggested by the protocol because it can be identified and replicated across subjects reliably. The hippocampal tail was not delineated.
Tracing of the EC started anteriorly at the level of the amygdala, moving caudally along the parahippocampal gyrus. In the anterior part, the EC borders the amygdala nuclei medially (Fischl et al., 2009). As soon as the gyrus ambiens disappears and the hippocampal fissure opens, the EC borders the parasubiculum medially. Laterally, the EC borders the PRC. The opening of the collateral sulcus typically coincides with the lateral border of the EC and was therefore chosen as the lateral boundary. Contrary to other protocols for the EC and PRC (Insausti et al., 1998), the part of the EC within medial banks of the collateral sulcus that depends on the depth of the collateral sulcus was not segmented because this border shows remarkable within- and between-subject variability and is also sometimes difficult to identify due to partially occurring susceptibility artifacts.
The PRC was defined as the region between the medial and lateral edges of the collateral sulcus (covering medial and lateral banks). Segmentation of the PHC started one slice after the disappearance of the collateral sulcus directly posterior to PRC and EC. Labeling was continued posteriorly, ending on the last slice, where the inferior and superior colliculi were jointly visible. The PHC was delineated as the region between subiculum (medial border) and the deepest point of the collateral sulcus (Zeineh et al., 2001) (see Fig. 2C for examples).
Results
Behavioral performance
During the memory task, subjects saw sequences with several presentations of the same two stimuli (A and B; Fig. 1). Their task was to indicate the third occurrence of the first stimulus seen in a sequence via button press. Given this, the subjects were required to distinguish between the two similar stimuli in each of the sequences. To assess subjects' behavioral performance, button presses were evaluated. Missed or invalid button presses were counted as incorrect responses. The average incorrect rate was 2% (corresponding to 3 false sequences), indicating that subjects were highly accurate in discriminating between the similar scenes. After the MRI session, subjects were asked to draw both scenes in as detailed a manner as possible. These debriefings confirmed the results and showed that all of the remaining 19 subjects had a highly detailed memory for the whole indoor scene.
DG shows less repetition suppression for lures compared with repetitions
The sequences that were used in the task consisted of presentations of the same two stimuli. Both stimuli (A and B) had the same probability to be the first stimulus (target) in a given sequence. The second stimulus within a sequence could be either a repetition of the first one or a presentation of the other stimulus. We refer to the presentation of the other stimulus as a lure trial and to the exact repetition of a stimulus as a repetition trial. Note that, in contrast to earlier studies, being a lure or a repetition stimulus was independent of the identity of the stimulus. This depended only on the position within the sequence.
Two different contrasts were analyzed. First, we assessed which regions show repetition suppression by comparing all first presentations within each sequence (the first stimulus of each sequence) with repetitions (first > repetitions). Second, we contrasted all lure trials against repetitions (lures > repetitions). To assess the regions that were significantly activated across subjects, we calculated second-level group activation maps after cross-participant alignment using ROI-ANTS (see Materials and Methods). Activated clusters were identified within bilateral HC (small-volume correction: pvoxel-level < 0.005 and pcluster< 0.05; see Materials and Methods for details). Higher activation in first presentations compared with repetitions was found in the right CA1 (Fig. 3A, Table 1). However, there were no voxels that showed significant repetition enhancement (i.e., repetition > first). We did observe significantly higher activation for lure trials compared with repetitions in the DG of the right anterior HC (Fig. 3A, Table 1). Additional activation clusters in the subiculum, CA1, and CA1/DG that did not survive multiple comparisons can be found in Table 1. For completeness, we also show the β estimates across all conditions from all anatomical ROIs that can be found in Figure 4.
Figure 3.

Univariate group results. A, Custer in CA1 (top row) shows significantly more activity in first presentations compared with repetitions. However, the cluster in the anterior DG (bottom row) shows significantly higher activation in lures compared with repetitions. Both clusters are in the right HC. Results are small-volume corrected for the bilateral HC (pvoxel-level < 0.005 and pcluster < 0.05). Images on the right show a coronal view and those on the left show a sagittal view. B, Beta estimates extracted from clusters in DG (left) and CA1 (right). Error bars indicate SEM. C, Stimulus-specific novelty contrasts. Clusters of activity resulting from lure-related novelty contrasts of individual stimuli. A, Lure A > repetition A; B, lure B > repetition B. C, sagittal view. Results are illustrated on the group T1 template (pvoxel-level < 0.005, k ≥ 10 voxels).
Figure 4.

Beta estimates across MTL regions. Beta estimates were extracted for each MTL region and hippocampal subfield for first presentations, repetitions, and lures.
We extracted mean β estimates for the significantly activated clusters on the group level in the right CA1 and DG. Mean activity within these clusters is shown for first presentations, repetitions, and lures in Figure 3B.
An exploratory analysis was done to further investigate the nature of the novelty signal related to lures and determine whether there are distinct novelty signals for the two different stimuli. As mentioned previously, this was only possible due to the use of few stimuli in our paradigm (cf. trial unique stimuli in Bakker et al., 2008). Therefore, we calculated the individual contrasts for stimulus A and B (lure A > repetition A and lure B > repetition B). The different contrasts yielded two spatially related but distinct clusters in the anterior DG. Although neither cluster (cluster A: pvoxel-level < 0.005 (unc), k = 10 voxels; cluster B: pvoxel-level < 0.005 (unc), k = 30 voxels; Figure 3C) survived multiple comparisons, interestingly, the two resulting clusters were entirely nonoverlapping (i.e., the two clusters did not share any voxels in common).
DG but not other subregions contains representational stimulus information
To assess the fine-grained activity patterns for A and B stimuli, a multivariate classifier (linear CSVMC) was trained on the A and B stimulus trials from three runs. Classifier performance was then tested on the unseen portion of trials corresponding to the left-out run (see Materials and Methods). This analysis was performed separately for first presentation, repetition, and lure trials. Each classifier yielded an accuracy value for each condition (first presentation, repetition, and lure trials) and hippocampal subfield (subiculum, CA1, CA2/CA3, DG) for each participant (Fig. 5A). For every analysis, a comparison between the accuracies in the left and right hemisphere was conducted using 2 × 4 repeated-measures ANOVAs with the within-subject factors hemisphere and subfield. None of these tests demonstrated any significant hemispheric differences, so all results reported are collapsed across hemispheres.
Figure 5.

Classification accuracies for first presentations, repetitions, and lures across hippocampal subfields and extrahippocampal MTL structures. A linear classifier (linear support vector machine) was trained to distinguish between the presentation of stimulus A and B. A, Although classification accuracies (in percentages) for hippocampal subfields are not significantly different from chance level (50%) in first presentations and repetitions, they exceed chance level significantly for lure-related activity in the DG (permutation testing: p = 0.001, t test: p < 0.001). B, Classification accuracies (in percentges) in extrahippocampal regions in the MTL are neither significantly different from chance level in first presentations, repetitions, and lures. The dashed line indicates chance level. Error bars indicate SEM. sub, Subiculum.
Mean group classifier accuracies were tested for significance using nonparametric permutation testing as well as one-sample t tests (see Materials and Methods). Mean group classification performance in the top 1% of the random permutations indicated above-chance accuracy (at p < 0.001). It was not possible to decode stimulus identity from first presentations or repetition trials with accuracies significantly above chance. Classifier accuracies derived from lure trials were significantly different from chance level (50%) only in DG (M = 57.2%, SEM = 1.6, permutation testing: p = 0.001, t test: t(18) = 4.6, p < 0.001) (corrected for multiple comparisons using Holm's sequentially rejective Bonferroni correction with an initial critical α of p < 0.004).
To test whether classifier performance is significantly different within the 4 hippocampal subregions across the 3 task conditions, we performed a 3 × 4 repeated-measures ANOVA with the within-subject factors condition (first presentation, repetition, and lure trials) and subfield (subiculum, CA1, CA2-3, and DG). This ANOVA revealed a significant main effect for the factor condition (F(1.2,21.6) = 4.2, p = 0.047, Greenhouse–Geisser corrected) and a significant condition × subfield interaction (F(3.29,59.15) = 4.4, p = 0.006, Greenhouse–Geisser corrected). This was due to significantly higher classification accuracy during lure trials in DG (M = 57.2, SEM = 1.6) compared with the subiculum (M = 51, SEM = 1.5, t(18) = −2.5, p = 0.02), CA1 (M = 48.8, SEM = 1.9, t(18) = −3.7, p = 0.002), and CA2-3 (M = 51.7, SEM = 1.5, t(18) = −2.4, p = 0.03). Furthermore, classification accuracy was higher in DG during lure trials (M = 57.2, SEM = 1.6) compared with first presentation trials (M = 49.4, SEM = 0.8, t(18) = −5.3, p = 0.000) and repetition trials (M = 48.6, SEM = 2.4, t(18) = −3, p = 0.008, corrected by using Holm's sequentially rejective Bonferroni correction, with an initial critical α of p < 0.01; Fig. 5A, Table 2). In other words, when A and B were presented as lures, they could be decoded from each other, whereas this was not possible when A and B were presented as first presentations or repetitions.
Table 2.
Mean classifier accuracies for firsts, repetitions, and lures in MTL structures and hippocampal subfields
| MTL structures |
Hippocampal subfields |
||||||
|---|---|---|---|---|---|---|---|
| PHC | PRC | EC | SUB | CA1 | CA2-3 | DG | |
| Firsts | |||||||
| Mean | 49.8 | 49.5 | 49.6 | 50.6 | 51 | 49.9 | 49.4 |
| SEM | 0.5 | 0.5 | 0.8 | 0.8 | 1 | 0.5 | 0.8 |
| pt test | 0.78 | 0.42 | 0.63 | 0.43 | 0.34 | 0.79 | 0.88 |
| ppermutation | 0.652 | 0.645 | 0.644 | 0.332 | 0.229 | 0.528 | 0.687 |
| Repetitions | |||||||
| Mean | 51.3 | 53.4 | 49 | 50.5 | 50.5 | 50.9 | 48.6 |
| SEM | 1.2 | 2.0 | 1.6 | 2.0 | 1.6 | 1.4 | 2.4 |
| pt test | 0.32 | 0.11 | 0.53 | 0.81 | 0.76 | 0.52 | 0.56 |
| ppermutation | 0.224 | 0.015 | 0.741 | 0.093 | 0.716 | 0.245 | 0.092 |
| Lures | |||||||
| Mean | 49.6 | 51.7 | 52.2 | 51 | 48.8 | 51.7 | 57.2 |
| SEM | 2.1 | 1.8 | 2.1 | 1.5 | 1.9 | 1.5 | 1.6 |
| pt test | 0.85 | 0.36 | 0.32 | 0.52 | 0.53 | 0.25 | 0.00* |
| ppermutation | 0.584 | 0.126 | 0.066 | 0.234 | 0.773 | 0.120 | 0.001* |
Classification accuracies were tested for significance using one-sample t test (pt test) as well as permutation tests with 1000 iterations and a leave-one-run-out cross-validation approach (ppermutation). Please note that the analysis regarding MTL structures corresponds to n = 15 (due to dropout in the anterior temporal lobe), whereas the subfield analysis involved n = 19. SUB, Subiculum.
*Corrected results using Holm's sequentially rejective Bonferroni correction with an initial critical α of p <0.004.
In an additional analysis focused on decoding stimulus identity during lure trials, we applied mean removal (mean centering) before the MVPA, which yielded a very similar pattern of results. Permutation and t tests confirmed that it was possible to significantly decode stimulus information of lures from the DG but not from other subfields (DG: pperm = 0.000, pttest = 0.000; CA1: pperm = 0.923, pttest = 0.362; CA2-3: pperm = 0.118, pttest = 0.224; SUB: pperm = 0.207, pttest = 0.568). The 1 × 4 ANOVA comparing the decoding accuracy across conditions in DG again showed a significant main effect of condition (F(3,54) = 5.1, p = 0.004). This was due to significantly higher classification accuracy during lure trials in DG (M = 56.4, SEM = 1.4) compared with the subiculum (M = 50.8, SEM = 1.4, t(18) = −2.5, p = 0.024), CA1 (M = 48.1, SEM = 2, t(18) = −3.8, p = 0.001), and CA2-3 (M = 51.8, SEM = 1.4, t(18) = −2.2, p = 0.039, corrected by using Holm's sequentially rejective Bonferroni correction with an initial critical α of p < 0.0125).
An interesting question concerns why we were able to decode stimuli A and B successfully in the DG region during lure trials, but not first presentations or repetitions. Because the ability to decode two stimuli (i.e., classifier accuracy) depends on the extent to which their representations (or multivoxel patterns) overlap, we considered how this might change as a function of trial type. To do this, we conducted a simulation in which the underlying representations of stimulus A and B were overlapping, given their high level of perceptual similarity. For example, whereas stimulus A might activate units 1–5, stimulus B activates 3–7. Therefore, the nature of representations in our simulation is consistent with theoretical models suggesting that, when there are small differences between input patterns (e.g., within the EC), neural representations within DG will still overlap to a substantial degree (O'Reilly and McClelland, 1994; Knierim and Neunuebel, 2016).
Based on previous work showing that neurons show repetition suppression in similar settings to our own (Miller and Desimone, 1994; Hölscher and Rolls, 2002), in which the stimulus set is small and extensively familiarized, we assumed that the first presentation would maximally activate units, whereas second presentations (repetitions, lure trials) would activate these units to a lesser degree (i.e., in our model, the r parameter specifies the degree to which neurons respond: e.g., 0.2 means 20% of their response on the first presentation). Consider, for example, a lure trial (e.g., stimulus A followed by stimulus B; Fig. 6A): units 3–5 (i.e., that respond to both stimuli) would show reduced activity (i.e., 20%) compared with units 6–7 (i.e., that show selective response to stimulus B), which would show maximal activity (100%), with units 1–2 (i.e., selective for stimulus A) being inactive when stimulus B is being presented given that the delay between stimuli was ∼3.5 s.
Figure 6.

Simulation of degree of representational overlap of the two stimuli in DG as a function of trial type. A, We assume that the underlying patterns of stimulus A and B are partially overlapping in DG, consistent with theoretical models (O'Reilly and McClelland, 1994; Knierim and Neunuebel, 2016). Although stimulus A activates units 1–5, stimulus B activates units 3–7. We further assume that first presentations activate these units maximally, whereas repetitions activate these units with decreased activity. For lure trials, we assume that the initially activated units (e.g., from stimulus A) are inactive by the time of the lure presentation ∼3.5 s later (e.g., stimulus B). B, Euclidean distance between the two patterns of activity (i.e., relating to stimulus A and B) as a function of trial type (first presentation, repetition, lure) and the amount of repetition suppression (i.e., the r parameter). See main text for details.
To evaluate the effect of the amount of repetition suppression, we varied the r parameter and calculated the Euclidean distance between the two activity patterns (i.e., pertaining to stimuli A and B), a metric that naturally relates to the ability of a classifier to decode the stimuli. Our simulation shows that as the amount of repetition suppression increases (i.e., as r decreases), the Euclidean distance between activity patterns increases during lure trials, whereas there is no effect of the r parameter during first or repetition trials (Fig. 6B). This implies that, if a region exhibits repetition suppression (Miller and Desimone, 1994) to any degree, the ability of a classifier to decode two similar stimuli with representations that overlap will be greater during lure trials compared with first and repetition trials. Therefore, our simulations provide one possible explanation for successful decoding in the DG region only during lure trials. It is worth noting, however, that we cannot entirely exclude other potential explanations for the profile of findings observed, including those related to the task being performed.
No evidence for representational information in regions upstream of the MTL
To investigate whether the two similar stimuli are already separable in regions upstream the MTL, we trained another linear support vector machine in a separate analysis on the voxels of the EC, PRC, and PHC in repetition and lure trials. Because four subjects had signal dropouts in the anterior EC, we performed a separate analysis including only 15 subjects to prevent any bias of the results. Again, the results did not differ significantly across hemispheres, so all results reported are collapsed across hemispheres. It was not possible to decode stimulus identity with above-chance accuracy in extrahippocampal regions in repetition or in lure trials (Fig. 5B, Table 2).
Discussion
We used 7 T ultra-high-resolution fMRI to measure activity in medial temporal brain regions and hippocampal subfields in a memory task that putatively imposed high demands on pattern separation. Convergent results from multivariate and univariate analyses indicate that the DG, but not other hippocampal subfields, EC, PRC, or PHC harbors detectably distinct neural representations for similar events. These findings provide strong evidence that the human DG performs pattern separation.
In our paradigm, stimuli A and B were highly familiar because they were experienced before the fMRI scanning and used repeatedly in the experiment. Despite this high level of familiarity, we expected to observe novelty responses based on previous findings in the well established A-B-B-A type paradigm used in nonhuman primate studies, in which repetition suppression responses are typically observed even if the same stimuli are used repeatedly across sequences (Miller and Desimone, 1994; Hölscher and Rolls, 2002). Indeed, we did observe repetition suppression effects in which items that were repeated within a sequence elicited reduced neural responses (cf. first presentations) in CA1. However, increased responses related to lure stimuli (cf. exact repetitions) were found exclusively in the DG. We refer to the activity increase for lures as “novelty” because, in any given short sequence, they appeared for the first time. Therefore, unlike previous studies (Bakker et al., 2008; Lacy et al., 2011), this within-sequence “novelty” was not related to the use of trial unique stimuli, but rather to the first appearance in a sequence.
As mentioned previously, the lure-related novelty responses that we observed in the DG (and in DG/CA3 in Bakker et al., 2008) do not alone provide sufficient evidence to justify the inference of the operation of pattern separation computations in this region because they are also consistent with the hypothesis that they reflect generic novelty signals produced by a match–mismatch process (Kumaran and Maguire, 2009). Importantly, we provide two lines of evidence to bolster the validity of an inference about pattern separation from such novelty responses. First, our results suggest that novelty responses for different lures (A and B) were topographically distinct in right anterior DG as determined by nonoverlapping subsets of voxels, as would be predicted by idealized models of pattern separation (McClelland et al., 1995; Norman and O'Reilly, 2003) in which even very similar stimuli are represented by orthogonal representations. Notably, we were able to achieve this through a paradigm optimized to detect this effect through the use of only two stimuli (cf. trial unique in Bakker et al., 2008) and ultra-high-resolution fMRI.
Second, our study also afforded the unique opportunity to combine MVPA with univariate analyses to characterize the link between these lure-related novelty responses and the underlying representations of the two stimuli. MVPA allowed us to determine whether fine-grained patterns of distributed voxels within a region represent discriminative information (Norman et al., 2006; Sapountzis et al., 2010; Jimura and Poldrack, 2012). This MVPA analysis revealed representational stimulus information selectively in DG, but not in CA2-3 or CA1. Decoding accuracies were not only significantly higher in DG compared with any other hippocampal subregion, it was also not possible to significantly decode stimulus information in regions upstream the MTL such as the EC, PRC, or PHC. These results, therefore, demonstrate that representations for similar stimuli overlap in neocortical regions but are less overlapping in the DG (McClelland et al., 1995; O'Reilly et al., 2014).
The accuracies of the multivariate classifier were significantly higher in DG during lure trials compared with first presentations and repetitions. In other words, when A and B were presented as lures, they could be decoded from each other, whereas this was not possible when presented as first presentations or repetitions. Our simulation (Fig. 6) provides a mechanistic account for these effects by showing that, for a region that shows repetition suppression, the ability of a classifier to distinguish activity patterns is higher in lure trials (cf. first presentations, repetitions). Although the DG region tended to show repetition suppression (Fig. 4), this was not significant at the statistical threshold used. However, given that our model shows that enhanced decodability is a continuous function of the degree to which the region shows repetition suppression (i.e., the r parameter in our model: Fig. 6), our simulations support one potential reason that successful decoding was possible in the DG region only during lure trials.
Together with the results of the univariate analyses, our findings suggest that, at least in our paradigm, lure-related novelty responses do indeed reflect neural representations that are pattern separated in DG. Further, the combination of univariate results and successful multivariate decoding demonstrate that stimulus representations in the DG are both stable (i.e., across repetitions) and dynamic (i.e., show lure-related novelty responses). Although this result provides novel evidence about the nature of representations within the human DG, it does not necessarily arbitrate between models that include the potential for learning within connections between the EC and DG (Treves and Rolls, 1992), in contrast to those that favor fixed random projections between these two regions (O'Reilly and McClelland, 1994).
Interestingly, we did not find lure-related novelty responses or significant stimulus information at the multivariate level in the CA3 region, the main target of projections from the DG. There are several potential explanations for our findings: first, our results parallel previous neurophysiological evidence showing that the correlation between population activity recorded while the rat experienced two very similar environments was considerably lower in DG than in CA3 (Leutgeb et al., 2007) under conditions that have parallels with our paradigm (i.e., the two environments were highly similar, akin to stimulus A and B in our experiment, which differed by the location of only two objects). Interestingly, in the Leutgeb et al. (2007) study, this difference between DG and CA3 disappeared as the environments morphed into more dissimilar shapes, when representations in both subregions were effectively decorrelated between the two environments. Second, from an anatomical perspective, a degree of reduction of the orthogonality of representations in CA3 (cf. DG) would be expected based on the convergent nature of anatomical projections from DG to CA3 (Treves and Rolls, 1994). Third, recent evidence suggests that the rodent CA3 may be functionally divided into proximal and distal regions as a function of their proximity to the DG, with the functional (i.e., in terms of pattern separation) and anatomical (i.e., in terms of amount of recurrent excitatory connections) properties of the proximal CA3 being more akin to the DG. Given that we effectively collapsed across proximal and distal CA3 regions, one would predict, based on recent evidence, that representations in CA3 would be less pattern separated than DG (Lee et al., 2015).
Our findings, therefore, are highly consistent with previous studies in rodents (Leutgeb et al., 2007; Neunuebel and Knierim, 2014; Lee et al., 2015). It is important to note, however, that DG and CA3 are functionally embedded into a distributed network of brain regions that comprise other hippocampal subfields as well as extrahippocampal MTL structures. To understand the network-level organization of pattern separation, it is necessary to simultaneously investigate activity in all of these regions and thereby to determine whether pattern separation is limited to DG/CA3. fMRI allows such coverage and therefore offers the potential to provide a comprehensive understanding of the network-level organization of pattern separation processes.
fMRI studies showed that patterns of activity across the HC can reliably distinguish between different episodic events even if they were highly similar (Chadwick et al., 2011; Bonnici et al., 2012b). Hippocampal activity patterns of very similar scenes were also more distinct within the HC compared with regions upstream of the MTL (Bonnici et al., 2012b). These studies, therefore, provide evidence that the HC as a whole supports pattern separation, but do not localize this computation to any subregion. Although a recent study presented evidence that multivariate voxel patterns of two similar environments were more distinct in DG/CA3 compared with CA1, the interpretation of this finding is complicated because this analysis did not involve a direct comparison of the representations of the two similar environments in DG/CA3 and CA1. Instead, a “remapping” index was computed (Kyle et al., 2015) by comparing the representational similarity of each environment to itself (i.e., measure of consistency) with its average representational similarity to all other environments. Further, this study was not able to localize their effects to the DG region specifically, as in our study. One other study showed that it is possible to decode representations of similar scenes from hippocampal subfields (Bonnici et al., 2012a) and accuracy of decoding was not significantly different between subfields. Compared with these previous MVPA studies at 3 T, our ultra-high-resolution fMRI at 7 T provided us with an opportunity to search for representations at a 6- to 7-fold smaller scale. A single voxel in our study would contain ∼30,000 granule neurons, whereas this would have been 200,000 per voxel in earlier high-resolution studies at 3 T (Boldrini et al., 2013). Our methodology therefore was critical in demonstrating that representations of very similar events are indeed less overlapping in DG compared with CA1, CA2-3, and the subiculum.
To summarize, we used ultra-high-resolution 7 T fMRI in combination with a novel paradigm and MVPA to investigate the representation of similar stimuli within human hippocampal subfields. Our MVPA results provide evidence that the representations of highly similar scenes are less overlapping in the DG compared with CA2-3 and other hippocampal subfields, as well as the EC, PRC, and PHC. Further, we demonstrate a mechanistic link between the genesis of lure-related novelty signals in our paradigm and the underlying stimulus representations in DG. Together, our results provide strong evidence that the human DG plays a unique role in pattern separation and suggest that stimulus representations within the DG are both stable and dynamic across time.
Footnotes
We thank the Leibniz Institute for Neurobiology (LIN) for access to the 7T scanner and Michael Hanke, Martin Chadwick, and Yi Chen for helpful discussions with respect to the MVPA.
The authors declare no competing financial interests.
References
- Avants BB, Tustison NJ, Song G, Cook PA, Klein A, Gee JC. A reproducible evaluation of ANTs similarity metric performance in brain image registration. Neuroimage. 2011;54:2033–2044. doi: 10.1016/j.neuroimage.2010.09.025. [DOI] [PMC free article] [PubMed] [Google Scholar]
- Avants BB, Yushkevich P, Pluta J, Minkoff D, Korczykowski M, Detre J, Gee JC. The optimal template effect in hippocampus studies of diseased populations. Neuroimage. 2010;49:2457–2466. doi: 10.1016/j.neuroimage.2009.09.062. [DOI] [PMC free article] [PubMed] [Google Scholar]
- Azab M, Stark SM, Stark CE. Contributions of human hippocampal subfields to spatial and temporal pattern separation. Hippocampus. 2014;24:293–302. doi: 10.1002/hipo.22223. [DOI] [PMC free article] [PubMed] [Google Scholar]
- Bakker A, Kirwan CB, Miller M, Stark CE. Pattern separation in the human hippocampal CA3 and dentate gyrus. Science. 2008;319:1640–1642. doi: 10.1126/science.1152882. [DOI] [PMC free article] [PubMed] [Google Scholar]
- Bakker A, Krauss GL, Albert MS, Speck CL, Jones LR, Stark CE, Yassa MA, Bassett SS, Shelton AL, Gallagher M. Reduction of hippocampal hyperactivity improves cognition in amnestic mild cognitive impairment. Neuron. 2012;74:467–474. doi: 10.1016/j.neuron.2012.03.023. [DOI] [PMC free article] [PubMed] [Google Scholar]
- Boldrini M, Santiago AN, Hen R, Dwork AJ, Rosoklija GB, Tamir H, Arango V, John Mann J. Hippocampal granule neuron number and dentate gyrus volume in antidepressant-treated and untreated major depression. Neuropsychopharmacology. 2013;38:1068–1077. doi: 10.1038/npp.2013.5. [DOI] [PMC free article] [PubMed] [Google Scholar]
- Bonnici HM, Chadwick MJ, Kumaran D, Hassabis D, Weiskopf N, Maguire EA. Multi-voxel pattern analysis in human hippocampal subfields. Front Hum Neurosci. 2012a;6:290. doi: 10.3389/fnhum.2012.00290. [DOI] [PMC free article] [PubMed] [Google Scholar]
- Bonnici HM, Kumaran D, Chadwick MJ, Weiskopf N, Hassabis D, Maguire EA. Decoding representations of scenes in the medial temporal lobes. Hippocampus. 2012b;22:1143–1153. doi: 10.1002/hipo.20960. [DOI] [PMC free article] [PubMed] [Google Scholar]
- Carr VA, Rissman J, Wagner AD. Imaging the human medial temporal lobe with high-resolution fMRI. Neuron. 2010;65:298–308. doi: 10.1016/j.neuron.2009.12.022. [DOI] [PMC free article] [PubMed] [Google Scholar]
- Chadwick MJ, Hassabis D, Maguire EA. Decoding overlapping memories in the medial temporal lobes using high-resolution fMRI. Learn Mem. 2011;18:742–746. doi: 10.1101/lm.023671.111. [DOI] [PMC free article] [PubMed] [Google Scholar]
- Chang CC, Lin CJ. LIBSVM: a library for support vector machines. ACM Transactions on Intelligent Systems and Technology. 2011;27:1–27. [Google Scholar]
- Cohen N, Eichenbaum H. Memory, amnesia and the hippocampal system. Cambridge, MA: MIT; 1993. [Google Scholar]
- Colgin LL, Moser EI, Moser MB. Understanding memory through hippocampal remapping. Trends Neurosci. 2008;31:469–477. doi: 10.1016/j.tins.2008.06.008. [DOI] [PubMed] [Google Scholar]
- Coutanche MN. Distinguishing multi-voxel patterns and mean activation: why, how, and what does it tell us? Cogn Affect Behav Neurosci. 2013;13:667–673. doi: 10.3758/s13415-013-0186-2. [DOI] [PubMed] [Google Scholar]
- Davachi L. Item, context and relational episodic encoding in humans. Curr Opin Neurobiol. 2006;16:693–700. doi: 10.1016/j.conb.2006.10.012. [DOI] [PubMed] [Google Scholar]
- Davis T, Poldrack RA. Measuring neural representations with fMRI: practices and pitfalls. Ann NY Acad Sci. 2013;1296:108–134. doi: 10.1111/nyas.12156. [DOI] [PubMed] [Google Scholar]
- Eichenbaum H. Hippocampus cognitive processes and neural representations that underlie declarative memory. Neuron. 2004;44:109–120. doi: 10.1016/j.neuron.2004.08.028. [DOI] [PubMed] [Google Scholar]
- Fischl B, Stevens AA, Rajendran N, Yeo BT, Greve DN, Van Leemput K, Polimeni JR, Kakunoori S, Buckner RL, Pacheco J, Salat DH, Melcher J, Frosch MP, Hyman BT, Grant PE, Rosen BR, van der Kouwe AJ, Wiggins GC, Wald LL, Augustinack JC. Predicting the location of entorhinal cortex from MRI. Neuroimage. 2009;47:8–17. doi: 10.1016/j.neuroimage.2009.04.033. [DOI] [PMC free article] [PubMed] [Google Scholar]
- Garrido L, Vaziri-Pashkam M, Nakayama K, Wilmer J. The consequences of subtracting the mean pattern in fMRI multivariate correlation analyses. Front Neurosci. 2013;7:174. doi: 10.3389/fnins.2013.00174. [DOI] [PMC free article] [PubMed] [Google Scholar]
- Greve DN, Fischl B. Accurate and robust brain image alignment using boundary-based registration. Neuroimage. 2009;48:63–72. doi: 10.1016/j.neuroimage.2009.06.060. [DOI] [PMC free article] [PubMed] [Google Scholar]
- Hanke M, Halchenko YO, Sederberg PB, Hanson SJ, Haxby JV, Pollmann S. PyMVPA: A python toolbox for multivariate pattern analysis of fMRI data. Neuroinformatics. 2009;7:37–53. doi: 10.1007/s12021-008-9041-y. [DOI] [PMC free article] [PubMed] [Google Scholar]
- Haynes JD. A primer on pattern-based approaches to fMRI: principles, pitfalls, and perspectives. Neuron. 2015;87:257–270. doi: 10.1016/j.neuron.2015.05.025. [DOI] [PubMed] [Google Scholar]
- Haynes JD, Rees G. Decoding mental states from brain activity in humans. Nat Rev Neurosci. 2006;7:523–534. doi: 10.1038/nrn1931. [DOI] [PubMed] [Google Scholar]
- Hölscher C, Rolls ET. Perirhinal cortex neuronal activity is actively related to working memory in the macaque. Neural Plast. 2002;9:41–51. doi: 10.1155/NP.2002.41. [DOI] [PMC free article] [PubMed] [Google Scholar]
- Insausti R, Juottonen K, Soininen H, Insausti AM, Partanen K, Vainio P, Laakso MP, Pitkänen A. MR volumetric analysis of the human entorhinal, perirhinal, and temporopolar cortices. Am J Neuroradiol. 1998;19:659–671. [PMC free article] [PubMed] [Google Scholar]
- Jimura K, Poldrack RA. Analyses of regional-average activation and multivoxel pattern information tell complementary stories. Neuropsychologia. 2012;50:544–552. doi: 10.1016/j.neuropsychologia.2011.11.007. [DOI] [PubMed] [Google Scholar]
- Johnstone T, Ores Walsh KS, Greischar LL, Alexander AL, Fox AS, Davidson RJ, Oakes TR. Motion correction and the use of motion covariates in multiple-subject fMRI analysis. Hum Brain Mapp. 2006;27:779–788. doi: 10.1002/hbm.20219. [DOI] [PMC free article] [PubMed] [Google Scholar]
- Klein A, Andersson J, Ardekani BA, Ashburner J, Avants B, Chiang MC, Christensen GE, Collins DL, Gee J, Hellier P, Song JH, Jenkinson M, Lepage C, Rueckert D, Thompson P, Vercauteren T, Woods RP, Mann JJ, Parsey RV. Evaluation of 14 nonlinear deformation algorithms applied to human brain MRI registration. Neuroimage. 2009;46:786–802. doi: 10.1016/j.neuroimage.2008.12.037. [DOI] [PMC free article] [PubMed] [Google Scholar]
- Knierim JJ, Neunuebel JP. Tracking the flow of hippocampal computation: Pattern separation, pattern completion, and attractor dynamics. Neurobiol Learn Mem. 2016;129:38–49. doi: 10.1016/j.nlm.2015.10.008. [DOI] [PMC free article] [PubMed] [Google Scholar]
- Kuijf HJ. Image processing techniques for quantification and assessment of brain MRI (doctoral dissertation) Utrecht University: Utrecht; 2013. ISBN: 978-90-393-6037-8. [Google Scholar]
- Kumaran D, Maguire EA. Novelty signals: a window into hippocampal information processing. Trends Cogn Sci. 2009;13:47–54. doi: 10.1016/j.tics.2008.11.004. [DOI] [PubMed] [Google Scholar]
- Kyle C, Stokes J, Lieberman J, Hassan A, Ekstrom A. Successful retrieval of competing spatial environments in humans involves hippocampal pattern separation mechanisms. eLife. 2015;4:e10499. doi: 10.7554/eLife.10499. pii. [DOI] [PMC free article] [PubMed] [Google Scholar]
- Lacy JW, Yassa MA, Stark SM, Muftuler LT, Stark CE. Distinct pattern separation related transfer functions in human CA3/dentate and CA1 revealed using high-resolution fMRI and variable mnemonic similarity. Learn Mem. 2011;18:15–18. doi: 10.1101/lm.1971111. [DOI] [PMC free article] [PubMed] [Google Scholar]
- Lee H, Wang C, Deshmukh SS, Knierim JJ. Neural population evidence of functional heterogeneity along the CA3 transverse axis: pattern completion versus pattern separation. Neuron. 2015;87:1093–1105. doi: 10.1016/j.neuron.2015.07.012. [DOI] [PMC free article] [PubMed] [Google Scholar]
- Leutgeb JK, Leutgeb S, Moser MB, Moser EI. Pattern separation in the dentate gyrus and CA3 of the hippocampus. Science. 2007;315:961–966. doi: 10.1126/science.1135801. [DOI] [PubMed] [Google Scholar]
- Maass A, Schütze H, Speck O, Yonelinas A, Tempelmann C, Heinze HJ, Berron D, Cardenas-Blanco A, Brodersen KH, Stephan KE, Düzel E. Laminar activity in the hippocampus and entorhinal cortex related to novelty and episodic encoding. Nat Commun. 2014;5:5547. doi: 10.1038/ncomms6547. [DOI] [PMC free article] [PubMed] [Google Scholar]
- Maass A, Berron D, Libby LA, Ranganath C, Düzel E. Functional subregions of the human entorhinal cortex. eLife. 2015;4 doi: 10.7554/eLife.06426. [DOI] [PMC free article] [PubMed] [Google Scholar]
- Marr D. Simple memory: a theory for archicortex. Philos Trans R Soc Lond B Biol Sci. 1971;262:23–81. doi: 10.1098/rstb.1971.0078. [DOI] [PubMed] [Google Scholar]
- McClelland JL, McNaughton BL, O'Reilly RC. Why there are complementary learning systems in the hippocampus and neocortex: Insights from the successes and failures of connectionist models of learning and memory. Psychol Rev. 1995;102:419–457. doi: 10.1037/0033-295X.102.3.419. [DOI] [PubMed] [Google Scholar]
- McHugh TJ, Jones MW, Quinn JJ, Balthasar N, Coppari R, Elmquist JK, Lowell BB, Fanselow MS, Wilson MA, Tonegawa S. Dentate gyrus NMDA receptors mediate rapid pattern separation in the hippocampal network. Science. 2007;317:94–99. doi: 10.1126/science.1140263. [DOI] [PubMed] [Google Scholar]
- Miller EK, Desimone R. Parallel neuronal mechanisms for short-term memory. Science. 1994;263:520–522. doi: 10.1126/science.8290960. [DOI] [PubMed] [Google Scholar]
- Mumford JA, Turner BO, Ashby FG, Poldrack RA. Deconvolving BOLD activation in event-related designs for multivoxel pattern classification analyses. Neuroimage. 2012;59:2636–2643. doi: 10.1016/j.neuroimage.2011.08.076. [DOI] [PMC free article] [PubMed] [Google Scholar]
- Neunuebel JP, Knierim JJ. CA3 retrieves coherent representations from degraded input: direct evidence for CA3 pattern completion and dentate gyrus pattern separation. Neuron. 2014;81:416–427. doi: 10.1016/j.neuron.2013.11.017. [DOI] [PMC free article] [PubMed] [Google Scholar]
- Nichols TE, Holmes AP. Nonparametric permutation tests for functional neuroimaging: a primer with examples. Hum Brain Mapp. 2002;15:1–25. doi: 10.1002/hbm.1058. [DOI] [PMC free article] [PubMed] [Google Scholar]
- Norman KA, O'Reilly RC. Modeling hippocampal and neocortical contributions to recognition memory: a complementary-learning-systems approach. Psychol Rev. 2003;110:611–646. doi: 10.1037/0033-295X.110.4.611. [DOI] [PubMed] [Google Scholar]
- Norman KA, Polyn SM, Detre GJ, Haxby JV. Beyond mind-reading: multi-voxel pattern analysis of fMRI data. Trends Cogn Sci. 2006;10:424–430. doi: 10.1016/j.tics.2006.07.005. [DOI] [PubMed] [Google Scholar]
- Op de Beeck HP. Against hyperacuity in brain reading: spatial smoothing does not hurt multivariate fMRI analyses? Neuroimage. 2010;49:1943–1948. doi: 10.1016/j.neuroimage.2009.02.047. [DOI] [PubMed] [Google Scholar]
- O'Reilly RC, McClelland JL. Hippocampal conjunctive encoding, storage, and recall: avoiding a trade-off. Hippocampus. 1994;4:661–682. doi: 10.1002/hipo.450040605. [DOI] [PubMed] [Google Scholar]
- O'Reilly RC, Bhattacharyya R, Howard MD, Ketz N. Complementary learning systems. Cogn Sci. 2014;38:1229–1248. doi: 10.1111/j.1551-6709.2011.01214.x. [DOI] [PubMed] [Google Scholar]
- Reagh ZM, Yassa MA. Object and spatial mnemonic interference differentially engage lateral and medial entorhinal cortex in humans. Proc Natl Acad Sci U S A. 2014;111:E4264–E4273. doi: 10.1073/pnas.1411250111. [DOI] [PMC free article] [PubMed] [Google Scholar]
- Rolls ET, Treves A. Neural networks in the brain involved in memory and recall. Prog Brain Res. 1994;102:335–341. doi: 10.1016/S0079-6123(08)60550-6. [DOI] [PubMed] [Google Scholar]
- Sapountzis P, Schluppeck D, Bowtell R, Peirce JW. A comparison of fMRI adaptation and multivariate pattern classification analysis in visual cortex. Neuroimage. 2010;49:1632–1640. doi: 10.1016/j.neuroimage.2009.09.066. [DOI] [PMC free article] [PubMed] [Google Scholar]
- Treves A, Rolls ET. Computational constraints suggest the need for two distinct input systems to the hippocampal CA3 network. Hippocampus. 1992;2:189–199. doi: 10.1002/hipo.450020209. [DOI] [PubMed] [Google Scholar]
- Treves A, Rolls ET. Computational analysis of the role of the hippocampus in memory. Hippocampus. 1994;4:374–391. doi: 10.1002/hipo.450040319. [DOI] [PubMed] [Google Scholar]
- Walther A, Nili H, Ejaz N, Alink A, Kriegeskorte N, Diedrichsen J. Reliability of dissimilarity measures for multi-voxel pattern analysis. Neuroimage. 2015 doi: 10.1016/j.neuroimage.2015.12.012. In press. [DOI] [PubMed] [Google Scholar]
- Williams JR. The Declaration of Helsinki and public health. Bull World Health Organ. 2008;86:650–652. doi: 10.2471/BLT.08.050955. [DOI] [PMC free article] [PubMed] [Google Scholar]
- Wisse LE, Gerritsen L, Zwanenburg JJ, Kuijf HJ, Luijten PR, Biessels GJ, Geerlings MI. Subfields of the hippocampal formation at 7 T MRI: in vivo volumetric assessment. Neuroimage. 2012;61:1043–1049. doi: 10.1016/j.neuroimage.2012.03.023. [DOI] [PubMed] [Google Scholar]
- Worsley KJ, Friston KJ. Analysis of fMRI time-series revisited–again. Neuroimage. 1995;2:173–181. doi: 10.1006/nimg.1995.1023. [DOI] [PubMed] [Google Scholar]
- Yassa MA, Stark SM, Bakker A, Albert MS, Gallagher M, Stark CE. High-resolution structural and functional MRI of hippocampal CA3 and dentate gyrus in patients with amnestic mild cognitive impairment. Neuroimage. 2010;51:1242–1252. doi: 10.1016/j.neuroimage.2010.03.040. [DOI] [PMC free article] [PubMed] [Google Scholar]
- Yassa MA, Lacy JW, Stark SM, Albert MS, Gallagher M, Stark CE. Pattern separation deficits associated with increased hippocampal CA3 and dentate gyrus activity in nondemented older adults. Hippocampus. 2011;21:968–979. doi: 10.1002/hipo.20808. [DOI] [PMC free article] [PubMed] [Google Scholar]
- Zaitsev M, Hennig J, Speck O. Point spread function mapping with parallel imaging techniques and high acceleration factors: fast, robust, and flexible method for echo-planar imaging distortion correction. Magn Reson Med. 2004;52:1156–1166. doi: 10.1002/mrm.20261. [DOI] [PubMed] [Google Scholar]
- Zeineh MM, Engel SA, Thompson PM, Bookheimer SY. Unfolding the human hippocampus with high resolution structural and functional MRI. Anat Rec. 2001;265:111–120. doi: 10.1002/ar.1061. [DOI] [PubMed] [Google Scholar]