

Abstract
Extensive evidence suggests that frontoparietal regions can dynamically update their pattern of functional connectivity, supporting cognitive control and adaptive implementation of task demands. However, it is largely unknown whether this flexibly functional reconfiguration is intrinsic and occurs even in the absence of overt tasks. Based on recent advances in dynamics of resting-state functional resonance imaging (fMRI), we propose a probabilistic framework in which dynamic reconfiguration of intrinsic functional connectivity between each brain region and others can be represented as a probability distribution. A complexity measurement (i.e., entropy) was used to quantify functional flexibility, which characterizes heterogeneous connectivity between a particular region and others over time. Following this framework, we identified both functionally flexible and specialized regions over the human life span (112 healthy subjects from 13 to 76 years old). Across brainwide regions, we found regions showing high flexibility mainly in the higher-order association cortex, such as the lateral prefrontal cortex (LPFC), lateral parietal cortex, and lateral temporal lobules. In contrast, visual, auditory, and sensory areas exhibited low flexibility. Furthermore, we observed that flexibility of the right LPFC improved during maturation and reduced due to normal aging, with the opposite occurring for the left lateral parietal cortex. Our findings reveal dissociable changes of frontal and parietal cortices over the life span in terms of inherent functional flexibility. This study not only provides a new framework to quantify the spatiotemporal behavior of spontaneous brain activity, but also sheds light on the organizational principle behind changes in brain function across the human life span.
SIGNIFICANCE STATEMENT Recent neuroscientific research has demonstrated that the human capability of adaptive task control is primarily the result of the flexible operation of frontal brain networks. However, it remains unclear whether this flexibly functional reconfiguration is intrinsic and occurs in the absence of an overt task. In this study, we propose a probabilistic framework to quantify the functional flexibility of each brain region using resting-state fMRI. We identify regions showing high flexibility mainly in the higher-order association cortex. In contrast, primary and unimodal visual and sensory areas show low flexibility. On the other hand, our findings reveal dissociable changes of frontal and parietal cortices in terms of inherent functional flexibility over the life span.
Keywords: dynamic connectivity, functional flexibility, life span, probabilistic framework, resting-state fMRI
Introduction
Humans are unrivaled in their capacity to adaptively implement a wide variety of goal-directed tasks (Miller and Cohen, 2001; Cole et al., 2011; Heinzle et al., 2012). Emerging evidence suggests that the flexible hubs of the frontoparietal network can dynamically update their pattern of global functional connectivity, supporting implementation adaptive to task demands (Cole et al., 2012, 2013a,b; Spielberg et al., 2015). Functional flexibility of frontal-related brain networks has been further substantiated during working memory processes and learning (Bassett et al., 2011; Braun et al., 2015). However, it is largely unknown whether this flexibly functional reconfiguration is intrinsic, occurring in the absence of overt tasks. Moreover, whether and how these functionally flexible regions change across the human life span remains unknown.
Resting-state functional magnetic resonance imaging (fMRI) is widely used to examine spontaneous brain activity (Biswal et al., 1995; Fox and Raichle, 2007; Friston, 2011). By means of this technique, intrinsic connectivity networks such as the sensorimotor, executive control, and default mode networks have been consistently identified as fundamental, organizational components of brain function (Zhang and Raichle, 2010; Laird et al., 2011; Power et al., 2014). However, this intrinsic network organization is often presumed to be stationary, typically obtained by averaged correlations of BOLD (blood-oxygenation level dependent) signal fluctuations across a whole scanning session (e.g., 5–10 min).
The brain has been described as intrinsically active, rather than passively stimulus-driven (Engel et al., 2013). Extensive research suggests that dynamical organization of ongoing brain activity is endowed with meaningful spatiotemporal structure, enabling the expression of a rich, flexible repertoire of functional configurations (Deco et al., 2011, 2013; Park and Friston, 2013; Barttfeld et al., 2015; Hansen et al., 2015; Shen et al., 2015). Further understanding of this functional organization requires an integrated framework linking brain connectivity to brain dynamics (Liu and Duyn, 2013; Kopell et al., 2014). Therefore, dynamic functional connectivity, which emphasizes the spatiotemporal behavior of intrinsic brain activity, has recently garnered increased attention (Chang and Glover, 2010; Kiviniemi et al., 2011; Jones et al., 2012; Hutchison et al., 2013a; Zalesky et al., 2014; Karahanoğlu and Van De Ville, 2015; de Pasquale et al., 2015; for review, see Hutchison et al., 2013b; Calhoun et al., 2014). The sliding window is commonly used to identify discrete, reproducible functional states (Allen et al., 2014; Barttfeld et al., 2015; Hansen et al., 2015; Shen et al., 2015) or quantify time-varying topological properties of brain functional networks (Zalesky et al., 2014; Liao et al., 2015) over the duration of the scan, and is currently one of the most popular approaches. It is performed by evaluating functional connectivity within a time window of fixed length, then shifting this window in time. However, studies using mathematical modeling to quantify the flexibility of intrinsic brain organization are scarce.
In this study, we proposed a probabilistic framework in which dynamic reconfiguration of intrinsic functional connectivity between each brain region and all others can be represented as a probability distribution. A complexity measurement (i.e., entropy) was then applied to quantify functional flexibility, which characterizes heterogeneous connectivity between a particular region and others over time. Following this framework, we quantified the inherent flexibility of each brain region across the human life span (112 healthy subjects from 13 to 76 years old) using resting-state fMRI. On one hand, we hypothesized that frontoparietal areas would exhibit high flexibility, while unimodal areas such as visual and sensory cortices may demonstrate low flexibility. On the other hand, because the human association cortex, particularly in prefrontal cortex, is late developing and undergoes reorganization in both function and structure throughout maturation (Fuster, 2002; Gogtay et al., 2004; Casey et al., 2005; Fair et al., 2007) and normal aging (Head et al., 2004; Hedden and Gabrieli, 2004; Turner and Spreng, 2012; Li et al., 2015), we expected to find changes in functional flexibility in frontoparietal regions over the human life span.
Materials and Methods
Participants.
We recruited 112 right-handed healthy subjects (67 males) over the age range 13–76 years (median age, 32 years). The degree of education is from 0 to 23 years (median, 9 years). A portion of adolescents and older subjects were selected from healthy control samples of our previous resting-state fMRI studies on stroke (Yin et al., 2014) and adolescent anxiety disorder (Liu et al., 2015). All participants were screened to ensure they had no history of neurological or psychiatric disorders. Informed consent was obtained from all subjects or their guardians. Handedness was evaluated by the Edinburgh Handedness Inventory (Oldfield, 1971). This study was approved by the Ethics Committee of the Institute of Neuroscience, Chinese Academy of Sciences (Shanghai, China).
Data acquisition.
Scanning was performed on a Siemens Trio 3.0 Tesla MRI scanner. All participants underwent both functional and structural MRI. Resting-state fMRI scans of the whole brain were acquired using a T2*-weighted EPI (echoplanar imaging) sequence: repetition time (TR), 2000 ms; echo time (TE), 30 ms; 30 axial slices; thickness, 4 mm; gap, 0.8 mm; field of view (FOV), 220 × 220 mm; matrix, 64 × 64; and 220 volumes. High-resolution T1-weighted images used a magnetization prepared rapid gradient echo sequence: 192 slices per slab; thickness, 1 mm; gap, 0.5 mm; TR, 1900 ms; TE, 3.42 ms; inversion time, 900 ms; FOV, 240 × 240 mm; and matrix, 256 × 256. To screen out organic lesions, T2-weighted images were also collected using a turbo-spin-echo sequence: 30 axial slices; thickness, 5 mm; TR, 6000 ms; TE, 93 ms; FOV, 220 × 220 mm; and matrix, 320 × 320. Subjects did not perform any explicit task before the resting scan. During the resting-state scan, participants were instructed to stay awake but relaxed, with their eyes closed, remain motionless, and refrain from thinking about anything in particular.
MRI data preprocessing.
We performed preprocessing of the fMRI data using Statistical Parametric Mapping (SPM8; http://www.fil.ion.ucl.ac.uk/spm) and Data Processing Assistant for Resting-State fMRI (Yan and Zang, 2010) software. The first 10 volumes were discarded for signal equilibrium and to allow participants' adaption to the scanning environment. The remaining data (210 volumes for each subject) were corrected for delay in slice acquisition and rigid-body head movement. (For previously collected data with 240 volumes in total, we discarded the last 20 volumes to retain identical time points across subjects.) The corrected data were spatially normalized to the MNI (Montreal Neurological Institute) space using a unified segmentation algorithm (Ashburner and Friston, 2005) and resampled to 3 mm isotropic voxels. Spatial smoothing was subsequently conducted using an isotropic Gaussian filter at full-width at a half-maximum of 8 mm. Linear trends were further removed, and the data were then temporally bandpass filtered (0.01–0.08 Hz). Finally, several confounding factors were regressed out as covariates using multiple linear regression, including six head-motion parameters, CSF, and white matter (WM). The residual time series were used for further analysis. Regression of global signal was not performed, which may distort correlation matrices, particularly for sliding window analysis (Saad et al., 2012; Shen et al., 2015).
All participants included in this study exhibited a maximum displacement of <3 mm in each direction and rotation of <3°for each axis during resting-state scan. To correct the possible contaminating effects of slight head motion on the intrinsic functional connectivity network (Power et al., 2012; Van Dijk et al., 2012; Yan et al., 2013; Hutchison and Morton, 2015), head motion M was calculated separately for each participant as the averaged root mean square of the three translations and three rotations:
 |
where L is the length of the time series; xi, yi, and zi are translations; and ri, pi, and qi are rotations at the ith time point, respectively (Liu et al., 2008; Hutchison and Morton, 2015). In consideration of changes in brain volume throughout the human life span, we also evaluated total volume of gray matter (GM) and WM using voxel-based morphometry (Ashburner and Friston, 2000) implemented in SPM8 software. Both head motion and total volume of GM and WM were used as covariates in the following multiple regression analysis.
Dynamic functional connectivity analysis.
For each subject, dynamic functional connectivity was estimated using the sliding window approach (Chang and Glover, 2010; Kiviniemi et al., 2011; Jones et al., 2012; Hutchison et al., 2013a; Allen et al., 2014; Zalesky et al., 2014; Liao et al., 2015). We divided the human brain into 90 regions of interest (ROIs) according to the commonly used Automated Anatomical Labeling (AAL-90) template (Tzourio-Mazoyer et al., 2002; Zalesky et al., 2014; Karahanoğlu and Van De Ville, 2015). The definition and abbreviation of each ROI is listed in Table 1. The AAL atlas is based on anatomical structure, with different sizes for each ROI. Considering the potential effects of parcellation on functional connectivity analysis (Wang et al., 2009; de Reus and van den Heuvel, 2013), we confirmed the reliability of our main findings using a parcellation scheme entailing another 264 putative functional areas (Power-264, spherical ROIs with the same size; Power et al., 2011). The time series of each ROI for a given parcellation was obtained by averaging the residual time courses of all voxels within the ROI. We then used a tapered window, created by convolving a rectangle (width, 22; TRs, 44 s) with a Gaussian curve (σ = 3 TRs) and slid in steps of 1 TR (Allen et al., 2014), resulting in W = 188 windows in total (210 time points for each subject). The window size was selected based on the guidance that it should correspond to the lower limit of frequency content of signal (window length, <0.5/flower = 50 s; here, flower = 0.01 Hz; Sakoğlu et al., 2010). If the chosen window size is too lengthy, fast changes can no longer be modeled. Contrarily, there is insufficient information for the characterization of brain activity for time segments that are too short. In the main analysis, we used a window length of 44 s following previous studies (Sakoğlu et al., 2010; Allen et al., 2014). However, so far, there is no universally accepted criterion for window selection. For example, recent analyses of simulated data suggest that longer window lengths (no shorter than 1/flower of the signal of interest, i.e., 100 s for the current data) are needed to avoid spurious fluctuations in correlation strength (Lindquist et al., 2014; Leonardi and Van De Ville, 2015). Therefore, a larger window length (i.e., 100 s) was also applied for validation of our main findings.
Table 1.
ROIs for constructing the functional brain network
| ROI number | Region | Abbreviation |
|---|---|---|
| 1/2 | Precentral gyrus | PreCG |
| 3/4 | Superior frontal gyrus (dorsal) | SFGdor |
| 5/6 | Orbitofrontal cortex (superior) | ORBsup |
| 7/8 | Middle frontal gyrus | MFG |
| 9/10 | Orbitofrontal cortex (middle) | ORBmid |
| 11/12 | Inferior frontal gyrus (opercular) | IFGoperc |
| 13/14 | Inferior frontal gyrus (triangular) | IFGtriang |
| 15/16 | Orbitofrontal cortex (inferior) | ORBinf |
| 17/18 | Rolandic operculum | ROL |
| 19/20 | Supplementary motor area | SMA |
| 21/22 | Olfactory | OLF |
| 23/24 | Superior frontal gyrus (medial) | SFGmed |
| 25/26 | Orbitofrontal cortex (medial) | ORBmed |
| 27/28 | Rectus gyrus | REC |
| 29/30 | Insula | INS |
| 31/32 | Anterior cingulate gyrus | ACG |
| 33/34 | Middle cingulate gyrus | MCG |
| 35/36 | Posterior cingulate gyrus | PCG |
| 37/38 | Hippocampus | HIP |
| 39/40 | Parahippocampal gyrus | PHG |
| 41/42 | Amygdala | AMYG |
| 43/44 | Calcarine cortex | CAL |
| 45/46 | Cuneus | CUN |
| 47/48 | Lingual gyrus | LING |
| 49/50 | Superior occipital gyrus | SOG |
| 51/52 | Middle occipital gyrus | MOG |
| 53/54 | Inferior occipital gyrus | IOG |
| 55/56 | Fusiform gyrus | FFG |
| 57/58 | Postcentral gyrus | PoCG |
| 59/60 | Superior parietal gyrus | SPG |
| 61/62 | Inferior parietal lobule | IPL |
| 63/64 | Supramarginal gyrus | SMG |
| 65/66 | Angular gyrus | ANG |
| 67/68 | Precuneus | PCUN |
| 69/70 | Paracentral lobule | PCL |
| 71/72 | Caudate | CAU |
| 73/74 | Putamen | PUT |
| 75/76 | Pallidum | PAL |
| 77/78 | Thalamus | THA |
| 79/80 | Heschl gyrus | HES |
| 81/82 | Superior temporal gyrus | STG |
| 83/84 | Temporal pole (superior) | TPOsup |
| 85/86 | Middle temporal gyrus | MTG |
| 87/88 | Temporal pole (middle) | TPOmid |
| 89/90 | Inferior temporal gyrus | ITG |
The regions are defined in the Automated Anatomical Labeling (AAL-90) template. Odd numbers denote regions in the left hemisphere, and even numbers denote regions in right hemisphere.
For a given time window (Wt), a symmetric N × N (N = 90 for the AAL-90 template and N = 264 for the Power-264 parcellation) dynamic functional connectivity matrix Rt was generated, and elements of the matrix, rij, represent the Pearson's correlation coefficient between the time courses of two ROIs, i and j. Dynamic functional connectivity matrices were thus obtained for each participant (Fig. 1A).
Figure 1.

Illustration of the probabilistic model. A, Dynamic functional connectivity matrices at different sliding windows for one participant (here using the AAL-90 atlas). The axes denote ROIs, which are listed in Table 1. The color bar denotes the Pearson correlation coefficients. B, The functional connectivity patterns for a given ROI i at different sliding windows. We used a local thresholding method that reserves its k (k = 5 shown here) strongest functional connections (red lines) at each time window. C, The probability distribution Pi(j … n) reflects the frequency of each connection with i emerged across the temporal windows. A complexity measure (i.e., entropy Hi) was then applied to this probability distribution to quantify functional flexibility of region i.
Probabilistic modeling of dynamic functional connectivity.
We conducted probabilistic modeling for dynamic functional connectivity. For each brain region i, we reserved its k strongest functional connections at each sliding window, following a local thresholding method (Alexander-Bloch et al., 2010); that is, the top k connections were set as 1, and the others were set as 0 (Fig. 1B), so that results are not biased according to the number of connections a brain region has. Moreover, functional brain networks have been regarded as sparse, and weak correlations may represent spurious connectivity (Rubinov and Sporns, 2010; Kaiser, 2011). Thus, the normalized probability distribution Pi(j … n) for a given brain region i was computed as follows (Fig. 1C):
 |
where n(cij) denotes how many times the connection between i and j emerged across temporal windows, k is a predefined threshold indicating number of the strongest connections reserved for region i at each time window, w denotes number of temporal windows, and Pi(j) denotes the probability of occurrence for the connection between regions i and j across all temporal windows. The greater the value of Pi(j), the more frequent the interaction between region i and j across the temporal windows, and vice versa.
Subsequently, a complexity measure (i.e., Shannon entropy) was applied to the probability distribution of each brain region i:
 |
Entropy has been used previously to characterize the heterogeneity of neural networks (Tononi et al., 1994; Zamora-López et al., 2011). Here, Hi was used to quantify functional flexibility, which characterizes heterogeneous connectivity between region i and others over time. A higher value of Hi indicates greater functional flexibility, and vice versa.
To identify an optimal threshold k for the model, we first calculated the entropy for each brain region across a wide range of k (from 1 to 10 with an increased interval of 1). For the purpose of visualization, we present the normalized entropy for each brain region (divided by mean entropy across the whole brain) at each threshold k (Fig. 2). To identify the value of k most sensitive to differences in entropy across the whole brain, a contrast measure for entropy across brainwide regions at each threshold k was subsequently calculated as follows: contrastk = (maxentropy −minentropy)/maxentropy. In addition, the mean ranked correlation of entropy distribution at each threshold k with entropy distribution at every other threshold was defined as consistencyk. The consistency measure was used to identify the value of k where the resulting entropy distribution is most representative of the distributions at other thresholds. We finally summed the two metrics, contrast and consistency, at each threshold k, and the peak value of this total was considered as corresponding to the optimal threshold.
Figure 2.
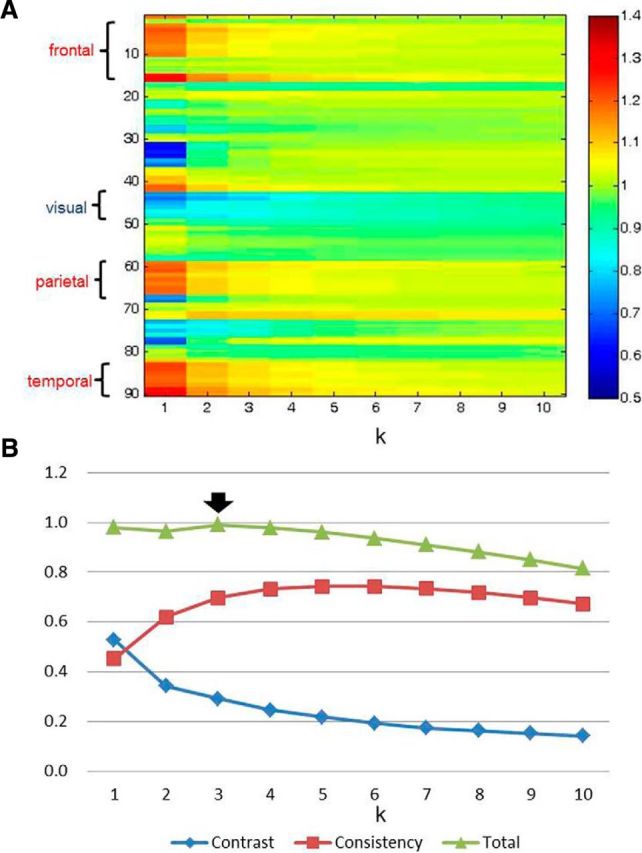
A, The matrix of normalized entropy for each brain region at different threshold k. Regions in the frontal, parietal, and temporal lobes display higher entropy, In contrast, regions in the visual cortex exhibit lower entropy. B, The contrast, consistency, and sum of the two metrics at each threshold k were also computed. The thick black arrow indicates the optimal threshold (k = 3) used in this study.
In the main analysis, we used local thresholding (i.e., retaining the k strongest functional connections for each region; Alexander-Bloch et al., 2010). The extent to which the number of functional connections of a node (using global thresholding, where the correlation is above a threshold) potentially influences flexibility measurement therefore needs to be assessed. Therefore, we considered the mean number of functional connections of a node across all temporal windows as a covariate. The global threshold was selected to ensure that the sparsity of the whole brain network matches with that reserving the top k connections for each node (e.g., sparsity ≈ 3% corresponding to k = 3). We then obtained a general linear model to regress out the covariate. Finally, correlation analysis of entropy across the whole brain was conducted at both group and individual levels (without vs with regressing out the covariate) to validate our main findings.
Identification of functionally flexible and specialized regions.
We performed a one-sample t test comparing the mean entropy of each region across individuals with the global mean value across brainwide regions. Functionally flexible or specialized regions were defined as those with entropy significantly greater or less than the global mean value. To address multiple comparisons, here we adopted p < 0.05, Bonferroni corrected, as the level of significance (i.e., pcorr < 0.05/90 ≈ 0.00055 for the AAL-90 atlas, and pcorr < 0.05/264 ≈ 0.00019 for the Power-264 parcellation).
Relationship between currently flexible regions and functional hub areas.
We also tested to what extent nodes with high flexibility coincide with previously reported hub nodes of functional brain networks (Liang et al., 2013; Power et al., 2013). Here, hubs were assessed using the metric of functional connectivity strength (FCS; i.e., average of all correlations of one node with all other nodes) in a voxelwise manner following the method used by Liang et al. (2013). A voxel with an FCS value significantly greater than the global mean was defined as a hub. We considered p < 0.05 with familywise error rate correction to statistically significant.
Multiple linear regression analysis.
To further investigate age-related changes of functionally flexible regions (mainly focused on frontal and parietal cortices), we used a multiple linear regression analysis for the regions as follows: ŷ = βX × X + βG × G + e, where ŷ is an [N × 1] vector of estimations of y (the variable of interest, i.e., entropy), X is the design matrix with associated coefficients βX, G is an [N × 4] matrix of nuisance variables (gender, education, total volume of GM and WM, and head motion), and e is an [N × 1] vector of error terms. Here, we choose X and βX with two possibilities, corresponding to linear and quadratic models, respectively (Betzel et al., 2014):
 |
 |
The coefficients βX were used to assess whether or not a model exhibited a statistically significant age effect. Briefly, one-sample t tests were performed on the β associated with the highest order age term (β1 if the model is linear; β2 if the model is quadratic). A model was considered to have a statistically significant age effect if the p value associated with its test was less than a designated critical value [p < 0.05, false-positive discovery rate (FDR) corrected]. For regions with a significant age effect identified in the main analysis, we also validated the results by means of the above three different processing strategies, including thresholding strategy, window length, and brain parcellation. Notably, for the Power-264 parcellation, we examined age effects for spherical ROIs that overlapped with regions identified using the AAL-90 template.
Results
Head motion and brain volume
We detected an averaged root mean square of motion ranging from 0.0003 to 0.2330 (median, 0.0057) for all participants. The total volume of GM and WM ranged from 0.87 L to 1.51 L (median, 1.18 L).
Optimal threshold k identified for the probabilistic model
Across a wide range of k, we found the frontal, parietal, and temporal lobes to show high entropy. In contrast, the visual cortex showed low entropy. Moreover, the contrast of entropy across brainwide regions gradually decreased with the increase of k. Conversely, consistency increased and then slightly decreased along with the increase of k. For the sum of the two metrics (i.e., contrast and consistency), the peak value emerged at k = 3 (Fig. 2). The following results are all based on this threshold. The mean entropy of each brain region across participants at k = 3 is exhibited in descending order (Fig. 3). In addition, a map of mean entropy of each brain region across individuals is also shown on a cortical surface (Fig. 4A).
Figure 3.

The mean entropy of each brain region across participants is showed in descending order. The dashed line indicates global mean value across the brain regions. The red and cyan bars denote regions identified as functionally flexible and specialized (i.e., the mean entropy of a given region across individuals is significantly greater or lower than the global mean value), respectively. The error bars denote SE. L, Left; R, right. The abbreviations of regions of interest are listed in Table 1.
Figure 4.

A, A map of mean entropy of each brain region across participants. The color bar indicates the values of entropy. B, The distribution of the functionally flexible (red) and specialized (cyan) regions, defined as the mean entropy of a region across individuals significantly greater or less than the global mean value across brainwide brain regions. To consider multiple comparisons, we adopted p < 0.05, Bonferroni corrected, as the level of significance (i.e., pcorr < 0.05/90 ≈ 0.00055 for the AAL-90 atlas). Functionally flexible regions are mainly positioned in the LPFC, orbitofrontal cortex, lateral parietal (LP) and lateral temporal (LT) cortices, and SMA. In contrast, functionally specialized regions are located in the visual, auditory, and sensory areas. The thin gray outlines indicate boundaries between parcels of the AAL atlas. S1, Primary sensory cortex; ACC, anterior cingulate gyrus; OFC, orbitofrontal cortex; L, left; R, right.
Functionally flexible and specialized regions across the human life span
We found functionally flexible regions (i.e., entropy significantly greater than global mean, p < 0.05, Bonferroni corrected) mainly in the lateral prefrontal cortex (LPFC) (i.e., superior frontal gyrus and middle frontal gyrus), orbitofrontal cortex, lateral parietal cortex (i.e., superior parietal lobule, inferior parietal lobule, angular gyrus, and supramarginal gyrus), lateral temporal lobes, supplementary motor area (SMA), caudate, amygdala, left precentral gyrus, and right paracentral lobule. In contrast, functionally specialized regions (i.e., entropy significantly less than global mean, p < 0.05, Bonferroni corrected) mainly involved visual, auditory, and sensory areas and the putamen and pallidum (Fig. 4B, Table 2). The probability distributions of the two most flexible and specialized regions (i.e., with the most significantly greater/lower entropy than the global mean) are shown in Figure 5.
Table 2.
Functionally flexible and specialized regions
| Region | p value | t value |
|---|---|---|
| Flexible regions | ||
| ITG.L | 1.8 × 10−37 | 19.4 |
| ORBinf.R | 8.8 × 10−37 | 19. 1 |
| ORBinf.L | 1.7 × 10⁻³² | 16.9 |
| ITG.R | 9.1 × 10⁻²⁹ | 15.1 |
| CAU.R | 5.5 × 10⁻²⁶ | 13.9 |
| CAU.L | 8.0 × 10⁻²⁵ | 13.3 |
| SFGdor.R | 7.8 × 10⁻²⁴ | 12.9 |
| SPG.R | 2.7 × 10⁻²² | 12.2 |
| TPOsup.L | 3.1 × 10⁻²⁰ | 11.3 |
| MTG.L | 5.7 × 10⁻²⁰ | 11.2 |
| TPOmid.R | 3.6 × 10⁻¹⁹ | 10.9 |
| MTG.R | 8.1 × 10⁻¹⁹ | 10.7 |
| IPL.L | 5.3 × 10⁻¹⁸ | 10. 4 |
| SPG.L | 3.8 × 10⁻¹⁷ | 10.0 |
| TPOsup.R | 8.5 × 10⁻¹⁷ | 9.84 |
| ANG.L | 1.4 × 10⁻¹⁵ | 9.3 |
| SMG.R | 1.4 × 10⁻¹⁵ | 9.3 |
| SMG.L | 7.1 × 10⁻¹⁵ | 9.0 |
| ANG.R | 1.1 × 10⁻¹⁴ | 8.9 |
| TPOmid.L | 8.1 × 10⁻¹⁴ | 8.5 |
| ORBmid.L | 1.1 × 10⁻¹³ | 8.5 |
| MFG.L | 2.2 × 10⁻¹³ | 8.3 |
| SFGdor.L | 4.7 × 10⁻¹³ | 8.2 |
| ORBsup.L | 6.8 × 10⁻¹³ | 8.1 |
| ORBmid.R | 1.3 × 10⁻¹² | 8.0 |
| SMA.L | 1.0 × 10⁻¹⁰ | 7.1 |
| ORBsup.R | 2.2 × 10⁻¹⁰ | 7.0 |
| MFG.R | 2.6 × 10−09 | 6.5 |
| IPL.R | 3.7 × 10−09 | 6.4 |
| AMYG.R | 1.1 × 10−08 | 6.2 |
| AMYG.L | 5.8 × 10−07 | 5.3 |
| PreCG.L | 9.3 × 10−07 | 5.2 |
| SMA.R | 8.8 × 10−06 | 4.7 |
| PCL.R | 5.0 × 10−05 | 4.2 |
| Specialized regions | ||
| CAL.R | 2.0 × 10⁻³³ | −17.4 |
| LING.R | 7.0 × 10⁻²⁷ | −14.3 |
| CAL.L | 9.9 × 10⁻²⁷ | −14.2 |
| LING.L | 7.8 × 10⁻²⁵ | −13.4 |
| CUN.R | 7.8 × 10⁻²⁴ | −12.9 |
| CUN.L | 3.3 × 10⁻²³ | −12.6 |
| PUT.L | 7.2 × 10⁻²¹ | −11.6 |
| SOG.R | 1.8 × 10⁻¹⁷ | −10.1 |
| ROL.L | 2.0 × 10⁻¹⁷ | −10.1 |
| PAL.L | 6.9 × 10⁻¹⁷ | −9.9 |
| PUT.R | 1.3 × 10⁻¹⁵ | −9.3 |
| SOG.L | 1.4 × 10⁻¹⁵ | −9.3 |
| HES.L | 6.7 × 10⁻¹³ | −8.1 |
| PAL.R | 2.1 × 10⁻¹² | −7.9 |
| ROL.R | 4.0 × 10⁻¹² | −7.8 |
| STG.L | 4.3 × 10⁻¹⁰ | −6.8 |
| PoCG.R | 2.3 × 10−09 | −6.5 |
| ACG.R | 4.4 × 10−09 | −6.4 |
| ACG.L | 9.5 × 10−09 | −6.2 |
| REC.L | 1.5 × 10−08 | −6.1 |
| REC.R | 4.9 × 10−07 | −5.3 |
| MOG.R | 5.3 × 10−07 | −5.3 |
| HES.R | 8.8 × 10−05 | −4. 1 |
| PoCG.L | 0.0001 | −4.0 |
| FFG.R | 0.0002 | −3.9 |
Functionally flexible or specialized regions were defined by mean entropy of a given region across individuals significantly greater or less than the global mean value across brainwide regions. Here we adopted p < 0.05, Bonferroni corrected, as the level of significance (i.e., the pcorr < 0.05/90 ≈ 0.00055 for the AAL-90 atlas). The full name of each abbreviation was listed in Table 1. L, Left; R, right.
Figure 5.

A, C, Probability distribution of the most flexible (A) and specialized (C) regions (i.e., mean entropy of a given region across individuals is most significantly greater/lower than the global mean value across brainwide regions). The probability for each connection is averaged across all participants. The legends indicate the most frequent connections with left inferior temporal gyrus (ITG) and right calcarine cortex (CAL) across the temporal windows. B, D, The most frequent connections with ITG and CAL on a cortical surface. The ITG exhibits distributed and variable connectivity (high entropy) with other regions over time. In contrast, the CAL shows local and stereotyped connectivity with other regions (low entropy) over time. L, Left; R, right. The abbreviations of regions of interest are listed in Table 1.
Age-related changes of functionally flexible regions in the frontal and parietal cortices
We found that the trajectories of age-related changes in functional flexibility were better fitted with the quadratic model for the right middle frontal gyrus (p = 0.0029, r = 0.30) and left supramarginal gyrus (p = 0.0048, r = 0.27, FDR corrected) compared to the linear model (p > 0.1; Fig. 6).
Figure 6.

Age-related changes of functional flexibility in the left supramarginal gyrus (SMG) and right middle frontal gyrus (MFG). Red lines represent the best-fit line derived from the multiple linear regression models. We adopted a statistical threshold of p < 0.05, FDR corrected. L, Left; R, right.
Relationship between currently flexible regions and FCS hub areas
After overlaying the maps of FCS hubs and our currently flexible regions, we found considerable overlap between dorsolateral PFC, inferior parietal lobules, lateral temporal lobules, and SMA. However, visual and sensory areas, medial PFC, and posterior cingulate cortex were identified as previously reported hubs, but were not characterized as flexible regions by our method. Conversely, the superior parietal lobules were identified as flexible regions, but are not FCS hubs (Fig. 7).
Figure 7.

Overlaid map of currently flexible regions (red) and FCS hubs (orange). The yellow areas represent the overlapped regions. DLPFC, Dorsolateral prefrontal cortex; IPL, inferior parietal lobule; LT, lateral temporal; PCC, posterior cingulate cortex; MPFC, medial prefrontal cortex; S1, primary sensory cortex; L, left; R, right.
Validation results
Effects of thresholding strategy
We observed that most identified flexible and specialized regions (p < 0.05, Bonferroni corrected) corresponded to our main findings (significant correlations of entropy across the whole brain at both group (r = 0.90, p = 2.7 × 10⁻³³) and individual (r = 0.72, p = 0) levels. After regressing out the covariate (number of connections for each node when a global threshold is applied), the bilateral middle orbitofrontal cortex, right paracentral lobule, right inferior parietal lobule, and right middle frontal gyrus did not emerge as flexible regions, instead, the left visual cortex stood out as a flexible region. In addition, we found similar age effects with and without regression of the covariate (Fig. 8).
Figure 8.

Validation results for the effects of thresholding strategy. A, B, Functionally flexible and specialized regions identified in the main analysis (A) and after regressing out the number of connections of each node using a global threshold (B). Arrows indicate regions that were identified as flexible/specialized in only one of the two thresholding strategies. The thin gray outlines indicate boundaries between parcels of the AAL atlas. C, D, Significant correlation of entropy across the whole brain was found at both the group (C) and individual (D) levels. E, Age-related changes of functional flexibility in the left supramarginal gyrus (SMG) and right middle frontal gyrus (MFG), which were similar to the main findings. Red lines represent the best-fit line derived from the multiple linear regression models. OFCmid, Middle orbitofrontal cortex; PCL, paracentral lobule; IPL, inferior parietal lobule; S1, primary sensory cortex; L, left; R, right.
Effects of window length
We found that most identified flexible and specialized regions (p < 0.05, Bonferroni corrected) were consistent with our main results (significant correlations of entropy across the whole brain at both group (r = 0.96, p = 2.5 × 10−51) and individual (r = 0.83, p = 0) levels. However, the left precuneus and bilateral middle cingulate gyri were identified as flexible regions at a window length of 100 s, but not at a window length of 44 s. In contrast, bilateral anterior cingulate gyri were identified as functionally specialized regions at a window length of 44 s, but not at a window length of 100 s. Moreover, we found similar age effects using different window lengths (Fig. 9).
Figure 9.

Validation results for the effects of window length. A, B, Functionally flexible and specialized regions identified using a window length of 44 s in the main analysis (A) and a window length of 100 s (B). Arrows indicate the regions that were identified as flexible/specialized in only one of the two window lengths. The thin gray outlines indicate boundaries between parcels of the AAL atlas. C, D, Significant correlation of entropy across the whole brain was found at both the group (C) and individual (D) levels. E, Age-related changes in functional flexibility in the left supramarginal gyrus (SMG) and right middle frontal gyrus (MFG), which were similar to the main findings, although statistical significance is weak for the left SMG. Red lines represent the best-fit line derived from the multiple linear regression models. PCUN, Precuneus; MCG, middle cingulate gyrus; ACC, anterior cingulate gyrus; M1, primary motor cortex; L, left; R, right.
Effects of brain parcellation
We found regions identified as functionally flexible as well as specialized regions (p < 0.05, Bonferroni corrected; i.e., pcorr < 0.05/90 ≈ 0.00055 for the AAL-90, and pcorr < 0.05/264 ≈ 0.00019 for the Power-264) to be well matched between the two brain parcellations, despite some inconsistency in the right SMA, paracentral lobule, and lateral parietal cortex. However, we did not consistently observe an effect of age (p > 0.1 for both linear and quadratic fitting models) for the spherical ROIs in the right middle frontal gyrus, and instead identified a similar trend (p = 0.043, r = 0.22) of age-related changes for one spherical ROI in the left supramarginal gyrus (Fig. 10).
Figure 10.

Validation results for the effects of brain parcellation. A, The overlay of functionally flexible and specialized regions identified using the AAL-90 and Power-264 parcellations. The results are well matched, despite some differences in the right SMA, paracentral lobule (PCL), and lateral parietal cortex (LP; black circles). The thin gray outlines indicate boundaries between parcels of AAL atlas. B, Age-related changes in functional flexibility in spherical ROIs that overlap with the left supramarginal gyrus (SMG) and right middle frontal gyrus (MFG). Yellow lines represent the best-fit line derived from the multiple linear regression models. The results are modulated by the spatial scales, especially for the spherical ROIs in the right MFG. L, left; R, right.
Discussion
Although the literature on connectivity dynamics in the resting state is growing (Chang and Glover, 2010; Kiviniemi et al., 2011; Hutchison et al., 2013a; Allen et al., 2014; Zalesky et al., 2014; Liao et al., 2015), few studies provide computational insight into potential cognitive architecture. This study proposes a new probabilistic modeling framework to quantify the inherent functional flexibility of individual brain regions, bridging the gap with task-related roles of functional flexibility while also revealing age-related changes in functionally flexible regions across the human life span.
Functionally flexible and specialized regions across the human life span
We found that regions with high functional flexibility (high entropy) were mainly positioned in higher-order association areas, such as the LPFC and lateral parietal and lateral temporal cortices, throughout the life span. In contrast, regions with high functional specialization (low entropy) were mainly found in unimodal areas, such as visual, auditory, and sensory areas. Frontal and parietal regions are considered “domain general” and coactivate during a wide variety of cognitive tasks, supporting cognitive flexibility (Dosenbach et al., 2007; Crossley et al., 2013; Fedorenko et al., 2013), whereas “domain-specific” regions including the visual, auditory, and sensory cortices perform specialized functions (Macaluso and Driver, 2005; Fedorenko et al., 2013; Fedorenko and Thompson-Schill, 2014). Flexible hub theory further suggests that the functional connectivity pattern of the frontoparietal network shifts more than that of other networks across a variety of task states (Cole et al., 2011, 2013a,b). Moreover, functional flexibility of frontoparietal and frontotemporal networks has been revealed during working memory tasks and learning (Bassett et al., 2011; Braun et al., 2015). These functionally flexible regions are heterogeneous and support the binding and integration of specialized brain systems that contribute to the ability to execute multiple and varied tasks (Yeo et al., 2015). Our findings further demonstrate that high flexibility of human association cortex exists even in the absence of overt tasks. The rapid reconfiguration of functional connectivity pattern according to different task demands may be attributable to the flexible self-assembly of intrinsic functional connectivity. This substantiates the influential perspective that resting brain activity is responsible for maintaining preparedness for future events (Miall and Robertson, 2006; Raichle and Snyder, 2007; Engel et al., 2013).
Moreover, we found high flexibility of the caudate. In contrast, the putamen and pallidum exhibited low flexibility. Emerging evidence (Grahn et al., 2008) suggests that the caudate contributes to goal-directed action (e.g., supporting the planning and execution of strategies), while the putamen appears to subserve cognitive functions more limited to stimulus response or habit. Our finding not only provides new evidence for functional delineation within the basal ganglia, but also demonstrates the specificity of our model.
Although there is considerable overlap in the inferior parietal lobules, lateral temporal lobules, and dorsolateral PFC between the FCS hubs/default network and our identified flexible regions, there is some divergence. Specifically, the medial PFC, posterior cingulate cortex, and visual and sensory areas identified as previously reported hubs (Buckner et al., 2009; Liang et al., 2013) did not emerge as flexible regions. Hubs are nodes of special importance in a network. Power et al. (2013) argue that hubs identified using degree- or strength-based approaches may reflect community size or belonging to large functional systems rather than important roles in information processing. They devised a combined approach to identify hub-like regions that support or integrate multiple functional systems, resulting in findings that considerably diverge from previously reported degree/strength-based hubs in many regions, including the posterior cingulate gyrus, medial PFC, and visual and sensory areas. In contrast, the flexible regions proposed here are based on characterization of heterogeneous functional connectivity patterns of each region over time. It is therefore crucial to bear in mind the likely physiological basis of a hub based on each unique identification approach, as different approaches result in different hub-like regions.
Age-related changes of frontal and parietal cortices in inherent functional flexibility
We observed that flexibility of the right middle frontal gyrus increased during maturity and reduced with normal aging, with the opposite occurring for the left supramarginal gyrus. The prefrontal cortex, particularly the LPFC, is a late developing region of the neocortex involved in the top-down control of thoughts and action (Bunge et al., 2002; Casey et al., 2005). The primary executive function of the LPFC is the temporal integration of goal-directed actions in the domains of behavior, cognition, and language (Miller and Cohen, 2001; Fuster, 2002; Tanji and Hoshi, 2008). Moreover, cognitive maturation is concurrent with the expansion of heterogeneous function of the prefrontal cortex, which continues into adulthood (Luna et al., 2001). Specifically, fMRI evidence indicates that LPFC function contributing to performance on the Stroop interference task continues to develop into adulthood. In contrast, functional development of the parietal lobe occurs by adolescence (Adleman et al., 2002). Additionally, lateral parietal regions (i.e., supramarginal and angular gyri) show decreased activity in adults relative to children while performing high-frequency reading and aural repetition tasks, suggesting that reading development involves intraregional specialization with maturity (Church et al., 2008). We therefore presume that two types of functional reorganization occur with maturity: increased functional flexibility or integration in the prefrontal cortex and increased functional specialization or segregation in lateral parietal regions.
On the other hand, there is a decline in many domains of cognition (e.g., verbal memory and numeric ability) in humans after the age of 55 (Hedden and Gabrieli, 2004). Moreover, cognitive functions of the adult prefrontal cortex reflect the culmination of biological processes that lead to peak lifetime intellectual performance (Fuster, 2002). Accordingly, we found that age-related changes in functional flexibility in the right middle frontal gyrus conform to the quadratic model, peaking at adulthood and subsequently declining. Our method provides novel neural evidence for aging-related changes demonstrated using cognitive and neuropsychological indices.
Anatomically, late maturation of the prefrontal cortex is prominently reflected in the late myelination of its axonal connections (Fuster, 2002). Moreover, the greatest age-related decline in white matter integrity occurs in the prefrontal cortex and anterior corpus callosum throughout the normal aging process, as demonstrated by diffusion tensor imaging (Head et al., 2004; Hedden and Gabrieli, 2004). We speculate that such structural alterations may underlie age-related changes of functional flexibility in LPFC.
The results of our validation procedure indicate that the observed age-related changes were robust to thresholding strategy and window length. However, the trend of age effect was modulated by different spatial scales (i.e., AAL-90 vs Power-264), although the identification of functionally flexible and specialized regions was robust. Previous brain network studies have demonstrated that organization principles are robust across spatial scales, but quantitative measures of graph metrics, especially for individual regions, vary substantially (Wang et al., 2009; Hayasaka and Laurienti, 2010; de Reus and van den Heuvel, 2013). Furthermore, whether uniformly sized brain regions offer a genuine advantage over anatomical templates is open for debate and may depend on the research question. This is due to difficulties in discerning whether reported differences reflect true characteristics of the human brain across spatial scales or arise due to methodological issues (de Reus and van den Heuvel, 2013). Therefore, caution should be exercised when interpreting differences in quantitative measures across spatial scales.
Limitations of this study
The present study is based on analyses of dynamic functional connectivity and is affected by the general limitations of this technique (Hutchison et al., 2013b; Hindriks et al., 2016). Specifically, the temporal resolution of fMRI is relatively low (TR, 2 s; Hutchison et al., 2013a; Allen et al., 2014; Hutchison and Morton, 2015). Although recent advances in fMRI with multiband acquisition (Liao et al., 2015) can dramatically improve the sampling rate (e.g., TR from 2 s down to 0.4 s), these acquisitions are still limited by the hemodynamic response. Therefore, it is important to combine fMRI with other techniques (e.g., magnetoencephalography; de Pasquale et al., 2015) with higher temporal resolution to obtain maximally accurate dynamic reconfiguration of intrinsic functional networks.
Two limitations related to the research design are particularly noteworthy. First, a participant sample that includes a group of preadolescent children is warranted to detail the development of functionally flexible regions. Second, although our findings revealed inherent functional flexibility of brain organization across the human life span, the modulation of dynamic reorganization of intrinsic functional networks by cognitive or behavioral learning, for example, should be considered in future research.
Conclusions
This study proposes a new probabilistic framework to quantify the flexibility of each brain region based on the dynamics of intrinsic functional connectivity. Our model successfully demonstrates the inherent flexibility of the higher-order association cortex, such as the frontoparietal system, throughout the human life span. In contrast, unimodal visual and sensory regions are functionally rigid. Moreover, we uncovered dissociable changes of the LPFC and lateral parietal cortex in functional flexibility and specialization over the life span. In addition, our proposed framework has the potential to provide insight into how the dynamic reconfiguration of intrinsic functional networks is disrupted in a wide spectrum of individuals with neurological or psychiatric difficulties.
Footnotes
This work was funded by the Hundred Talents Program of the Chinese Academy of Sciences (Zheng Wang), Strategic Priority Research Program (B) of the Chinese Academy of Sciences Grant XDB02050006 (Zheng Wang), the National Technology Support Program during the 11th Five-Year Plan (Grant 2009BAI77B05 to W.C.), Shanghai Education Committee Grant HJTY2012-A06 (W.C.), National Natural Science Foundation Grants 81471651 (M.F.) and 81571300 (Zheng Wang), and Shanghai Institute for Biological Sciences, Chinese Academy of Sciences Grant 2014KIP206 (D.Y.). We thank two anonymous reviewers for their insightful comments and suggestions.
The authors declare no competing financial interests.
References
- Adleman NE, Menon V, Blasey CM, White CD, Warsofsky IS, Glover GH, Reiss AL. A developmental fMRI study of the Stroop color-word task. Neuroimage. 2002;16:61–75. doi: 10.1006/nimg.2001.1046. [DOI] [PubMed] [Google Scholar]
- Alexander-Bloch AF, Gogtay N, Meunier D, Birn R, Clasen L, Lalonde F, Lenroot R, Giedd J, Bullmore ET. Disrupted modularity and local connectivity of brain functional networks in childhood-onset schizophrenia. Front Syst Neurosci. 2010;4:147. doi: 10.3389/fnsys.2010.00147. [DOI] [PMC free article] [PubMed] [Google Scholar]
- Allen EA, Damaraju E, Plis SM, Erhardt EB, Eichele T, Calhoun VD. Tracking whole-brain connectivity dynamics in the resting state. Cereb Cortex. 2014;24:663–676. doi: 10.1093/cercor/bhs352. [DOI] [PMC free article] [PubMed] [Google Scholar]
- Ashburner J, Friston KJ. Voxel-based morphometry–the methods. Neuroimage. 2000;11:805–821. doi: 10.1006/nimg.2000.0582. [DOI] [PubMed] [Google Scholar]
- Ashburner J, Friston KJ. Unified segmentation. Neuroimage. 2005;26:839–851. doi: 10.1016/j.neuroimage.2005.02.018. [DOI] [PubMed] [Google Scholar]
- Barttfeld P, Uhrig L, Sitt JD, Sigman M, Jarraya B, Dehaene S. Signature of consciousness in the dynamics of resting-state brain activity. Proc Natl Acad Sci U S A. 2015;112:887–892. doi: 10.1073/pnas.1418031112. [DOI] [PMC free article] [PubMed] [Google Scholar]
- Bassett DS, Wymbs NF, Porter MA, Mucha PJ, Carlson JM, Grafton ST. Dynamic reconfiguration of human brain networks during learning. Proc Natl Acad Sci U S A. 2011;108:7641–7646. doi: 10.1073/pnas.1018985108. [DOI] [PMC free article] [PubMed] [Google Scholar]
- Betzel RF, Byrge L, He Y, Goñi J, Zuo XN, Sporns O. Changes in structural and functional connectivity among resting-state networks across the human lifespan. Neuroimage. 2014;102:345–357. doi: 10.1016/j.neuroimage.2014.07.067. [DOI] [PubMed] [Google Scholar]
- Biswal B, Yetkin FZ, Haughton VM, Hyde JS. Functional connectivity in the motor cortex of resting human brain using echo-planar MRI. Magn Reson Med. 1995;34:537–541. doi: 10.1002/mrm.1910340409. [DOI] [PubMed] [Google Scholar]
- Braun U, Schäfer A, Walter H, Erk S, Romanczuk-Seiferth N, Haddad L, Schweiger JI, Grimm O, Heinz A, Tost H, Meyer-Lindenberg A, Bassett DS. Dynamic reconfiguration of frontal brain networks during executive cognition in humans. Proc Natl Acad Sci U S A. 2015;112:11678–11683. doi: 10.1073/pnas.1422487112. [DOI] [PMC free article] [PubMed] [Google Scholar]
- Buckner RL, Sepulcre J, Talukdar T, Krienen FM, Liu H, Hedden T, Andrews-Hanna JR, Sperling RA, Johnson KA. Cortical hubs revealed by intrinsic functional connectivity: mapping, assessment of stability, and relation to Alzheimer's disease. J Neurosci. 2009;29:1860–1873. doi: 10.1523/JNEUROSCI.5062-08.2009. [DOI] [PMC free article] [PubMed] [Google Scholar]
- Bunge SA, Dudukovic NM, Thomason ME, Vaidya CJ, Gabrieli JD. Immature frontal lobe contributions to cognitive control in children: evidence from fMRI. Neuron. 2002;33:301–311. doi: 10.1016/S0896-6273(01)00583-9. [DOI] [PMC free article] [PubMed] [Google Scholar]
- Calhoun VD, Miller R, Pearlson G, Adalı T. The chronnectome: time-varying connectivity networks as the next frontier in fMRI data discovery. Neuron. 2014;84:262–274. doi: 10.1016/j.neuron.2014.10.015. [DOI] [PMC free article] [PubMed] [Google Scholar]
- Casey BJ, Tottenham N, Liston C, Durston S. Imaging the developing brain: what have we learned about cognitive development? Trends Cogn Sci. 2005;9:104–110. doi: 10.1016/j.tics.2005.01.011. [DOI] [PubMed] [Google Scholar]
- Chang C, Glover GH. Time-frequency dynamics of resting-state brain connectivity measured with fMRI. Neuroimage. 2010;50:81–98. doi: 10.1016/j.neuroimage.2009.12.011. [DOI] [PMC free article] [PubMed] [Google Scholar]
- Church JA, Coalson RS, Lugar HM, Petersen SE, Schlaggar BL. A developmental fMRI study of reading and repetition reveals changes in phonological and visual mechanisms over age. Cereb Cortex. 2008;18:2054–2065. doi: 10.1093/cercor/bhm228. [DOI] [PMC free article] [PubMed] [Google Scholar]
- Cole MW, Etzel JA, Zacks JM, Schneider W, Braver TS. Rapid transfer of abstract rules to novel contexts in human lateral prefrontal cortex. Front Hum Neurosci. 2011;5:142. doi: 10.3389/fnhum.2011.00142. [DOI] [PMC free article] [PubMed] [Google Scholar]
- Cole MW, Yarkoni T, Repovs G, Anticevic A, Braver TS. Global connectivity of prefrontal cortex predicts cognitive control and intelligence. J Neurosci. 2012;32:8988–8999. doi: 10.1523/JNEUROSCI.0536-12.2012. [DOI] [PMC free article] [PubMed] [Google Scholar]
- Cole MW, Laurent P, Stocco A. Rapid instructed task learning: a new window into the human brain's unique capacity for flexible cognitive control. Cogn Affect Behav Neurosci. 2013a;13:1–22. doi: 10.3758/s13415-012-0125-7. [DOI] [PMC free article] [PubMed] [Google Scholar]
- Cole MW, Reynolds JR, Power JD, Repovs G, Anticevic A, Braver TS. Multi-task connectivity reveals flexible hubs for adaptive task control. Nat Neurosci. 2013b;16:1348–1355. doi: 10.1038/nn.3470. [DOI] [PMC free article] [PubMed] [Google Scholar]
- Crossley NA, Mechelli A, Vértes PE, Winton-Brown TT, Patel AX, Ginestet CE, McGuire P, Bullmore ET. Cognitive relevance of the community structure of the human brain functional coactivation network. Proc Natl Acad Sci U S A. 2013;110:11583–11588. doi: 10.1073/pnas.1220826110. [DOI] [PMC free article] [PubMed] [Google Scholar]
- Deco G, Jirsa VK, McIntosh AR. Emerging concepts for the dynamical organization of resting-state activity in the brain. Nat Rev Neurosci. 2011;12:43–56. doi: 10.1038/nrn2961. [DOI] [PubMed] [Google Scholar]
- Deco G, Jirsa VK, McIntosh AR. Resting brains never rest: computational insights into potential cognitive architectures. Trends Neurosci. 2013;36:268–274. doi: 10.1016/j.tins.2013.03.001. [DOI] [PubMed] [Google Scholar]
- de Pasquale F, Della Penna S, Sporns O, Romani GL, Corbetta M. A dynamic core network and global efficiency in the resting human brain. Cereb Cortex. 2015 doi: 10.1093/cercor/bhv185. Advance online publication. Retrieved September 6, 2015. [DOI] [PMC free article] [PubMed] [Google Scholar]
- de Reus MA, van den Heuvel MP. The parcellation-based connectome: limitations and extensions. Neuroimage. 2013;80:397–404. doi: 10.1016/j.neuroimage.2013.03.053. [DOI] [PubMed] [Google Scholar]
- Dosenbach NU, Fair DA, Miezin FM, Cohen AL, Wenger KK, Dosenbach RA, Fox MD, Snyder AZ, Vincent JL, Raichle ME, Schlaggar BL, Petersen SE. Distinct brain networks for adaptive and stable task control in humans. Proc Natl Acad Sci U S A. 2007;104:11073–11078. doi: 10.1073/pnas.0704320104. [DOI] [PMC free article] [PubMed] [Google Scholar]
- Engel AK, Gerloff C, Hilgetag CC, Nolte G. Intrinsic coupling modes: multiscale interactions in ongoing brain activity. Neuron. 2013;80:867–886. doi: 10.1016/j.neuron.2013.09.038. [DOI] [PubMed] [Google Scholar]
- Fair DA, Dosenbach NU, Church JA, Cohen AL, Brahmbhatt S, Miezin FM, Barch DM, Raichle ME, Petersen SE, Schlaggar BL. Development of distinct control networks through segregation and integration. Proc Natl Acad Sci U S A. 2007;104:13507–13512. doi: 10.1073/pnas.0705843104. [DOI] [PMC free article] [PubMed] [Google Scholar]
- Fedorenko E, Thompson-Schill SL. Reworking the language network. Trends Cogn Sci. 2014;18:120–126. doi: 10.1016/j.tics.2013.12.006. [DOI] [PMC free article] [PubMed] [Google Scholar]
- Fedorenko E, Duncan J, Kanwisher N. Broad domain generality in focal regions of frontal and parietal cortex. Proc Natl Acad Sci U S A. 2013;110:16616–16621. doi: 10.1073/pnas.1315235110. [DOI] [PMC free article] [PubMed] [Google Scholar]
- Fox MD, Raichle ME. Spontaneous fluctuations in brain activity observed with functional magnetic resonance imaging. Nat Rev Neurosci. 2007;8:700–711. doi: 10.1038/nrn2201. [DOI] [PubMed] [Google Scholar]
- Friston KJ. Functional and effective connectivity: a review. Brain Connect. 2011;1:13–36. doi: 10.1089/brain.2011.0008. [DOI] [PubMed] [Google Scholar]
- Fuster JM. Frontal lobe and cognitive development. J Neurocytol. 2002;31:373–385. doi: 10.1023/A:1024190429920. [DOI] [PubMed] [Google Scholar]
- Gogtay N, Giedd JN, Lusk L, Hayashi KM, Greenstein D, Vaituzis AC, Nugent TF, 3rd, Herman DH, Clasen LS, Toga AW, Rapoport JL, Thompson PM. Dynamic mapping of human cortical development during childhood through early adulthood. Proc Natl Acad Sci U S A. 2004;101:8174–8179. doi: 10.1073/pnas.0402680101. [DOI] [PMC free article] [PubMed] [Google Scholar]
- Grahn JA, Parkinson JA, Owen AM. The cognitive functions of the caudate nucleus. Prog Neurobiol. 2008;86:141–155. doi: 10.1016/j.pneurobio.2008.09.004. [DOI] [PubMed] [Google Scholar]
- Hansen EC, Battaglia D, Spiegler A, Deco G, Jirsa VK. Functional connectivity dynamics: modeling the switching behavior of the resting state. Neuroimage. 2015;105:525–535. doi: 10.1016/j.neuroimage.2014.11.001. [DOI] [PubMed] [Google Scholar]
- Hayasaka S, Laurienti PJ. Comparison of characteristics between region-and voxel-based network analyses in resting-state fMRI data. Neuroimage. 2010;50:499–508. doi: 10.1016/j.neuroimage.2009.12.051. [DOI] [PMC free article] [PubMed] [Google Scholar]
- Head D, Buckner RL, Shimony JS, Williams LE, Akbudak E, Conturo TE, McAvoy M, Morris JC, Snyder AZ. Differential vulnerability of anterior white matter in nondemented aging with minimal acceleration in dementia of the Alzheimer type: evidence from diffusion tensor imaging. Cereb Cortex. 2004;14:410–423. doi: 10.1093/cercor/bhh003. [DOI] [PubMed] [Google Scholar]
- Hedden T, Gabrieli JD. Insights into the ageing mind: a view from cognitive neuroscience. Nat Rev Neurosci. 2004;5:87–96. doi: 10.1038/nrn1323. [DOI] [PubMed] [Google Scholar]
- Heinzle J, Wenzel MA, Haynes JD. Visuomotor functional network topology predicts upcoming tasks. J Neurosci. 2012;32:9960–9968. doi: 10.1523/JNEUROSCI.1604-12.2012. [DOI] [PMC free article] [PubMed] [Google Scholar]
- Hindriks R, Adhikari MH, Murayama Y, Ganzetti M, Mantini D, Logothetis NK, Deco G. Can sliding-window correlations reveal dynamic functional connectivity in resting-state fMRI? Neuroimage. 2016;127:242–256. doi: 10.1016/j.neuroimage.2015.11.055. [DOI] [PMC free article] [PubMed] [Google Scholar]
- Hutchison RM, Morton JB. Tracking the brain's functional coupling dynamics over development. J Neurosci. 2015;35:6849–6859. doi: 10.1523/JNEUROSCI.4638-14.2015. [DOI] [PMC free article] [PubMed] [Google Scholar]
- Hutchison RM, Womelsdorf T, Gati JS, Everling S, Menon RS. Resting-state networks show dynamic functional connectivity in awake humans and anesthetized macaques. Hum Brain Mapp. 2013a;34:2154–2177. doi: 10.1002/hbm.22058. [DOI] [PMC free article] [PubMed] [Google Scholar]
- Hutchison RM, Womelsdorf T, Allen EA, Bandettini PA, Calhoun VD, Corbetta M, Della Penna S, Duyn JH, Glover GH, Gonzalez-Castillo J, Handwerker DA, Keilholz S, Kiviniemi V, Leopold DA, de Pasquale F, Sporns O, Walter M, Chang C. Dynamic functional connectivity: promise, issues, and interpretations. Neuroimage. 2013b;80:360–378. doi: 10.1016/j.neuroimage.2013.05.079. [DOI] [PMC free article] [PubMed] [Google Scholar]
- Jones DT, Vemuri P, Murphy MC, Gunter JL, Senjem ML, Machulda MM, Przybelski SA, Gregg BE, Kantarci K, Knopman DS, Boeve BF, Petersen RC, Jack CR., Jr Non-stationarity in the “resting brain's” modular architecture. PLoS One. 2012;7:e39731. doi: 10.1371/journal.pone.0039731. [DOI] [PMC free article] [PubMed] [Google Scholar]
- Kaiser M. A tutorial in connectome analysis: topological and spatial features of brain networks. Neuroimage. 2011;57:892–907. doi: 10.1016/j.neuroimage.2011.05.025. [DOI] [PubMed] [Google Scholar]
- Karahanoğlu FI, Van De Ville D. Transient brain activity disentangles fMRI resting-state dynamics in terms of spatially and temporally overlapping networks. Nat Commun. 2015;6:7751. doi: 10.1038/ncomms8751. [DOI] [PMC free article] [PubMed] [Google Scholar]
- Kiviniemi V, Vire T, Remes J, Elseoud AA, Starck T, Tervonen O, Nikkinen J. A sliding time-window ICA reveals spatial variability of the default mode network in time. Brain Connect. 2011;1:339–347. doi: 10.1089/brain.2011.0036. [DOI] [PubMed] [Google Scholar]
- Kopell NJ, Gritton HJ, Whittington MA, Kramer MA. Beyond the connectome: the dynome. Neuron. 2014;83:1319–1328. doi: 10.1016/j.neuron.2014.08.016. [DOI] [PMC free article] [PubMed] [Google Scholar]
- Laird AR, Fox PM, Eickhoff SB, Turner JA, Ray KL, McKay DR, Glahn DC, Beckmann CF, Smith SM, Fox PT. Behavioral interpretations of intrinsic connectivity networks. J Cogn Neurosci. 2011;23:4022–4037. doi: 10.1162/jocn_a_00077. [DOI] [PMC free article] [PubMed] [Google Scholar]
- Leonardi N, Van De Ville D. On spurious and real fluctuations of dynamic functional connectivity during rest. Neuroimage. 2015;104:430–436. doi: 10.1016/j.neuroimage.2014.09.007. [DOI] [PubMed] [Google Scholar]
- Li HJ, Hou XH, Liu HH, Yue CL, Lu GM, Zuo XN. Putting age-related task activation into large-scale brain networks: A meta-analysis of 114 fMRI studies on healthy aging. Neurosci Biobehav Rev. 2015;57:156–174. doi: 10.1016/j.neubiorev.2015.08.013. [DOI] [PubMed] [Google Scholar]
- Liang X, Zou Q, He Y, Yang Y. Coupling of functional connectivity and regional cerebral blood flow reveals a physiological basis for network hubs of the human brain. Proc Natl Acad Sci U S A. 2013;110:1929–1934. doi: 10.1073/pnas.1214900110. [DOI] [PMC free article] [PubMed] [Google Scholar]
- Liao X, Yuan L, Zhao T, Dai Z, Shu N, Xia M, Yang Y, Evans A, He Y. Spontaneous functional network dynamics and associated structural substrates in the human brain. Front Hum Neurosci. 2015;9:478. doi: 10.3389/fnhum.2015.00478. [DOI] [PMC free article] [PubMed] [Google Scholar]
- Lindquist MA, Xu Y, Nebel MB, Caffo BS. Evaluating dynamic bivariate correlations in resting-state fMRI: a comparison study and a new approach. Neuroimage. 2014;101:531–546. doi: 10.1016/j.neuroimage.2014.06.052. [DOI] [PMC free article] [PubMed] [Google Scholar]
- Liu WJ, Yin DZ, Cheng WH, Fan MX, You MN, Men WW, Zang LL, Shi DH, Zhang F. Abnormal functional connectivity of the amygdala-based network in resting-state FMRI in adolescents with generalized anxiety disorder. Med Sci Monit. 2015;21:459–467. doi: 10.12659/MSM.893373. [DOI] [PMC free article] [PubMed] [Google Scholar]
- Liu X, Duyn JH. Time-varying functional network information extracted from brief instances of spontaneous brain activity. Proc Natl Acad Sci U S A. 2013;110:4392–4397. doi: 10.1073/pnas.1216856110. [DOI] [PMC free article] [PubMed] [Google Scholar]
- Liu Y, Liang M, Zhou Y, He Y, Hao Y, Song M, Yu C, Liu H, Liu Z, Jiang T. Disrupted small-world networks in schizophrenia. Brain. 2008;131:945–961. doi: 10.1093/brain/awn018. [DOI] [PubMed] [Google Scholar]
- Luna B, Thulborn KR, Munoz DP, Merriam EP, Garver KE, Minshew NJ, Keshavan MS, Genovese CR, Eddy WF, Sweeney JA. Maturation of widely distributed brain function subserves cognitive development. Neuroimage. 2001;13:786–793. doi: 10.1006/nimg.2000.0743. [DOI] [PubMed] [Google Scholar]
- Macaluso E, Driver J. Multisensory spatial interactions: a window onto functional integration in the human brain. Trends Neurosci. 2005;28:264–271. doi: 10.1016/j.tins.2005.03.008. [DOI] [PubMed] [Google Scholar]
- Miall RC, Robertson EM. Functional imaging: is the resting brain resting? Curr Biol. 2006;16:R998–R1000. doi: 10.1016/j.cub.2006.10.041. [DOI] [PMC free article] [PubMed] [Google Scholar]
- Miller EK, Cohen JD. An integrative theory of prefrontal cortex function. Annu Rev Neurosci. 2001;24:167–202. doi: 10.1146/annurev.neuro.24.1.167. [DOI] [PubMed] [Google Scholar]
- Oldfield RC. The assessment and analysis of handedness: the Edinburgh inventory. Neuropsychologia. 1971;9:97–113. doi: 10.1016/0028-3932(71)90067-4. [DOI] [PubMed] [Google Scholar]
- Park HJ, Friston K. Structural and functional brain networks: from connections to cognition. Science. 2013;342:1238411. doi: 10.1126/science.1238411. [DOI] [PubMed] [Google Scholar]
- Power JD, Cohen AL, Nelson SM, Wig GS, Barnes KA, Church JA, Vogel AC, Laumann TO, Miezin FM, Schlaggar BL, Petersen SE. Functional network organization of the human brain. Neuron. 2011;72:665–678. doi: 10.1016/j.neuron.2011.09.006. [DOI] [PMC free article] [PubMed] [Google Scholar]
- Power JD, Barnes KA, Snyder AZ, Schlaggar BL, Petersen SE. Spurious but systematic correlations in functional connectivity MRI networks arise from subject motion. Neuroimage. 2012;59:2142–2154. doi: 10.1016/j.neuroimage.2011.10.018. [DOI] [PMC free article] [PubMed] [Google Scholar]
- Power JD, Schlaggar BL, Lessov-Schlaggar CN, Petersen SE. Evidence for hubs in human functional brain networks. Neuron. 2013;79:798–813. doi: 10.1016/j.neuron.2013.07.035. [DOI] [PMC free article] [PubMed] [Google Scholar]
- Power JD, Schlaggar BL, Petersen SE. Studying brain organization via spontaneous fMRI signal. Neuron. 2014;84:681–696. doi: 10.1016/j.neuron.2014.09.007. [DOI] [PMC free article] [PubMed] [Google Scholar]
- Raichle ME, Snyder AZ. A default mode of brain function: a brief history of an evolving idea. Neuroimage. 2007;37:1083–1090. doi: 10.1016/j.neuroimage.2007.02.041. discussion 1097–1089. [DOI] [PubMed] [Google Scholar]
- Rubinov M, Sporns O. Complex network measures of brain connectivity: uses and interpretations. Neuroimage. 2010;52:1059–1069. doi: 10.1016/j.neuroimage.2009.10.003. [DOI] [PubMed] [Google Scholar]
- Saad ZS, Gotts SJ, Murphy K, Chen G, Jo HJ, Martin A, Cox RW. Trouble at rest: how correlation patterns and group differences become distorted after global signal regression. Brain Connect. 2012;2:25–32. doi: 10.1089/brain.2012.0080. [DOI] [PMC free article] [PubMed] [Google Scholar]
- Sakoğlu U, Pearlson GD, Kiehl KA, Wang YM, Michael AM, Calhoun VD. A method for evaluating dynamic functional network connectivity and task-modulation: application to schizophrenia. MAGMA. 2010;23:351–366. doi: 10.1007/s10334-010-0197-8. [DOI] [PMC free article] [PubMed] [Google Scholar]
- Shen K, Hutchison RM, Bezgin G, Everling S, McIntosh AR. Network structure shapes spontaneous functional connectivity dynamics. J Neurosci. 2015;35:5579–5588. doi: 10.1523/JNEUROSCI.4903-14.2015. [DOI] [PMC free article] [PubMed] [Google Scholar]
- Spielberg JM, Miller GA, Heller W, Banich MT. Flexible brain network reconfiguration supporting inhibitory control. Proc Natl Acad Sci U S A. 2015;112:10020–10025. doi: 10.1073/pnas.1500048112. [DOI] [PMC free article] [PubMed] [Google Scholar]
- Tanji J, Hoshi E. Role of the lateral prefrontal cortex in executive behavioral control. Physiol Rev. 2008;88:37–57. doi: 10.1152/physrev.00014.2007. [DOI] [PubMed] [Google Scholar]
- Tononi G, Sporns O, Edelman GM. A measure for brain complexity: relating functional segregation and integration in the nervous system. Proc Natl Acad Sci U S A. 1994;91:5033–5037. doi: 10.1073/pnas.91.11.5033. [DOI] [PMC free article] [PubMed] [Google Scholar]
- Turner GR, Spreng RN. Executive functions and neurocognitive aging: dissociable patterns of brain activity. Neurobiol Aging. 2012;33:826.e1–813. doi: 10.1016/j.neurobiolaging.2011.06.005. [DOI] [PubMed] [Google Scholar]
- Tzourio-Mazoyer N, Landeau B, Papathanassiou D, Crivello F, Etard O, Delcroix N, Mazoyer B, Joliot M. Automated anatomical labeling of activations in SPM using a macroscopic anatomical parcellation of the MNI MRI single-subject brain. Neuroimage. 2002;15:273–289. doi: 10.1006/nimg.2001.0978. [DOI] [PubMed] [Google Scholar]
- Van Dijk KR, Sabuncu MR, Buckner RL. The influence of head motion on intrinsic functional connectivity MRI. Neuroimage. 2012;59:431–438. doi: 10.1016/j.neuroimage.2011.07.044. [DOI] [PMC free article] [PubMed] [Google Scholar]
- Wang J, Wang L, Zang Y, Yang H, Tang H, Gong Q, Chen Z, Zhu C, He Y. Parcellation-dependent small-world brain functional networks: a resting-state fMRI study. Hum Brain Mapp. 2009;30:1511–1523. doi: 10.1002/hbm.20623. [DOI] [PMC free article] [PubMed] [Google Scholar]
- Yan CG, Zang YF. DPARSF: a MATLAB toolbox for “pipeline” data analysis of resting-state fMRI. Front Syst Neurosci. 2010;4:13. doi: 10.3389/fnsys.2010.00013. [DOI] [PMC free article] [PubMed] [Google Scholar]
- Yan CG, Cheung B, Kelly C, Colcombe S, Craddock RC, Di Martino A, Li Q, Zuo XN, Castellanos FX, Milham MP. A comprehensive assessment of regional variation in the impact of head micromovements on functional connectomics. Neuroimage. 2013;76:183–201. doi: 10.1016/j.neuroimage.2013.03.004. [DOI] [PMC free article] [PubMed] [Google Scholar]
- Yeo BT, Krienen FM, Eickhoff SB, Yaakub SN, Fox PT, Buckner RL, Asplund CL, Chee MW. Functional specialization and flexibility in human association cortex. Cereb Cortex. 2015;25:3654–3672. doi: 10.1093/cercor/bhu217. [DOI] [PMC free article] [PubMed] [Google Scholar]
- Yin D, Song F, Xu D, Sun L, Men W, Zang L, Yan X, Fan M. Altered topological properties of the cortical motor-related network in patients with subcortical stroke revealed by graph theoretical analysis. Hum Brain Mapp. 2014;35:3343–3359. doi: 10.1002/hbm.22406. [DOI] [PMC free article] [PubMed] [Google Scholar]
- Zalesky A, Fornito A, Cocchi L, Gollo LL, Breakspear M. Time-resolved resting-state brain networks. Proc Natl Acad Sci U S A. 2014;111:10341–10346. doi: 10.1073/pnas.1400181111. [DOI] [PMC free article] [PubMed] [Google Scholar]
- Zamora-López G, Russo E, Gleiser PM, Zhou C, Kurths J. Characterizing the complexity of brain and mind networks. Philos Trans A Math Phys Eng Sci. 2011;369:3730–3747. doi: 10.1098/rsta.2011.0121. [DOI] [PubMed] [Google Scholar]
- Zhang D, Raichle ME. Disease and the brain's dark energy. Nat Rev Neurol. 2010;6:15–28. doi: 10.1038/nrneurol.2009.198. [DOI] [PubMed] [Google Scholar]