Abstract
Objective
To evaluate the combined effect of lesion activity and pathologic processes occurring in both chronically demyelinated lesions and normal-appearing white matter (NAWM) on brain atrophy in MS.
Methods
Pre- and post-gadolinium T1, fluid attenuation inversion recovery, and diffusion tensor imaging images were acquired from 50 consecutive patients with relapsing-remitting MS (all, but one, on disease-modifying therapy) at baseline and 5 years. Brain atrophy was measured using structural image evaluation, using normalization of atrophy percent brain volume change (PBVC) analysis.
Results
During follow-up, brain volume diminished by 2.0% ± 1.1%. PBVC was not associated with patient age, disease duration, sex, or type of treatment. PBVC moderately correlated with baseline lesion load (r = −0.38, p = 0.016), but demonstrated strong association with new lesion activity (r = −0.63, p < 0.001). Brain atrophy was also strongly linked to the increase of water diffusion within chronic MS lesions (r = −0.62, p < 0.001). In normal-appearing white matter (NAWM), PBVC demonstrated a significant correlation with both baseline and longitudinal increase of demyelination as measured by radial diffusivity (RD, r = −0.44, p = 0.005 and r = −0.35, p = 0.026, respectively). Linear regression analysis explained 62% of the variance in PBVC. It confirmed the major role of new lesion activity (p = 0.002, standardized beta-coefficient −0.42), whereas change in diffusivity inside chronic lesions and NAWM RD at baseline also contributed significantly (p = 0.04 and 0.02, standardized beta-coefficient −0.31 and −0.29, respectively), increasing predictive power of the model by 55%.
Conclusion
In addition to new lesion activity, progressive loss of demyelinated axons in chronic lesions and the degree of demyelination in NAWM significantly contribute to accelerated loss of brain tissue in patients with MS receiving immunomodulatory therapy.
Brain atrophy is a sensitive, global measure of neurodegeneration in MS. Brain atrophy predicts future worsening of overall disability and cognition and has been incorporated into newer measures of disease activity such as “no evidence of disease activity-4.”1,2 Brain atrophy also represents an attractive outcome measure for clinical trials of new neuroprotective therapies in MS.3 However, the pathophysiologic mechanisms underlying brain atrophy in MS are still not fully understood. Lesion load is reported to be a poor predictor of subsequent brain atrophy, even when only highly destructive lesions (“black holes”) are analyzed.4 There is a better association between brain atrophy and new lesion activity (including gadolinium (GAD)-enhancing and expanding lesions),5 but this correlation is moderate at best. Other factors, such as diffuse damage of the normal-appearing white matter (NAWM), focal demyelination, iron deposition in gray matter, slowly expanding plaques, and genetic factors, have been suggested to contribute to brain atrophy (see references 2, 4, and 6 for review).
Diffusion tensor imaging (DTI) techniques are widely used for cross-sectional and longitudinal assessment of tissue integrity in both lesion tissue and NAWM of patients with MS.7,8 It was suggested that radial diffusivity (RD) is linked to degree of myelination, whereas axial diffusivity (AD) is associated with axonal pathology.9,10
Using a DTI-based approach, we recently reported evidence of significant tissue damage in chronic MS lesions that correlated with progressive loss of brain tissue.11
The aim of the current study was to evaluate the combined effect of several factors, including baseline lesion load; new and expanding lesions; and baseline and longitudinal measures of tissue integrity in chronic lesions and NAWM, on brain atrophy.
Methods
Standard protocol approvals, registrations, and patient consents
The study was approved by University of Sydney and Macquarie University Human Research Ethics Committees and followed the tenets of the Declaration of Helsinki. Written informed consent was obtained from all participants.
Subjects
Fifty consecutive patients with relapsing-remitting MS (RRMS), defined according to the revised McDonald criteria, were enrolled.
MRI protocol
MRI scanning was performed twice—once at the time of enrollment and again 5 years later. The following sequences were acquired using a 3T GE Discovery MR750 scanner (GE, Milwaukee, WI).
Pre- and post-contrast (GAD) sagittal isotropic (1 mm) 3D T1
fluid attenuation inversion recovery (FLAIR) CUBE (1.2 mm)
Whole brain DTI, 64 directions, b0 = 1,000 s/mm2
For details of MRI protocol and preprocessing, see supplementary material (links.lww.com/NXI/A129).
Lesion identification and analysis
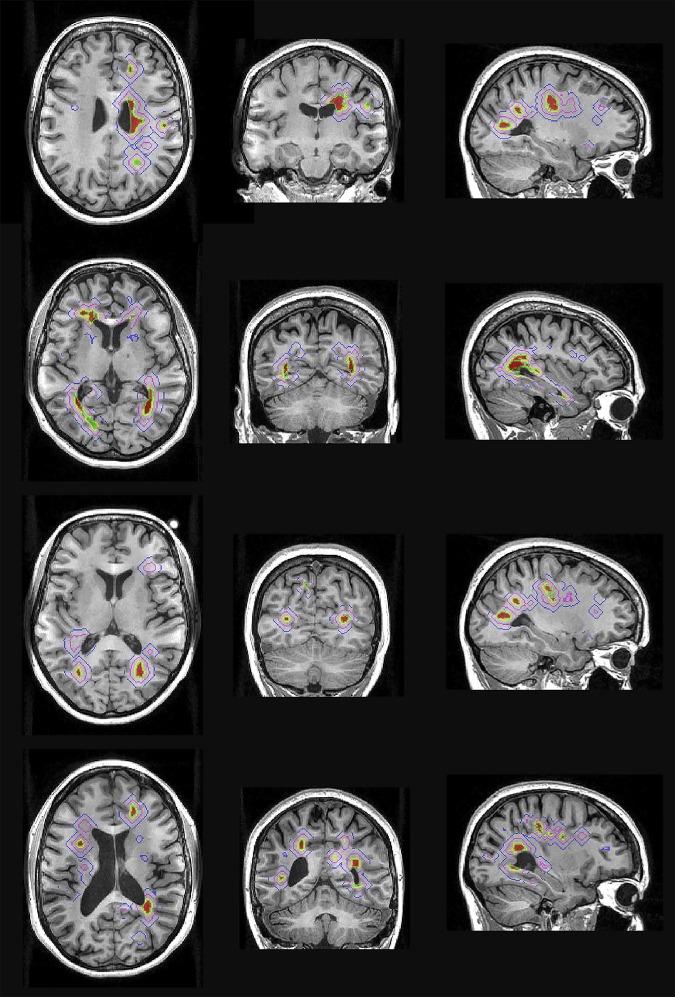
For baseline analysis, lesions were identified on the coregistered baseline T2 FLAIR images and semiautomatically segmented using JIM 7 software (Xinapse Systems, Essex, UK) by a trained analyst. T1 lesion volume was not analyzed in the current study. As we previously reported, T1 lesion size (including, but not limited to black holes) is typically smaller, taking on average about 40% of T2 lesion volume.12 Only lesions appearing on more than 3 consecutive slices were selected for analysis. Following this, lesion volume and DTI indexes were measured. In addition, to isolate the potential effect of “slow burning” chronic inflammation and remyelination,13 which may occur at the lesion edge, the core of the lesion was identified by shrinking the segmented lesion mask in all directions by 1 voxel using the “eroding” function of JIM software. The inner-lesional area immediately surrounding the lesion core (lesion “rim”) and 3 concentric layers at 1, 5, and 10 mm from the lesion edge (“extra-lesional regions of interest [ROIs]”) were also generated. The thickness of each layer was 1 mm (figure 1). These are designated as layer 1, layer 5, and layer 10 based on their distance from the lesion. Extralesional ROIs were intersected with the white matter mask to avoid CSF and gray matter contamination. The most external layer situated 10 mm from the lesion edge (layer 10) was deemed to represent NAWM.14
Figure 1. Segmentation of lesional, perilesional, and normal-appearing white matter displayed on baseline T1 image.
Red represents lesion core, green represents lesion “rim,” perilesional white matter (PLWM) layers (layer 1 and layer 5) are yellow and magenta, and NAWM layer (layer 10) is blue. Layer number represents distance from the lesion in mm.
The lesion mask was also applied to pre-contrast 3D T1-weighted images to quantify the level of T1 hypointensity. To reduce the effect of random variation in scan intensity, the scan-wise (i.e., averaged across all lesions within single patient) lesional and perilesional hypointensity was stratified by the intensity of NAWM (i.e., T1 hypointensity of the external layer situated 10 mm from the lesion edge was subtracted from T1 hypointensity at the lesion and perilesional white matter).
Follow-up lesions were analyzed in 2 different ways. First, to calculate diffusion changes in chronic lesions and corresponding surrounding tissue, a baseline lesion mask was applied to follow-up images. To compensate for the shift in position of follow-up lesions caused by ongoing brain atrophy, the position of every lesion in each slice of the follow-up image was examined and, where necessary, adjusted manually, as described previously.11 Following this, individual ROIs (“core,” “rim,” and external layers) were generated as described above.
To evaluate lesion activity during the observation period, follow-up T2 FLAIR images were segmented using JIM 7 software as implemented for baseline segmentation. The difference between lesion volume at follow-up and baseline was used as a measure of lesion activity.
Patients with GAD-enhancing lesions at any time point were excluded from the analysis because of their potential confounding effect on brain volume (localized inflammatory edema of brain tissue and delayed impact on atrophy) and DTI measures.
Percent brain volume change (PBVC) between the 2 time points was calculated using a modified structural image evaluation, using normalization of atrophy (SIENA)/Functional MRI of the Brain (FMRIB) Software Library (FSL) (v4.1 software, FMRIB [Oxford Centre for Functional MRI of the Brain], Oxford, UK) (S. M. Smith et al., NeuroImage, 2002) pipeline. Briefly, T1 intensity inhomogeneity correction15 was performed, followed by removal of nonbrain tissue using the Brain Extraction Tool from the FSL with manual quality control. The preprocessed brain masks were then imported into SIENA with standard parameters (SIENA v. 2.6). Lesion filling has not been performed.16
Statistics
Statistical analysis was performed using SPSS 22.0 (SPSS, Chicago, IL). For details, see supplementary materials (links.lww.com/NXI/A129).
Data availability
The authors confirm that the data supporting the findings of this study are available within the article and from the corresponding author upon reasonable request.
Results
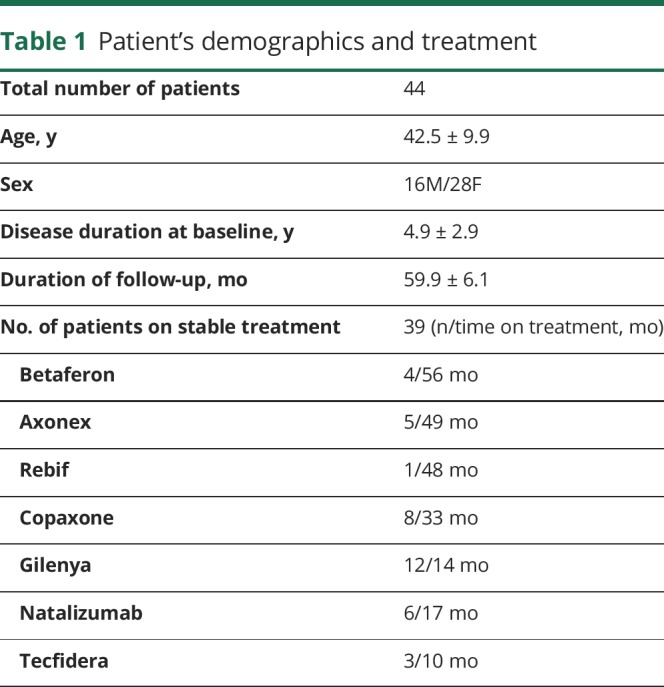
Of 50 enrolled patients, 4 demonstrated GAD-enhancing lesions at baseline, 1 patient had an atypical (Balo-like) lesion, and the baseline image from 1 patient was not of acceptable quality for comparison analysis. Therefore, data from 44 patients were analyzed. All, but one, patients were on treatment at the time of enrollment. Thirty-nine patients were on stable treatment during study follow-up (table 1), whereas in 4 patients, treatment was altered during the study (1-Avonex to Fingolimod, 1-Fingolimod to Tysabri, 1-Aubagio to Tysabri and 1-Tysabri to Lemtrada).
Table 1.
Patient's demographics and treatment
Brain lesion volume (mean ± SD) at baseline was 6.5 ± 6.0 mL (range 0.7–23.9 mL) and increased during the follow-up period to 8.0 ± 6.6 mL (range 0.8–24.2 mL, p < 0.001, paired t test). The median Expanded Disability Status Scale (EDSS) score at baseline was 1.0 (range 0–6) and 1.5 (range 0–6.5) at follow-up (p = 0.08).
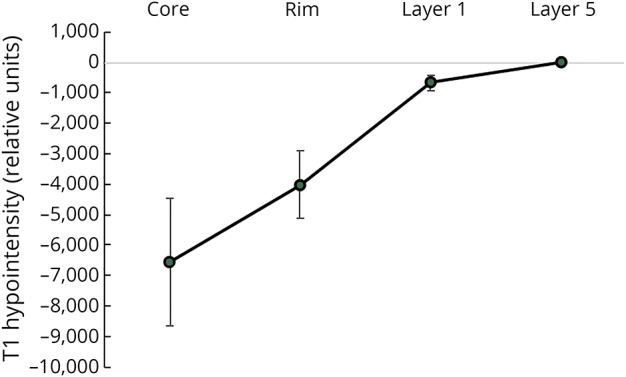
The average (normalized) T1 intensity profile, shown in figure 2, demonstrates the lowest value and highest variation in the lesion core, indicating considerable interpatient variability in the degree of lesion tissue damage.
Figure 2. The average T1 hypointensity profile (mean ± SD) normalized by T1 intensity in NAWM.
Brain atrophy and its relationship with demographics and conventional MRI measures
During follow-up, the brain volume was reduced by 2.0% ± 1.1% (or 0.41% annually). PBVC data were normally distributed (Shapiro-Wilk test, p = 0.36). PBVC was not associated with patient age (r = 0.14, p = 0.4), disease duration (r = 0.07, p = 0.8), or duration of the follow-up (r = 0.22, p = 0.17). In addition, PBVC was not different between male and female patients (−2.0% and −1.9%, respectively, p = 0.9, Student t test). PBVC correlated with the baseline EDSS score (r = 0.5, p = 0.001, Spearman). There was, however, no correlation with change in the EDSS score during follow-up. Participants were also categorized according to their prescribed treatment into 2 groups. A platform group comprised patients treated with glatiramer acetate or beta-interferon throughout duration of the study (18 patients, median EDSS score 1), whereas the advanced treatment group included individuals on stable treatment with fingolimod, dimethyl fumarate, natalizumab, or alemtuzumab (24 patients, median EDSS score 1.5). There was no difference in the rate of brain atrophy between treatment groups (−1.8% and −2.0% for platform and advanced treatment groups, respectively, p = 0.7, t test). Brain pseudoatrophy has been previously reported in patients receiving specific MS therapy (namely fingolimod and natalizumab) during first 12 months of treatment.17 However, in our study cohort, no correlation was detected between PBVC and time on treatment in this group (p = 0.2).
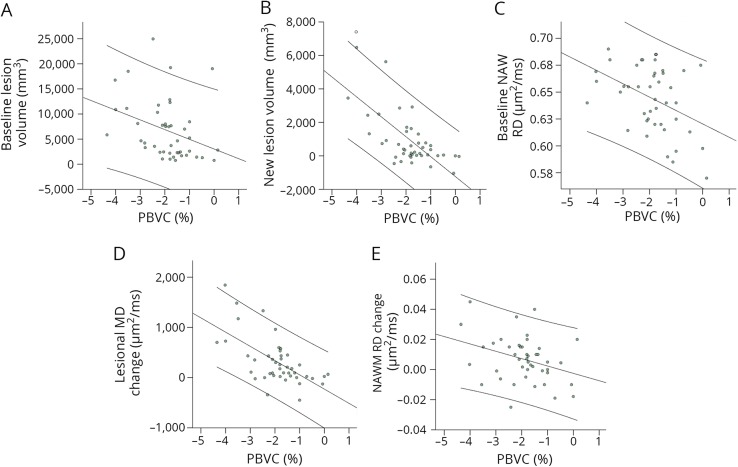
A correlation was observed between PBVC and baseline lesion volume (r = −0.38, p = 0.016, nonparametric partial correlation) (figure 3A). Adding lesion T1 hypointensity (which reflects the level of lesion tissue damage) as a covariate did not increase the correlation (r = −0.38, p = 0.017, nonparametric partial correlation).
Figure 3. Correlation plots between PBVC and 5 individually significant variables.
(A) Baseline lesion volume (vertical scale units, mm3); (B) new lesion volume (vertical scale units, mm3); (C) baseline NAWM RD (vertical scale units, μm2/ms); (D) change in lesion MD (vertical scale units, μm2/ms); and (E) change in NAWM RD (vertical scale units, μm2/ms). Two parallel lines represent 95% CI. PBVC = percent brain volume change.
There was, however, a much stronger association between PBVC and new lesion activity (i.e., increase of lesion volume during the study) (r = −0.63, p < 0.001, nonparametric partial correlation), indicating that new lesions alone account for 40% of PBVC variability. Correlation graph is shown in figure 3B.
Baseline and longitudinal diffusivity measures
Baseline and follow-up diffusivity measures are presented in table 2.
Table 2.
Diffusivity data at baseline and follow-up (mean ± SD)
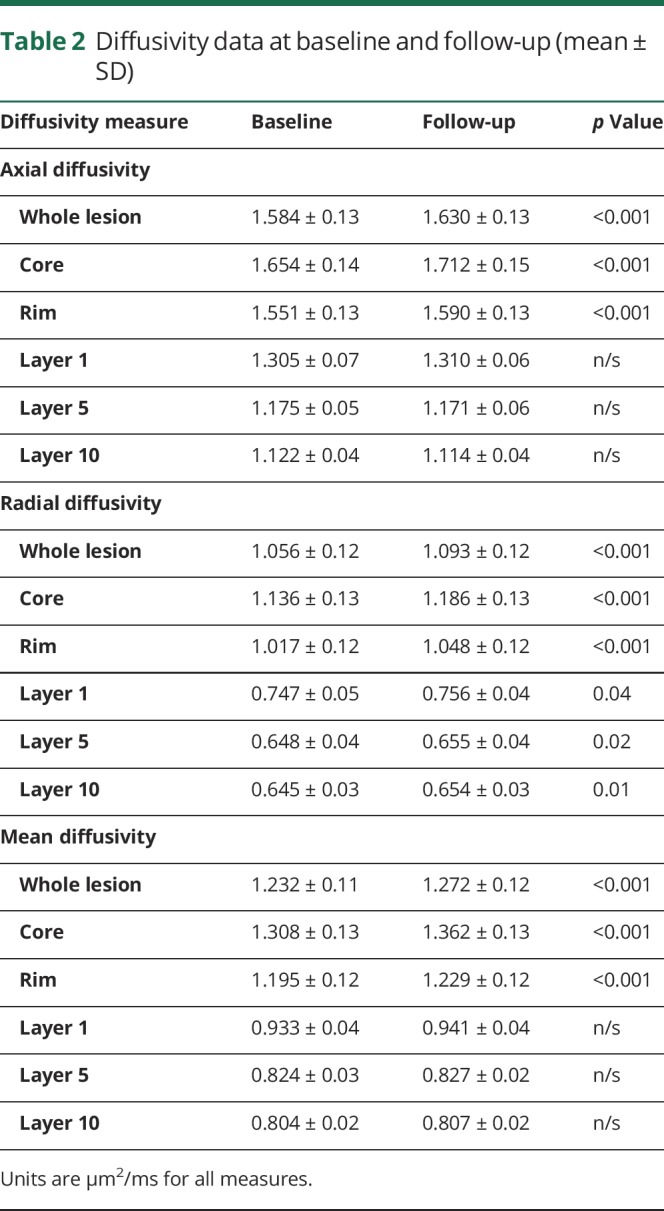
At baseline, all diffusivity measures were elevated within MS lesions compared with NAWM (p < 0.001 for AD, RD, and mean diffusivity [MD]). High diffusivity was particularly evident in the core of established lesions, gradually dropping toward perilesional white matter.
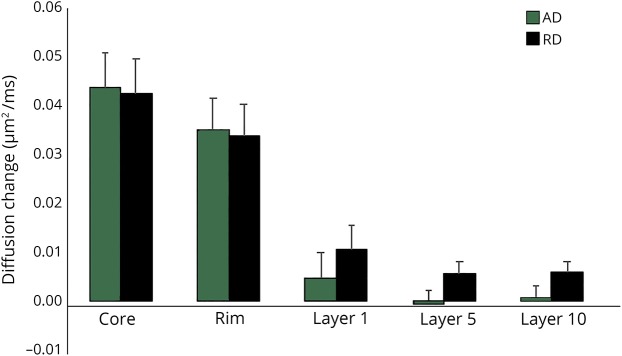
During follow-up, the diffusivity within chronic MS lesions increased significantly. This change was again more profound in the lesion core. A progressive and identical increase in parallel (AD) and perpendicular (RD) diffusivity within MS lesions (i.e., in both “core” and “rim” areas) suggested that the diffusion change within lesions was isotropic (i.e., equal in all directions) in nature (figure 4). Therefore, MD was used in subsequent analyses of the relationship between lesion diffusivity and brain atrophy.
Figure 4. Change of AD and RD in lesion core, lesion “rim,” perilesional, and normal-appearing white matter.
Error bars represent SE. AD = axial diffusivity; RD = radial diffusivity.
Conversely, in NAWM (i.e., in external layer 10), parallel and perpendicular diffusivities demonstrated different behavior. AD remained stable during the follow-up period, but there was increase of RD (albeit on a much lesser scale than the change in RD within lesions) (figure 4). The increase in NAWM RD did not correlate with new lesion activity (partial correlation, r = 0.27, p = 0.09) or diffusivity changes inside chronic lesions (partial correlation, r = 0.21, p = 0.1).
Correlation of PBVC with baseline diffusivity
Brain atrophy over 5 years did not correlate with baseline diffusivity in the lesion core (r = −0.14, p = 0.37, r = −0.12, p = 0.45 and r = −0.13, p = 0.42 for MD, RD, and AD, respectively, partial correlation) or baseline NAWM AD (r = 0.3, p = 0.06, partial correlation). However, there was a significant association with baseline NAWM RD (r = −0.44, p = 0.005, partial correlation) (figure 3C).
Correlation of PBVC with longitudinal diffusivity change
There was significant association between PBVC and longitudinal increase in diffusivity within the core of chronic MS lesions (r = −0.35, p = 0.025, partial correlation). This correlation was further strengthened when lesion diffusivity change was stratified (i.e., multiplied) by the baseline lesion volume (r = −0.62, p < 0.001, partial correlation) (figure 3D).
Brain atrophy correlated with longitudinal RD change in NAWM (r = −0.35, p = 0.026, partial correlation) (figure 3E), but not with longitudinal AD change in NAWM (r = −0.12, p = 0.46, partial correlation).
Linear regression model
Linear regression modeling was performed to evaluate the relative contribution of various factors to brain atrophy. PBVC was used as a dependent variable. Five variables, which demonstrated significant correlation with brain atrophy, were included in the model, namely new lesion activity, progressive increase of MD in the lesion core (adjusted for lesion volume), baseline NAWM RD, change of RD in NAWM, and baseline lesion volume. Age and sex were also added to the model. None of the variables demonstrated collinearity. The linear regression model explained more than 60% of intersubject variance of the progressive brain atrophy (r2 = 0.62, adjusted r2 = 0.54). First 3 variables (new lesion activity, progressive increase of MD in the lesion core, and baseline NAWM RD) contributed significantly to the model (p = 0.002, 0.03, and 0.03, standardized beta-coefficient = −0.44, −0.35, and −0.29 for new lesion activity, progressive increase of lesion MD, and baseline NAWM RD, respectively). The contribution of new lesion activity was highest, whereas increase of lesion diffusivity and baseline NAWM RD contributed equally to the model (significance of F change = 0.01 and 0.04, respectively). The contribution of other variables was not significant (significance of F change = 0.4 and 0.09 for baseline lesion volume and NAWM RD change, respectively). The regression plot is presented in figure 5.
Figure 5. PBVC linear regression analysis.
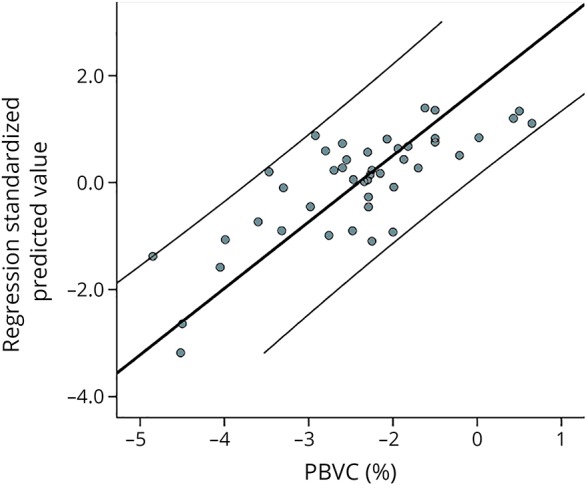
Two parallel lines represent 95% CI. PBVC = percent brain volume change.
Discussion
In the current study, we evaluated the contribution of several factors to progressive brain atrophy in patients with RRMS over 5 years. Although the pathophysiology of brain atrophy has been extensively researched elsewhere, the current work emphasizes the impact of progressive tissue injury within established MS lesions and myelin pathology in NAWM, which are not commonly included in analysis of brain atrophy. An MRI-derived measure of isotropic water diffusion was used to estimate progressive lesion damage, as described by Klistorner et al.,11 whereas alteration in RD was used to assess the level of microstructural tissue injury and demyelination in NAWM.
We demonstrate significant brain atrophy over 5 years in a cohort of patients with relatively short disease duration and mild disability. Although the rate of brain atrophy was lower than reported in some previously published studies,2 patients with active disease (GAD lesions evident on MRI) were excluded from the analysis. In addition, all, but one, patients were on disease-modifying treatment. Therefore, combination of mildly affected cohort and effective therapy may be responsible for slow rate of brain atrophy. Similar rates of brain volume loss have been described in other well-controlled MS populations.5,18 PBVC in our study was also considerably larger than reported in healthy subjects of comparable age (0.15%).19
Because of the small size of treatment groups, the effect of individual therapy on atrophy rate was not assessed. Brain pseudoatrophy caused by resolution of ongoing white matter inflammation has been reported to occur within first 12 months of fingolimod or natalizumab treatment initiation.17 However, this is unlikely to have a significant effect on the rate of brain atrophy reported in the current study because the majority of patients were on stable treatment for more than 12 months. In addition, there was no correlation between PBVC and time on treatment in the fingolimod/natalizumab group. Furthermore, largest effect of pseudoatrophy is typically observed in patients with GAD-enhancing lesions at baseline,20 whereas in the current cohort, patients with active baseline lesions were excluded from analysis.
Concordant with previous studies,21 demographic factors (age, sex, and disease duration) did not affect the rate of progressive loss of brain tissue. Although treatment has been shown to have effect on the rate of brain atrophy in MS,1 the type of treatment did not significantly affect PBVC in the current study, potentially reflecting the fact that patients were receiving highly efficacious therapy.
We identified several factors that were individually associated with the rate of brain volume loss, namely baseline lesion load and new lesion activity, progressive tissue injury within chronic lesions, and diffuse alterations in NAWM. Each factor is discussed below.
Baseline lesion load
Baseline lesion load demonstrated a modest effect on subsequent brain atrophy and, in accordance with previous studies (see reference 4 for review), accounted for a small proportion (14%) of the variance in atrophy in our patient cohort. Although intersubject mean T1 lesion hypointensity varied widely, indicating a broad spectrum of tissue injury within lesions, the correlation was not augmented by the addition of T1 hypointensity as a covariate.
The relationship between baseline lesion load and PBVC we believe is likely to be the result of delayed retrograde and Wallerian degeneration (which in the CNS can persist for years22) of axons that were transected during lesion formation and, as a result, “committed” to neurodegeneration.23 In addition, other factors, such as slowly spreading trans-synaptic degeneration, may also play a role.24,25
New lesion activity
New lesion activity, as measured by increase of T2 lesion load between baseline and follow-up, was strongly associated with progressive brain volume loss, explaining 40% of PBVC variability, which is similar to previous studies.5,26 The association with global brain volume loss is likely attributable to axonal transection in newly forming and slowly enlarging lesions, with subsequent Wallerian and retrograde degeneration and secondary neuronal loss and gray matter thinning.6,27,28
Progressive tissue injury within chronic lesions
The results of the current study confirm our previous observation of a significant and highly concordant increase in RD and AD in the core of established MS lesions.11 This isotropic increase of lesion water diffusion (stratified by lesion volume) individually accounted for 38% of brain atrophy variance.
We recently postulated that a progressive, isotropic increase in diffusivity in the core of chronic MS lesions likely reflects enlargement of the extracellular space caused by ongoing tissue loss.11 Histopathologically, chronic lesions are dominated by demyelinated axons and glia; permanent demyelination may contribute to accelerated focal axonal damage that culminates in axonal transection and gradual attrition due to Wallerian and retrograde degeneration.29–31 However, fibrillary gliosis, which developed during the initial (acute) inflammatory stage of lesion formation,32 is likely to support the structural integrity of established lesions and prevents collapse of lesion tissue despite progressive lesion axonal loss. This, therefore, can lead to an enlargement of extracellular space and, as a consequence, an increase in isotropic water diffusion. Axonal transection within the lesion also causes Wallerian and retrograde degeneration of the extralesional portion of axons that traverse it and ultimately the death of connected neurons. However, because there is no excessive glial proliferation in normal-appearing white and gray matter, the elimination of axolemma, myelin sheath, and neurons from non-lesional part of the brain is likely to result in white and gray matter shrinkage. The proposed mechanism may explain the relationship of brain atrophy with increased water diffusion within chronic lesions.
Diffuse alterations within NAWM
We observed a significant correlation of PBVC and baseline RD in NAWM. Because increase of RD is linked to white matter demyelination,9 this association indicates that diffuse reduction of myelin in NAWM is likely to contribute to subsequent loss of brain tissue, which is in keeping with previous reports.33,34
Occult injury to the NAWM (and demyelination in particular)35,36 is likely to be a lesion-independent process6,7 linked to subclinical inflammation and diffuse microglial activation.37 The lack of association between new lesion activity and progressive RD change in NAWM observed in this study supports this hypothesis. In addition, the absence of correlation between diffusivity changes within and outside of lesion tissue over the course of the study highlights dichotomous nature of chronic tissue alterations in established lesions and NAWM.
Demyelination of axons in NAWM, as suggested by increased baseline RD, may affect brain atrophy via multiple mechanisms. Because myelin sheaths occupy approximately 25%–30% of the white matter volume,38 loss of myelin will lead to a direct reduction in brain volume.2 In addition, denuded axons are more susceptible to environmental and physiologic stress. Gradual axonal attrition on this basis may therefore indirectly result in brain volume loss.29,30
The effect of NAWM demyelination on progressive brain atrophy is also supported by the increase of NAWM RD during the follow-up and its significant association with PBVC. However, the contribution of age-related RD change can not be fully excluded.39
Multifactorial analysis
Combination of all individually significant factors explained more than 60% of the intersubject variance in PBVC. The model confirmed the critical impact of new lesion activity on subsequent loss of the brain tissue, an observation with overt clinical implications that has been well established by previous work.4 Because acute transection of large number of axons characterizes new lesion formation, an effect on brain atrophy, presumably mediated by Wallerian and retrograde degeneration that affects both connected white matter tracts and distant gray matter, is not surprising.
Remarkably, 2 other significant factors, namely the observed longitudinal isotropic increase in diffusivity within chronic lesions and the level of baseline RD in NAWM, increased the predictive power of the regression model by >50%. Precise mechanisms that link these factors to brain atrophy are yet to be determined. However, it is plausible that both factors reflect, at least to same extend, the deleterious effects of chronic demyelination on axon survival.
The multifactorial mechanism of brain atrophy observed in this study may explain the shortcomings of existing disease-modifying therapies, which radically diminish the formation of new inflammatory lesions, but fail to fully arrest disease progression3 and have little impact on progressive forms of MS.
This study has several limitations. First, neuronal and glial loss, and neuronal shrinkage, which is known to occur in the cortical and deep gray matter in MS, may represent an additional factor contributing to gray matter (and, consequently, whole brain) atrophy.40 However, gray matter lesions, which are notoriously difficult to identify on conventional MRI, have not been analyzed in this study. Second, no longitudinal data from normal controls were available to assess the age-related changes of diffusivity in NAWM. In addition, the relatively small sample size of the current study may have prevented the detection of other, more subtle contributors to brain atrophy.
In summary, we demonstrate that in addition to damage from new lesions, both progressive loss of demyelinated axons within chronic lesions and demyelination in NAWM (as evidenced by increased RD) accelerate whole brain volume loss in patients with MS receiving immunomodulatory therapy.
Glossary
- AD
axial diffusivity
- DTI
diffusion tensor imaging
- EDSS
Expanded Disability Status Scale
- FLAIR
fluid attenuation inversion recovery
- FSL
Functional MRI of the Brain Software Library
- GAD
gadolinium
- MD
mean diffusivity
- NAWM
normal-appearing white matter
- PBVC
percent brain volume change
- RD
radial diffusivity
- ROI
region of interest
- RRMS
relapsing-remitting MS
Appendix. Authors

Study funding
Supported by the National Multiple Sclerosis Society (NMSS), Novartis Save Neuron Grant, Sydney Eye Hospital foundation grant, Sydney Medical School Foundation, and National Health and Medical Research Council (NHMRC).
Disclosure
The authors report no relevant disclosures. Go to Neurology.org/NN for full disclosures.
References
- 1.Alroughani R, Deleu D, El Salem K, et al. . A regional consensus recommendation on brain atrophy as an outcome measure in multiple sclerosis. BMC Neurol 2016;16:1–9. [DOI] [PMC free article] [PubMed] [Google Scholar]
- 2.De Stefano N, Airas L, Grigoriadis N, et al. . Clinical relevance of brain volume measures in multiple sclerosis. CNS Drugs 2014;28:147–156. [DOI] [PubMed] [Google Scholar]
- 3.Beck ES, Reich DS. Brain atrophy in multiple sclerosis: how deep must we go? Ann Neurol 2018;83:208–209. [DOI] [PubMed] [Google Scholar]
- 4.Bermel RA, Bakshi R. The measurement and clinical relevance of brain atrophy in multiple sclerosis. Lancet Neurol 2006;5:158–170. [DOI] [PubMed] [Google Scholar]
- 5.Radue E, Barkhof F, Kappos L, et al. . Correlation between brain volume loss and clinical and MRI outcomes in multiple sclerosis. Neurology 2015;84:784–793. [DOI] [PMC free article] [PubMed] [Google Scholar]
- 6.Filippi M, Rocca MA, Barkhof F, et al. . Association between pathological and MRI findings in multiple sclerosis. Lancet Neurol 2012;11:349–360. [DOI] [PubMed] [Google Scholar]
- 7.Harel A, Sperling D, Petracca M, et al. . Brain microstructural injury occurs in patients with RRMS despite “no evidence of disease activity”. J Neurol Nerosurg Psychiatry 2018;89:977–982. [DOI] [PubMed] [Google Scholar]
- 8.Ontaneda D, Sakaie K, Lin J, et al. . Measuring brain tissue integrity during 4 years using diffusion tensor imaging. AJNR Am J Neuroradiol 2017;38:31–38. [DOI] [PMC free article] [PubMed] [Google Scholar]
- 9.Song S-K, Yoshino J, Le TQ, et al. . Demyelination increases radial diffusivity in corpus callosum of mouse brain. Neuroimage 2005;26:132–140. [DOI] [PubMed] [Google Scholar]
- 10.Janve V a, Zu Z, Yao SY, et al. . The radial diffusivity and magnetization transfer pool size ratio are sensitive markers for demyelination in a rat model of type III multiple sclerosis (MS) lesions. Neuroimage 2013;74:298–305. [DOI] [PMC free article] [PubMed] [Google Scholar]
- 11.Klistorner A, Wang C, Yiannikas C, et al. . Evidence of progressive tissue loss in the core of chronic MS lesions: a longitudinal DTI study. Neuroimage Clin 2018;17:1028–1035. [DOI] [PMC free article] [PubMed] [Google Scholar]
- 12.Klistorner A, Wang C, Fofanova V, et al. . Diffusivity in multiple sclerosis lesions : at the cutting edge? Neuroimage Clin 2016;12:219–226. [DOI] [PMC free article] [PubMed] [Google Scholar]
- 13.Barkhof F, Bruck W, De Groot CJA, et al. . Remyelinated lesions in multiple sclerosis: magnetic resonance image appearance. Arch Neurol 2003;60:1073–1081. [DOI] [PubMed] [Google Scholar]
- 14.Allen I V, Mckeown SR. A histological, histochemical and biochemical study of the microscopically normal white matter in multiple sclerosis. J Neurol Sci 1979;41:81–91. [DOI] [PubMed] [Google Scholar]
- 15.Tustison NJ, Avants BB, Cook PA, et al. . N4ITK: improved N3 bias correction. IEEE Trans Med Imaging 2010;29:1310–1320. [DOI] [PMC free article] [PubMed] [Google Scholar]
- 16.Battaglini M, Jenkinson M, De Stefano N. Evaluating and reducing the impact of white matter lesions on brain volume measurements. Hum Brain Mapp 2012;33:2062–2071. [DOI] [PMC free article] [PubMed] [Google Scholar]
- 17.Wattjes MP, Rovira À, Miller D, et al. . Evidence-based guidelines: MAGNIMS consensus guidelines on the use of MRI in multiple sclerosis—establishing disease prognosis and monitoring patients. Nat Rev Neurol 2015;11:597–606. [DOI] [PubMed] [Google Scholar]
- 18.Barkhof F, De Jong R, Sfikas N, De Vera A. The influence of patient demographics, disease characteristics and treatment on brain volume loss in Trial Assessing Injectable Interferon vs FTY720 oral in relapsing—remitting multiple sclerosis (TRANSFORMS), a phase 3 study of fingolimod in multiple sclerosis. Mult Scler 2014;20:1704–1713. [DOI] [PubMed] [Google Scholar]
- 19.Opfer R, Ostwaldt AC, Sormani MP, et al. . Estimates of age-dependent cutoffs for pathological brain volume loss using SIENA/FSL—a longitudinal brain volumetry study in healthy adults. Neurobiol Aging 2018;65:1–6. [DOI] [PubMed] [Google Scholar]
- 20.De Stefano N, Silva D, Barnett MH. Effect of fingolimod on brain volume loss in patients with multiple sclerosis. CNS Drugs 2017;31:289–305. [DOI] [PMC free article] [PubMed] [Google Scholar]
- 21.Rudick RA, Fisher E, Lee J, Simon J, Jacobs L. Use of the brain parenchymal fraction to measure whole brain atrophy in relapsing-remitting MS. Multiple Sclerosis Collaborative Research Group. Neurology 1999;53:1698–1704. [DOI] [PubMed] [Google Scholar]
- 22.Vargas ME, Barres BA. Why is Wallerian degeneration in the CNS so slow? Annu Rev Neurosci 2007;30:153–179. [DOI] [PubMed] [Google Scholar]
- 23.Lee H, Narayanan S, Brown RA, et al. . Brain atrophy after bone marrow transplantation for treatment of multiple sclerosis. Mult Scler 2017;23:420–431. [DOI] [PubMed] [Google Scholar]
- 24.Gabilondo I, Martínez-Lapiscina EH, Martínez-Heras E, et al. . Trans-synaptic axonal degeneration in the visual pathway in multiple sclerosis. Ann Neurol 2014;75:98–107. [DOI] [PubMed] [Google Scholar]
- 25.Tur C, Goodkin O, Altmann DR, et al. . Longitudinal evidence for anterograde trans-synaptic degeneration after optic neuritis. Brain 2016;139:816–828. [DOI] [PMC free article] [PubMed] [Google Scholar]
- 26.Paolillo A, Piattella MC, Pantano P, et al. . The relationship between inflammation and atrophy in clinically isolated syndromes suggestive of multiple sclerosis: a monthly MRI study after triple-dose gadolinium-DTPA. J Neurol 2004;251:432–439. [DOI] [PubMed] [Google Scholar]
- 27.Dal A, Günther B, Kronnerwetter C, et al. . Slow expansion of multiple sclerosis iron rim lesions: pathology and 7 T magnetic resonance imaging. Acta Neuropathol 2017;133:25–42. [DOI] [PMC free article] [PubMed] [Google Scholar]
- 28.Prineas JW, Kwon EE, Cho E, et al. . Immunopathology of secondary-progressive multiple sclerosis. Ann Neurol 2006;50:646–657. [DOI] [PubMed] [Google Scholar]
- 29.Kornek B, Storch MK, Weissert R, et al. . Multiple sclerosis and chronic autoimmune encephalomyelitis: a comparative study of axonal injury in active, inactive and remyelinated lesons. Am J Pathol 2000;157:267–276. [DOI] [PMC free article] [PubMed] [Google Scholar]
- 30.Bruck W. Inflammatory demyelination is not central to the pathogenesis of multiple sclerosis. J Neurol 2005;252:V/10–V/15. [DOI] [PubMed] [Google Scholar]
- 31.Correale J, Gaitán MI, Yssraelit M, Fiol M, Isrraelit MC, Fiol M. Progressive multiple sclerosis: from pathogenic mechanisms to treatment multiple sclerosis. Brain 2017;140:527–546. [DOI] [PubMed] [Google Scholar]
- 32.Miller DH, Barkhof F, Frank JA, Pakrker GJ, Thompson AJ. Measurement of atrophy in multiple sclerosis: pathological basis, methodological aspects and clinical relevance. Brain 2002;125:1676–1695. [DOI] [PubMed] [Google Scholar]
- 33.Kalkers N, Vrenken H, Uitdehaag B, Polman C, Barkhof F. Brain atrophy in multiple sclerosis: impact of lesions and of damage of whole brain tissue. Mult Scler [online Serial] 2002;8:410–414. [DOI] [PubMed] [Google Scholar]
- 34.Tortorella C, Viti B, Bozzali M, et al. . A magnetization transfer histogram study of normal-appearing brain tissue in MS. Neurology 2000;54:186. [DOI] [PubMed] [Google Scholar]
- 35.Kim S, Kwak K, Hyun J, et al. . Diffusion tensor imaging of normal-appearing white matter in patients with neuromyelitis optica spectrum disorder and multiple sclerosis. Eur J Neurol 2017;24:966–973. [DOI] [PubMed] [Google Scholar]
- 36.de Kouchkovsky I, Fieremans E, Fleysher L, Herbert J, Grossman RI, Inglese M. Quantification of normal-appearing white matter tract integrity in multiple sclerosis: a diffusion kurtosis imaging study. J Neurol 2016;263:1–10. [DOI] [PMC free article] [PubMed] [Google Scholar]
- 37.Giannetti P, Politis M, Su P, et al. . Increased PK11195-PET binding in normal-appearing white matter in clinically isolated syndrome. Brain 2015;138:110–119. [DOI] [PMC free article] [PubMed] [Google Scholar]
- 38.Duval T, Cohen-adad J. Modeling white matter microstructure. Funct Neurol 2016;31:217–228. [DOI] [PMC free article] [PubMed] [Google Scholar]
- 39.Burzynska AZ, Preuschhof C, Bäckman L, et al. . Age-related differences in white matter microstructure : region-specific patterns of diffusivity. Neuroimage 2010;49:2104–2112. [DOI] [PubMed] [Google Scholar]
- 40.Popescu V, Klaver R, Voorn P, et al. . What drives MRI-measured cortical atrophy in multiple sclerosis ? Mult Scler J 2015;21:1280–1291. [DOI] [PubMed] [Google Scholar]
Associated Data
This section collects any data citations, data availability statements, or supplementary materials included in this article.
Data Availability Statement
The authors confirm that the data supporting the findings of this study are available within the article and from the corresponding author upon reasonable request.


