Abstract
Objective
We explored the incremental value of adding multiple disease activity biomarkers in CSF and serum for distinguishing MRI-based benign from aggressive MS in early disease course.
Methods
Ninety-three patients diagnosed with clinically isolated syndrome (CIS) or early MS were divided into 3 nonoverlapping severity groups defined by objective MRI criteria. Ninety-seven patients with noninflammatory neurologic disorders and 48 patients with other inflammatory neurologic diseases served as controls. Leukocyte subsets in the CSF were analyzed by flow cytometry. CSF neurofilament light chain (NfL) and chitinase-3-like protein 1 (CHI3L1) levels were measured by ELISA. Serum NfL levels were examined using single molecule array technology.
Results
CSF CD20+/CD14+ ratios and NfL levels in CSF and serum were significantly different between high and low MRI severity groups, whereas no difference was found for CSF CHI3L1 levels. NfL levels in CSF and serum highly correlated. Receiver operating characteristic analysis demonstrated that the cumulative sums combining CSF CD20+/CD14+ ratios and NfL levels in serum or CSF considerably improved diagnostic accuracy. A composite score built from these 2 cumulative sums best distinguished MRI severity. These findings were validated by support vector machine analysis, which confirmed that the accuracy of the cumulative sums and composite score outperforms single biomarkers.
Conclusion
Patients with extreme manifestations of CIS or early MS defined by strict MRI parameters can be best distinguished by combining markers of intrathecal B-cell accumulation and axonal damage. This could stratify individual treatment decisions toward a more personalized immunotherapy.
Particularly at the beginning of chronic neuroinflammation, i.e., clinically isolated syndrome (CIS) and MS, biomarkers reflecting tissue damage and subclinical disease activity are urgently needed to enable the identification of aggressive disease courses. MRI is by far the most extensively used surrogate marker in MS trials and provides diagnostic and monitoring value in clinical practice, but is intricate and limited in its prognostic potential in individual patients. There is a growing recognition that CSF biomarkers can reflect different aspects of MS pathophysiology, evidenced by the recent incorporation of CSF-specific oligoclonal bands (OCBs) in the 2017 revised McDonald diagnostic criteria for relapsing-remitting (RR) MS.1 However, the use of such biomarkers for prognostic estimation or consultation of patients regarding disease course and treatment decisions is not yet possible. Therefore, the goal of this study was to connect current knowledge and cutting-edge insights to develop an improved and reliable model that integrates multiple disease activity biomarkers in CSF and serum.
In earlier studies, a higher progression rate was reported in patients with MS demonstrating distinct CSF cytology patterns with a high B-cell and low monocyte count,2 and our group identified the CD20+/CD14+ cell ratio as an eligible biomarker for discrimination between patients with CIS or MS and healthy controls and showed a correlation between CD20+/CD14+ cell ratios and T2 lesion progression and conversion from CIS to MS.3
Neurofilament light chain (NfL) represents one of the main constituents of the neuronal cytoskeleton and has emerged as a quantitative marker of axonal damage, neurodegeneration, and presumably blood-brain barrier disruption. Technical progress using a highly sensitive quantification method has paved the way for its use as a peripheral blood biomarker. Given the association between axonal damage and permanent neurologic deficits in MS, NfL is a promising marker for disability progression4,5 and a possible predictor for the response to disease-modifying treatment.5
The hydroxylase chitinase-3-like protein 1 (CHI3L1) can be found in astrocytes and glial cells in white matter plaques of patients with MS and has been suggested to be a glial activation marker.6–8 High CSF levels of CHI3L1 have been associated with the conversion of CIS to MS and disability progression.9,10
Knowledge regarding the added value of combining different biomarkers for the most accurate identification of extreme disease courses in patients with MS is still limited. Based on standardized MRI measurements, we investigated the incremental value of adding multiple molecular and cellular biomarkers in the early disease stage to distinguish between benign and aggressive MS disease courses.
Methods
Patients
In this cross-sectional study, 93 patients diagnosed with CIS or early RRMS (according to the 2017 revised McDonald criteria1) were selected out of 1,156 patients recruited at the Department of Neurology at the University Medical Center Mainz (Germany) between 2015 and 2018 according to the following criteria: (1) patients aged at least 18 years, (2) time from disease onset <2 years, (3) lumbar puncture performed in proximity (≤3 weeks) to brain MRI, (4) no corticosteroid use within 60 days before brain MRI or lumbar puncture, (5) no use of immunomodulatory treatment before brain MRI or lumbar puncture. All patients with tumefactive lesions have been tested negative for anti-aquaporin 4 antibodies and anti-myelin oligodendrocyte glycoprotein antibodies.
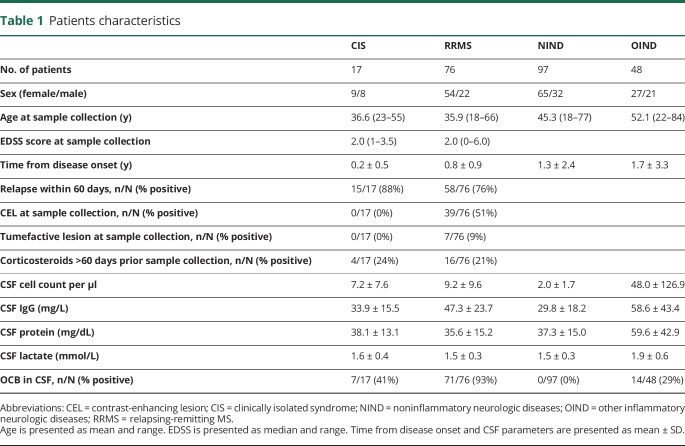
CSF and serum samples from 238 patients were included for analysis. Patient characteristics and basic CSF parameters are provided in table 1. Briefly, this included 17 patients with CIS, 76 patients with RRMS, 97 patients with noninflammatory neurologic disorders (NINDs), and 48 patients with other inflammatory neurologic diseases (OIND) (including neurosarcoidosis, neuroborreliosis, cerebral vasculitis, Guillain-Barré syndrome, autoimmune encephalitis, viral meningoencephalitis, inflammatory facial palsy, basal meningoencephalitis, and neurolupus).
Table 1.
Patients characteristics
Standard protocol approvals, registrations, and patient consents
The study was approved by the local ethics committee (number 837.019.10); written informed consent was obtained from all patients.
MRI analysis
MRI scans of all patients with CIS and MS included a T1-weighted sequence, a T1-weighted fluid-attenuated inversion recovery sequence, and contrast-enhanced T1-weighted images and were analyzed by a neuroradiologist with regard to lesion number and size and to contrast-enhancing lesions. Spinal cord MRI was available from 12/17 (71%) patients with CIS and 60/76 (79%) patients with RRMS. All patients with clinical presentation suggesting a spinal cord involvement received spinal cord MRI. The neuroradiologist was blinded to the CSF and serum biomarker data.
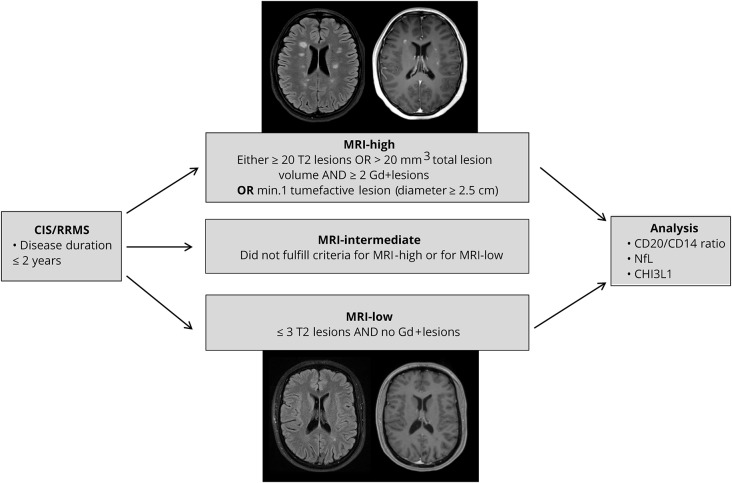
Using objective MRI activity according to the criteria given in figure 1, we divided the patients with CIS and RRMS into 3 different groups defined as exhibiting high (MRI-high), intermediate (MRI-int), and low (MRI-low) MRI activity. Twenty-three patients were graded MRI-high, 51 MRI-int, and 19 MRI-low. Characteristics of the MRI-defined severity groups are presented in table e-1, links.lww.com/NXI/A128. There were no significant differences in the sex ratio between MRI-defined groups.
Figure 1. Flowchart of the study design.
We divided our cohort of patients with CIS/RRMS with a disease course ≤2 years into 3 groups based on objective MRI-defined severity. Specifically, 23 patients were graded MRI-high, 51 MRI-intermediate, and 19 MRI-low. Allocation to the extreme groups of MRI phenotype was related to CSF CD20+/CD14+ cell ratios, CSF/serum NfL levels, and CSF CHI3L1 levels. CIS = clinically isolated syndrome; CHI3L1 = chitinase-3-like protein 1; NfL = neurofilament light chain; RRMS = relapsing-remitting MS.
Flow cytometry of CSF samples
Five milliliters of CSF were obtained by lumbar spinal tap and centrifuged at 550g at 4°C for 5 minutes. The supernatant was removed, and the pellet was resuspended and incubated at 4°C for 20 minutes with fluorochrome-labeled antibodies against CD4, CD8, CD20, CD25, C-C chemokine receptor type 6 (CCR6), HLA-DR, CD14, and CD45 (BD Pharmingen Mouse Anti-Human Antibodies: CD4 PerCP, CD8 FITC, CD 20 Alexa Fluor 700, CD25 PE-Cy7, CD196 (CCR6) PE, Anti-HLA-DR V450, and CD14 APC; eBioscience mouse Anti-Human Antibody: CD45 EF 605). Cells were washed and resuspended in 200 μL of fluorescence-activated cell sorting (FACS) buffer before FACS analysis on a FACSCanto-II. Analysis of cell subset counts was performed with FlowJo. All CSF and serum tests were performed with researchers blinded to the clinical diagnosis and MRI results. CSF samples were measured by flow cytometry in a time frame of 90 minutes after lumbar spinal tab. CSF supernatants were stored in polypropylene tubes at −80°C until batched analysis of NfL and CHI3L1 concentrations.
NfL ELISA of CSF samples
The NF-light ELISA (UmanDiagnostics, Quanterix Corp., Billerica, MA) was used for quantification of NfL in CSF supernatants of patients with CIS and MS.
According to the manufacturer's instructions, reagents were prepared and brought to room temperature. Wells were washed 3 times with 300 μL of wash buffer. Hundred microliters of sample, control, or standard mixed with an equal volume of sample diluent was added per well and incubated for 1 hour at room temperature with agitation (800 rpm). Wells were washed again 3 times. Hundred microliters of the specific conjugated monoclonal tracer antibody was added to each well and incubated for 45 minutes at room temperature with agitation, followed by 3 washings. Hundred microliters of conjugate was added to each well and incubated for 30 minutes at room temperature with agitation and washed 3 times. Hundred microliters of tetramethylbenzidine substrate was added to each well and incubated for 15 minutes at room temperature with agitation. Fifty microliters of stop reagent was added to each well, and absorbance was determined at 450 nm. Results were calculated using a standard curve.
NfL single molecule array of serum samples
Serum NfL of patients with CIS and MS was measured by single molecule array (SiMoA) technology as previously described.11 Blood samples collected simultaneously with lumbar spinal tab were spun at 2000g at room temperature for 10 minutes within 90 minutes after withdrawal and stored in polypropylene tubes at −80°C until batched analysis of NfL concentrations. Serum NfL was measured by SiMoA HD-1 (Quanterix) using the NF-Light Advantage Kit (Quanterix) according to the manufacturer's instructions. Samples were measured in duplicates, and the interassay coefficients of variation were 2% and 6% for 2 spiked control samples with determined mean concentrations of 259.9 and 12.8 pg/mL.
CHI3L1 ELISA of CSF samples
Concentrations of human CHI3L1 were measured in CSF supernatants from patients with CIS and MS using the R&D Systems Quantikine ELISA kit. Reagents were prepared according to the manufacturer's instructions and brought to room temperature. CSF supernatants were diluted at a ratio of 1:20. Fifty microliters of standard, control, or sample together with 100 μL of Assay Diluent RD 1–34 was added to each well and incubated for 2 hours at room temperature. Samples were washed 4 times with wash buffer to remove any unbound substances. Two hundred microliters of the enzyme-linked polyclonal antibody CHI3L1 conjugate was added to each well and again incubated for 2 hours at room temperature. After 4 more washing steps, 200 μL of substrate solution was added and incubated for 30 minutes at room temperature, protected from light. Before measuring, 50 μL of stop solution was added; optical density was determined using a microplate reader set to 450 nm. A standard curve was created, and results were calculated considering the dilution factor. Five samples had to be measured again at a later point at a higher dilution (1:100).
Statistics
To evaluate the incremental diagnostic value of pairs of biomarkers, we performed a 2-step procedure.
First, we performed a cluster analysis by grouping all possible combinations (always a pair) of variables to identify pairs with an area under the curve (AUC) > 0.5. Cumulative sums were estimated between 2 parameters by normalizing each parameter to the mean value before summation. Cumulative sums were built for the combination of CD20+/CD14+ ratio and serum NfL and for the combination of CD20+/CD14+ ratio and CSF NfL.
As a second step, we built the composite score by estimating the error for those combinations, which had survived the first step, and by assigning the weights based on the least error.12 The composite score represents a three-predictor combination model that includes CD20+/CD14+ ratio, CSF NfL, and serum NfL.
A classifier is a parameter with a suitable optimal threshold that is used in a classification algorithm. In this study, only binary classification is considered, e.g., classification between the 2 different cases termed “MRI-high” and “MRI-low”. The performance of a classifier is evaluated by 3 main metrics, namely specificity, sensitivity, and accuracy. Specificity indicates the ability of a classifier to detect negative cases. Sensitivity represents the ability of a classifier to detect the positive cases. Accuracy represents the overall performance of a classifier. It indicates the percentage of correctly classified positive and negative cases among the total number of cases.
 |
 |
 |
The entities in the above equations are: TN (true negatives), TP (true positives), FN (false negatives), FP (false positives), and T is the total number of data under test.
We used receiver operating characteristic (ROC) analysis for determining the 3 above-mentioned parameters. As ROC analysis is a linear classifier, we additionally used support vector machine (SVM) analysis with a nonlinear classifier13 to validate the linear classification results.
SVM is a powerful tool for nonlinear classification between 2 data sets.14 In short, the algorithm looks for an optimally separating threshold between the 2 data sets by maximizing the margin between classes' closest points. The points lying on the boundaries are called support vectors, and the middle of the margin is the optimal separating threshold. Here, we have used the polynomial function kernel for this projection because of its good performance as discussed in Cortes and Vapnik14 and used the grid search (min = 1; max = 10) to find the few optimal input parameters, namely C (type of classification algorithm; 1–1,000) and gamma (0.25). The selection was checked by 10-fold cross-validation by taking 75% of the data for training and 25% for testing.
This study represents a nonconfirmatory, exploratory data analysis. Statistical analysis was performed using Graph Pad Prism and SPSS. For data with a Gaussian distribution, mean, range, and SD were determined. Qualitative data were described with relative frequencies. For data with a non-Gaussian distribution, median and percentiles were estimated. Mann-Whitney U tests were used for comparison of 2 groups. Kruskal-Wallis one-way analysis of variance was used for comparison of more than 2 groups.
Data availability
The raw data used in preparation of the figures and tables will be shared in anonymized format by request of a qualified investigator to the corresponding author for purposes of replicating procedures and results.
Results
CD20+/CD14+ cell ratio and OCBs in the CSF distinguish patients with CIS/MS from patients with NIND
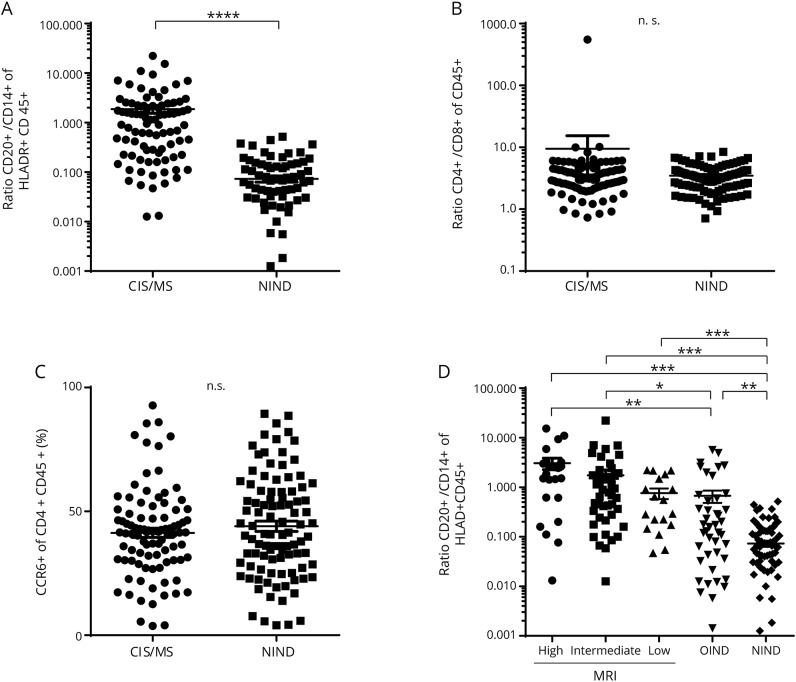
First, we characterized our cohort regarding the cellular composition of the CSF focusing on potential discriminative biomarkers. CD20+/CD14+ ratios were significantly larger in patients with CIS/MS compared with patients with NIND (p < 0.0001) (figure 2A), whereas no difference was observed in the CD4+/CD8+ T-cell ratios (figure 2B). CCR6 has been proposed as a marker preferentially expressed on Th17 cells.15 However, there was no significant difference in CCR6 expression of the CD4+CD45+ cells between the 2 groups (figure 2C). As expected, a higher proportion of positive OCBs and increased cell counts were observed in patients with CIS/RRMS in comparison to patients with NIND (p < 0.0001) (table 1).
Figure 2. Comparison of CSF leukocyte subsets between patient groups.
Comparison of the (A) CSF CD20+/CD14+ ratio, (B) CD4+/CD8+ ratio, and (C) percentage of CCR6+ CD4+ T cells between patients with RRMS/CIS and patients with NIND. For better visualization, (A) and (B) are presented logarithmically. Statistical significance was determined using the Mann-Whitney U test. (D) Comparison of CSF CD20+/CD14+ ratio between MRI subgroups and patients with OIND and NIND was performed using Kruskal-Wallis one-way ANOVA. Dot plots show mean ± SEM. *p < 0.05, **p < 0.01, ***p < 0.001, ****p < 0.0001. ANOVA = analysis of variance; CCR6 = C-C chemokine receptor type 6; CIS = clinically isolated syndrome; n.s. = not significant; NIND = noninflammatory neurologic disorder; OIND = other inflammatory neurologic diseases; RRMS = relapsing-remitting MS.
We next divided our patients with CIS and RRMS into 3 nonoverlapping groups based on MRI-defined severity (table e-1, links.lww.com/NXI/A128). CD20+/CD14+ ratios were significantly larger in the MRI-high and the MRI-int groups compared with either the OIND or the NIND group (figure 2D). Furthermore, the MRI-low group and the OIND group also demonstrated larger CD20+/CD14+ ratios than the NIND group.
No differences between groups could be observed in the CD4+/CD8+ ratio or in the CCR6+ proportion of the CD4+CD45+ subpopulation (data not shown).
CSF CD20+/CD14+ ratios and CSF/serum NfL levels correlate with extreme MRI phenotypes
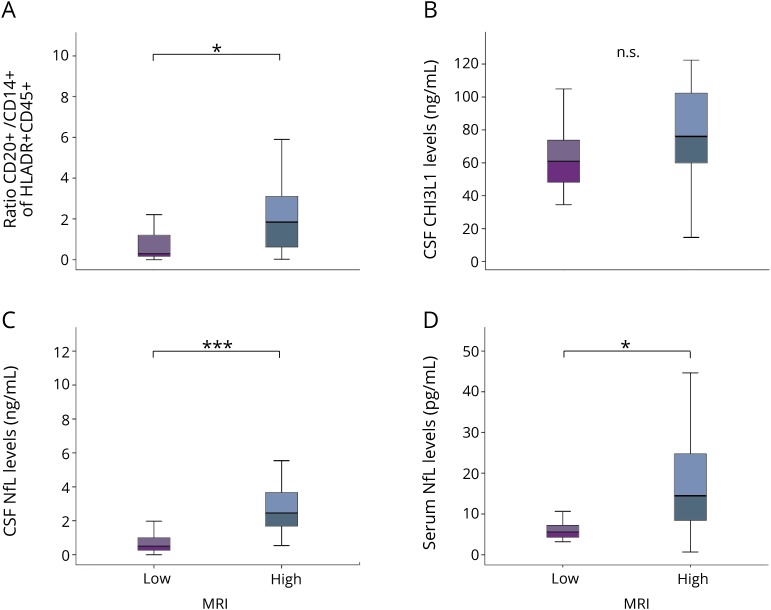
We next addressed the correlation between MRI phenotype and CSF/serum biomarkers in further detail. The MRI-high group showed significantly higher CD20+/CD14+ ratios in the CSF and higher NfL levels in both CSF and serum compared to the MRI-low group (figures 3, A, C, and D). As expected, NfL levels in CSF and serum were highly correlated in our cohort (R2 = 0.81, p < 0.0001). No relevant difference in CSF CHI3L1 levels was seen between the groups (figure 3B).
Figure 3. Association of CSF and serum parameter with MRI-based severity groups.
We compared (A) the CSF CD20+/CD14+ ratio, (B) CSF CHI3L1 levels, (C) CSF NfL levels, and (D) serum NfL levels according to MRI-based disease severity. Statistical analysis was performed using the Mann-Whitney U test. Box plots indicate median and IQR, with whiskers extending 1.5 times the IQR. *p < 0.05, ***p < 0.001. CHI3L1 = chitinase-3-like protein 1; IQR = interquartile range; n.s. = not significant; NfL = neurofilament light chain.
Similarly, in univariate regression analysis, CSF CD20+/CD14+ ratios and CSF/serum NfL levels were significantly associated with MRI-defined severity groups (table e-2, links.lww.com/NXI/A128), whereas no significant association was observed for CSF CHI3L1 levels, OCBs, sex, and age.
Of note, regression analysis including the use of corticosteroids more than 60 days before sample collection and biomarkers (CSF CD20+/CD14+ ratio, CSF/serum NfL, and CSF CHI3L1 levels) did not reveal significant effects (t < 2.0; p > 0.05) of steroids on any of the assessed biomarkers.
To evaluate whether differences in biomarker signatures between extreme MRI phenotypes are mainly related to presence/absence of CEL, we performed SVM analyses by taking into account the CEL as the classification factor. The parameters CSF NfL (78% accuracy) and CSF CHI3L1 (66% accuracy) showed distinction between the 2 groups, whereas the serum levels of NFL and CSF CD20/CD14 ratio had an accuracy <50%.
Focusing on patients with tumefactive lesions, we could not observe a distinct pattern of biomarker characteristics compared with patients in MRI-high group without tumefactive lesions.
Combining CSF CD20+/CD14+ and CSF/serum NfL improves biomarker accuracy
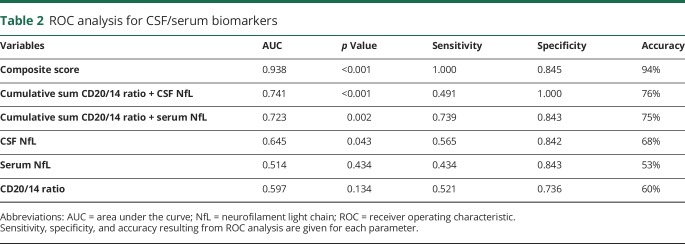
The predictive sensitivity, specificity, and accuracy of each CSF/serum biomarker obtained via ROC analysis are summarized in table 2. CSF NfL levels demonstrated the highest individual biomarker accuracy with an AUC that was higher (0.645) than for the CSF CD20+/CD14+ ratio (AUC 0.597) or for serum NfL levels (AUC 0.514).
Table 2.
ROC analysis for CSF/serum biomarkers
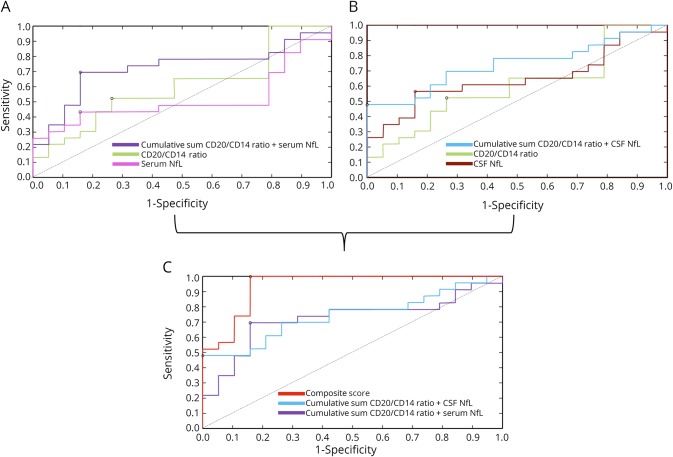
To evaluate the incremental diagnostic value of pairs of biomarkers, cumulative sums were estimated between 2 parameters by normalizing each parameter to the mean value before summation. The cumulative sum of the CD20+/CD14+ ratio and serum NfL improved the accuracy (75%) and increased the AUC to 0.723 (figure 4A). Likewise, the cumulative sum of the CD20+/CD14+ ratio and CSF NfL also showed an increased accuracy (76%) and AUC (0.741) (figure 4B).
Figure 4. ROC curves for each biomarker and their combinations.
(A) ROC curves generated for CSF CD20/CD14+ ratios and serum NfL levels and the cumulative sum of these 2 biomarkers. (B) ROC curves generated for CSF CD20/CD14+ ratios and CSF NfL levels and the cumulative sum of these 2 biomarkers. (C) ROC curves generated for the cumulative sums (CD20+/CD14+ ratio + serum NfL and CD20+/CD14+ ratio + CSF NfL) and the derived composite score. The optimal cutoff values for each curve based on the Youden index are indicated (black circles for each ROC curve). The diagonal dividing the ROC space represents the random event. NfL = neurofilament light chain; ROC = receiver operating characteristic.
Next, a composite score was modeled by estimating the error for these 2 cumulative sums and assigning the weights based on the least error.12 The composite score represents a 3-predictor combination model that includes CD20+/CD14+ ratio, CSF NfL, and serum NfL. The composite score best distinguished MRI severity with an accuracy of 94% and an AUC of 0.938 (figure 4C).
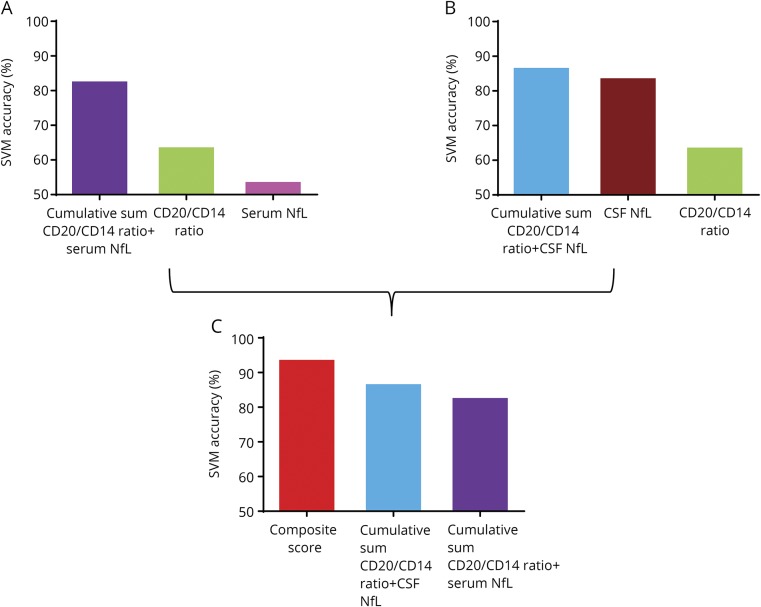
These linear classification results were additionally validated by SVM analysis in which the form of the threshold separating groups does not need to be linear. We applied SVM algorithms built on a training data set to an independent test data set. The analysis confirmed that the SVM accuracy of the 2 cumulative sums (CD20+/CD14+ ratio plus serum NfL and CD20+/CD14+ ratio plus CSF NfL) and the composite score outperforms individual biomarkers (figure 5). Accordingly, the estimation of odds ratios showed additive interaction of the composite score in comparison to the cumulative scores (figure e-1, links.lww.com/NXI/A128).
Figure 5. SVM analysis for each biomarker and their combinations.
(A) Bar diagram represents SVM accuracy of CSF CD20/CD14+ ratios and serum NfL levels and the cumulative sum of these 2 biomarkers as a measure of biomarker performance. (B) Bar diagram represents SVM accuracy of CSF CD20/CD14+ ratios and CSF NfL levels and the cumulative sum of these 2 biomarkers. (C) Bar diagram represents SVM accuracy of the cumulative sums (CD20+/CD14+ ratio + serum NfL and CD20+/CD14+ ratio + CSF NfL) and the derived composite score. NfL = neurofilament light chain; SVM = support vector machine.
Discussion
The identification of biomarkers that enable personalized treatment decisions has been an unmet need in MS for many years. Particularly at the time point of diagnosis, it is of great importance to distinguish patients with mild disease course from those who need aggressive immunotherapy to prevent future disability. Histopathologic studies provided strong evidence for the heterogeneity of MS pathogenesis in which there is growing recognition for B-cell contribution in neuroimmunologic activity resulting in neuronal injury early on.16,17 Therefore, our study aimed to investigate the value of combined neuronal and B-cell–related biomarkers in patients with CIS and early RRMS. Individual biomarkers and combinations of the same biomarkers were evaluated in relation to MRI-derived severity groups, given its availability and based on recent data from a large longitudinal cohort study suggesting a high number (≥10) of lesions at baseline MRI to be a high-impact prognostic factor.18 The binary analysis between MRI-high and MRI-low was chosen because we only expected to identify specific signatures in the extreme groups. We could demonstrate that biomarkers related to B cells (CSF CD20+/CD14+ cell ratio) and neuroaxonal damage (CSF/serum NfL) are both associated with extreme phenotypes of MRI severity and that their combination significantly improves the accuracy.
The most frequently used CSF biomarker in the diagnosis of MS is the presence of OCBs. Our study reflects the importance of OCBs for MS diagnosis,19–21 as their presence discriminates patients with CIS and early MS from patients with NIND. However, although OCBs demonstrate very good sensitivity for MS, they lack specificity, and as a binary parameter, they are unsuitable for determining individual and graded risk of disease severity.
Supporting recent findings,22,23 we could exclude that CSF levels of CHI3L1 are a significant biomarker for distinction of MRI severity, as there was no difference between patients with high or low MRI activity.
In accordance with previous studies,24–28 we found NfL levels in CSF and serum to be significantly elevated in patients with high T2 lesion load and gadolinium-enhancing lesions at the time of CSF/serum withdrawal. This does not only emphasize that neuroaxonal damage already occurs in CIS and early RRMS but also indicates that patients with high CSF NfL levels at the time point of diagnosis are at higher risk to develop a severe disease course. This is supported by earlier findings in patients with radiologically isolated syndrome (RIS), which showed that patients with high CSF NfL levels converted significantly more often from RIS to CIS or MS than those with low levels.22
In a search for the presence of a comparably sensitive, but potentially more specific biomarker than OCBs, we used flow cytometry to assess the prevalence of immune cell subsets in CSF. Thereby, we observed a significant correlation between CSF CD20+/CD14+ ratios and extreme phenotypes of MRI severity. The accumulation of B cells, which are virtually absent in CSF samples of healthy subjects, has been highlighted in previous reports from our group and others.2,3,29–31 Cepok et al. suggested the existence of different MS subtypes defined by the ratio of B cells to monocytes for the first time and observed a correlation of the B-cell/monocyte ratio with disease progression. In an earlier study, our group identified the CSF CD20+/CD14+ ratio as an eligible biomarker for discriminating between patients with CIS or MS and healthy controls and showed a correlation between CD20+/CD14+ ratios and T2 lesion progression and conversion from CIS to MS.3
The current study is unique in applying advanced statistical methods for testing different CSF/serum biomarker combinations for superiority over individual biomarkers. A systematic incremental combination of biomarkers in cumulative sums and a composite score allowed for a direct comparison of performance of single biomarker models with more complex models. There was a numerical gain of up to 29.3% in AUC from the best individual biomarker model (CSF NfL) to the best 3-predictor combination model (composite score) that included the CSF CD20+/CD14+ cell ratio and NfL levels in both CSF and serum. Furthermore, even the 2-predictor combination models (cumulative sums of the CSF CD20+/CD14+ cell ratio and serum NFL or CSF NfL) showed a gain of 7.8%, resp. 9.6% in AUC over CSF NfL alone. Although the current study lacks cross-sectional and longitudinal clinical data for further analysis and disease onset was categorized based on a single MRI assessment, our findings suggest the superiority of the combination of biomarkers related to intrathecal B-cell accumulation and neuronal damage in a more complex multipredictor model over an economic 1-predictor model of an individual biomarker, thereby taking into account different aspects of MS pathophysiology. External validation in clinically and radiologically well-defined longitudinal cohorts is necessary to assess the long-term implications of our multipredictor model.
In summary, our findings indicate that the combination of the CSF CD20+/CD14+ ratio and NfL levels in CSF and/or serum dissects benign from aggressive onset of CIS and early MS defined by objective MRI parameters. This could contribute to more personalized treatment decisions in immunotherapies by identifying patients at risk of rapid disease progression.
Acknowledgment
The authors thank Cheryl Ernest for proofreading. M. Friedrich performed her MD thesis on the topic of the present study.
Glossary
- AUC
area under the curve
- CCR6
C-C chemokine receptor type 6
- CHI3L1
chitinase-3-like protein 1
- CIS
clinically isolated syndrome
- FACS
fluorescence-activated cell sorting
- NfL
neurofilament light chain
- NIND
noninflammatory neurologic disorder
- OCB
oligoclonal band
- OIND
other inflammatory neurologic diseases
- RIS
radiologically isolated syndrome
- ROC
receiver operating characteristic
- RRMS
relapsing-remitting MS
- SiMoA
single molecule array
- SVM
support vector machine
Author contributions
S. Engel and M. Friedrich: acquisition and analysis of data and drafting significant proportion of the manuscript and figures. M. Muthuraman: analysis of data. F. Steffen: acquisition and analysis of data. A. Poplawski and S. Groppa: analysis of data. S. Bittner and F. Zipp: conception and design of the study and drafting significant proportion of the manuscript. F. Luessi: conception and design of the study, acquisition and analysis of data, and drafting significant proportion of the manuscript.
Study funding
This work was supported by the German Ministry for Education and Research (BMBF) German Competence Network Multiple Sclerosis (KKNMS) and the German Research Council (DFG, CRC-TR-128).
Disclosure
The authors report no disclosures relevant to the manuscript. Go to Neurology.org/NN for full disclosures.
References
- 1.Thompson AJ, Banwell BL, Barkhof F, et al. Diagnosis of multiple sclerosis: 2017 revisions of the McDonald criteria. Lancet Neurol 2018;17:162–173. [DOI] [PubMed] [Google Scholar]
- 2.Cepok S, Jacobsen M, Schock S, et al. Patterns of cerebrospinal fluid pathology correlate with disease progression in multiple sclerosis. Brain 2001;124:2169–2176. [DOI] [PubMed] [Google Scholar]
- 3.Nemecek A, Zimmermann H, Rübenthaler J, et al. Flow cytometric analysis of T cell/monocyte ratio in clinically isolated syndrome identifies patients at risk of rapid disease progression. Mult Scler 2016;22:483–493. [DOI] [PubMed] [Google Scholar]
- 4.Barro C, Benkert P, Disanto G, et al. Serum neurofilament as a predictor of disease worsening and brain and spinal cord atrophy in multiple sclerosis. Brain 2018;141:2382–2391. [DOI] [PubMed] [Google Scholar]
- 5.Disanto G, Barro C, Benkert P, et al. Serum Neurofilament light: a biomarker of neuronal damage in multiple sclerosis. Ann Neurol 2017;81:857–870. [DOI] [PMC free article] [PubMed] [Google Scholar]
- 6.Malmeström C, Axelsson M, Lycke J, Zetterberg H, Blennow K, Olsson B. CSF levels of YKL-40 are increased in MS and replaces with immunosuppressive treatment. J Neuroimmunol 2014;269:87–89. [DOI] [PubMed] [Google Scholar]
- 7.Hinsinger G, Galéotti N, Nabholz N, et al. Chitinase 3-like proteins as diagnostic and prognostic biomarkers of multiple sclerosis. Mult Scler 2015;21:1251–1261. [DOI] [PubMed] [Google Scholar]
- 8.Correale J, Fiol M. Chitinase effects on immune cell response in neuromyelitis optica and multiple sclerosis. Mult Scler 2011;17:521–531. [DOI] [PubMed] [Google Scholar]
- 9.Comabella M, Fernandez M, Martin R, et al. Cerebrospinal fluid chitinase 3-like 1 levels are associated with conversion to multiple sclerosis. Brain 2010;133(pt 4):1082–1093. [DOI] [PubMed] [Google Scholar]
- 10.Martínez MA, Olsson B, Bau L, et al. Glial and neuronal markers in cerebrospinal fluid predict progression in multiple sclerosis. Mult Scler 2015;21:550–561. [DOI] [PMC free article] [PubMed] [Google Scholar]
- 11.Siller N, Kuhle J, Muthuraman M, et al. Serum neurofilament light chain is a biomarker of acute and chronic neuronal damage in early multiple sclerosis. Mult Scler 2019;25:678–686. [DOI] [PubMed] [Google Scholar]
- 12.Schuberth F, Henseler J, Dijkstra TK. Partial least squares path modeling using ordinal categorical indicators. Qual Quant 2018;52:9–35. [DOI] [PMC free article] [PubMed] [Google Scholar]
- 13.Muthuraman M, Fleischer V, Kolber P, Luessi F, Zipp F, Groppa S. Structural brain network characteristics can differentiate CIS from early RRMS. Front Neurosci 2016;10:14. [DOI] [PMC free article] [PubMed] [Google Scholar]
- 14.Cortes C, Vapnik V. Support-vector networks. Machine Learn 1995;20:273–297. [Google Scholar]
- 15.Reboldi A, Coisne C, Baumjohann D, et al. C-C chemokine receptor 6-regulated entry of TH-17 cells into the CNS through the choroid plexus is required for the initiation of EAE. Nat Immunol 2009;10:514–523. [DOI] [PubMed] [Google Scholar]
- 16.Lucchinetti C, Brück W, Parisi J, Scheithauer B, Rodriguez M, Lassmann H. Heterogeneity of multiple sclerosis lesions: implications for the pathogenesis of demyelination. Ann Neurol 2000;47:707–717. [DOI] [PubMed] [Google Scholar]
- 17.Metz I, Weigand SD, Popescu BF, et al. Pathologic heterogeneity persists in early active multiple sclerosis lesions. Ann Neurol 2014;75:728–738. [DOI] [PMC free article] [PubMed] [Google Scholar]
- 18.Tintore M, Rovira À, Río J, et al. Defining high, medium and low impact prognostic factors for developing multiple sclerosis. Brain 2015;138(pt 7):1863–1874. [DOI] [PubMed] [Google Scholar]
- 19.Siritho S, Freedman MS. The prognostic significance of cerebrospinal fluid in multiple sclerosis. J Neurol Sci 2009;279:21–25. [DOI] [PubMed] [Google Scholar]
- 20.Awad A, Hemmer B, Hartung HP, Kieseier B, Bennett JL, Stuve O. Analyses of cerebrospinal fluid in the diagnosis and monitoring of multiple sclerosis. J Neuroimmunol 2010;219:1–7. [DOI] [PubMed] [Google Scholar]
- 21.Joseph FG, Hirst CL, Pickersgill TP, Ben-Shlomo Y, Robertson NP, Scolding NJ. CSF oligoclonal band status informs prognosis in multiple sclerosis: a case control study of 100 patients. J Neurol Neurosurg Psychiatry 2009;80:292–296. [DOI] [PubMed] [Google Scholar]
- 22.Matute-Blanch C, Villar LM, Alvarez-Cermeno JC, et al. Neurofilament light chain and oligoclonal bands are prognostic biomarkers in radiologically isolated syndrome. Brain 2018;141:1085–1093. [DOI] [PubMed] [Google Scholar]
- 23.Thouvenot E, Hinsinger G, Demattei C, et al. Cerebrospinal fluid chitinase-3-like protein 1 level is not an independent predictive factor for the risk of clinical conversion in radiologically isolated syndrome. Mult Scler 2019;25:669–677. [DOI] [PubMed] [Google Scholar]
- 24.Teunissen CE, Khalil M. Neurofilaments as biomarkers in multiple sclerosis. Mult Scler 2012;18:552–556. [DOI] [PubMed] [Google Scholar]
- 25.Villar LM, Picón C, Costa-Frossard L, et al. Cerebrospinal fluid immunological biomarkers associated with axonal damage in multiple sclerosis. Eur J Neurol 2015;22:1169–1175. [DOI] [PubMed] [Google Scholar]
- 26.Kuhle J, Malmeström C, Axelsson M, et al. Neurofilament light and heavy subunits compared as therapeutic biomarkers in multiple sclerosis. Acta Neurol Scand 2013;128:e33–e36. [DOI] [PubMed] [Google Scholar]
- 27.Hakansson I, Tisell A, Cassel P, et al. Neurofilament light chain in cerebrospinal fluid and prediction of disease activity in clinically isolated syndrome and relapsing-remitting multiple sclerosis. Eur J Neurol 2017;24:703–712. [DOI] [PubMed] [Google Scholar]
- 28.Novakova L, Axelsson M, Khademi M, et al. Cerebrospinal fluid biomarkers as a measure of disease activity and treatment efficacy in relapsing-remitting multiple sclerosis. J Neurochem 2017;141:296–304. [DOI] [PubMed] [Google Scholar]
- 29.Han S, Lin YC, Wu T, et al. Comprehensive immunophenotyping of cerebrospinal fluid cells in patients with neuroimmunological diseases. J Immunol 2014;192:2551–2563. [DOI] [PMC free article] [PubMed] [Google Scholar]
- 30.Kuenz B, Lutterotti A, Ehling R, et al. Cerebrospinal fluid B cells correlate with early brain inflammation in multiple sclerosis. PLoS One 2008;3:e2559. [DOI] [PMC free article] [PubMed] [Google Scholar]
- 31.Cepok S, Rosche B, Grummel V, et al. Short-lived plasma blasts are the main B cell effector subset during the course of multiple sclerosis. Brain 2005;128(pt 7):1667–1676. [DOI] [PubMed] [Google Scholar]
Associated Data
This section collects any data citations, data availability statements, or supplementary materials included in this article.
Data Availability Statement
The raw data used in preparation of the figures and tables will be shared in anonymized format by request of a qualified investigator to the corresponding author for purposes of replicating procedures and results.


