

Abstract
Early and progressive colonization of the healthy brain is one hallmark of diffuse gliomas, including glioblastomas. We recently discovered ultralong (>10 to hundreds of microns) membrane protrusions [tumor microtubes (TMs)] extended by glioma cells. TMs have been associated with the capacity of glioma cells to effectively invade the brain and proliferate. Moreover, TMs are also used by some tumor cells to interconnect to one large, resistant multicellular network. Here, we performed a correlative gene-expression microarray and in vivo imaging analysis, and identified novel molecular candidates for TM formation and function. Interestingly, these genes were previously linked to normal CNS development. One of the genes scoring highest in tests related to the outgrowth of TMs was tweety-homolog 1 (TTYH1), which was highly expressed in a fraction of TMs in mice and patients. Ttyh1 was confirmed to be a potent regulator of normal TM morphology and of TM-mediated tumor-cell invasion and proliferation. Glioma cells with one or two TMs were mainly responsible for effective brain colonization, and Ttyh1 downregulation particularly affected this cellular subtype, resulting in reduced tumor progression and prolonged survival of mice. The remaining Ttyh1-deficient tumor cells, however, had more interconnecting TMs, which were associated with increased radioresistance in those small tumors. These findings imply a cellular and molecular heterogeneity in gliomas regarding formation and function of distinct TM subtypes, with multiple parallels to neuronal development, and suggest that Ttyh1 might be a promising target to specifically reduce TM-associated brain colonization by glioma cells in patients.
SIGNIFICANCE STATEMENT In this report, we identify tweety-homolog 1 (Ttyh1), a membrane protein linked to neuronal development, as a potent driver of tumor microtube (TM)-mediated brain colonization by glioma cells. Targeting of Ttyh1 effectively inhibited the formation of invasive TMs and glioma growth, but increased network formation by intercellular TMs, suggesting a functional and molecular heterogeneity of the recently discovered TMs with potential implications for future TM-targeting strategies.
Keywords: glioblastoma, glioma, invasion, migration, Ttyh1, tumor microtubes
Introduction
Diffuse astrocytic brain tumors, with glioblastoma being the most common and most aggressive form, remain incurable neoplasms, ultimately leading to patient death. Current standard therapies include surgery, chemotherapy, and radiotherapy (Weller et al., 2015). A main characteristic of malignant gliomas, and one of the main reasons for their inevitable recurrence, is their diffuse infiltration of the brain. This infiltration is still poorly understood, but shares features with the migration of immature neurons during CNS development and of nonmalignant CNS stem cells during damage repair (Cuddapah et al., 2014). As a consequence, single glioma cells can even be found in areas far away from the main tumor, including the contralateral brain hemisphere (Sahm et al., 2012). This extremely diffuse growth pattern makes it impossible to apply radiation doses sufficient to eradicate the tumor cells without severely damaging the brain (Claes et al., 2007; Combs et al., 2016), or to achieve tumor-free resection margins, thus leading to recurrence, often at the margin of resection (Hamard et al., 2016).
The recent discovery of thin and very long membrane protrusions of glioma cells [up to hundreds of micrometers; named tumor microtubes (TMs)] has broadened our understanding of how tumor cells invade into the brain (Osswald et al., 2015). Glioma cells use these TMs to scan the brain, to invade it, and finally to colonize it. Glioma cells also use TMs to interconnect with a subpopulation of other tumor cells to form a dense multicellular network in which tumor cells are communicating with each other. At the leading edges of invasion in vivo, TMs showed morphological features of axonal growth cones (Lowery and Van Vactor, 2009; Osswald et al., 2015), indicating that the same (neurodevelopmental) pathways might be involved in TM formation.
In the previous study, a remarkable heterogeneity of glioma cells with respect to TM formation was observed: not all glioma cells formed TMs, and only a fraction of TM-positive cells used their TMs to interconnect with other tumor cells (Osswald et al., 2015). Of note, only the TM-devoid and unconnected glioma cells died in relevant numbers after radiotherapy. Together, these findings strongly suggested that TMs play a role in tumor progression and resistance in gliomas; however, their critical molecular determinants remained largely unknown, and it is not known whether different subclasses of TMs exist.
Thus, in this study we aimed to identify novel factors driving TM formation and function. To accomplish this and to better understand the nature of TMs, their different biological functions, and how to potentially target them, we used a broad gene-expression screening approach. VGF (no acronym) and TTYH1 (tweety-homolog 1) were among the most promising candidates of the screen. Our results suggest an important role of Ttyh1, a membrane protein expressed during neuronal development (Halleran et al., 2015), and involved in neurite outgrowth (Stefaniuk et al., 2010), for TM-dependent astrocytoma cell invasion and proliferation, leading to efficient tumor progression in the brain.
Materials and Methods
Animals and surgical procedures.
Eight-to-10-week-old male NMRI nude mice (Charles River) were used for studying the growth of primary human brain tumor cell lines in vivo. Cranial window implantation was performed as described before (Osswald et al., 2015). Two weeks after cranial window implantation, 30,000 tumor cells suspended in PBS were injected cortically at a depth of 500 μm. For survival and MRI studies, 50,000 cells [both Ttyh1-knockdown and adequate shRNA control glioblastoma multiforme stem cells (GBMSCs)] were injected, as part of a larger experimental approach where multiple gene knockdowns were investigated. Mice were scored clinically and rapidly killed if they showed neurological symptoms or a weight loss of >20%. For irradiation experiments, tumors were irradiated with 7 Gy on 3 consecutive days as described previously (Osswald et al., 2015) at day 57 (±8). All animal procedures were performed in accordance with the institutional laboratory animal research guidelines after approval of the Regierungspräsidium Karlsruhe, Germany.
MRI studies.
MRI images were obtained at day 72 (S24 shControl) and day 75 (S24 shTtyh1) after tumor-cell implantation on a 9.4 T horizontal bore MR scanner (BioSpec 94/20 USR, Bruker BioSpin) with a four-channel phased-array surface coil. To determine the tumor volume, a T2-weighted rapid acquisition with refocused echoes sequence was used.
In vivo multiphoton laser scanning microscopy.
Multiphoton laser scanning microscopy (MPLSM) images were acquired using a Zeiss 7MP microscope (Zeiss) as described previously (Osswald et al., 2015). In short, a Coherent Chameleon UltraII laser (Coherent) was used to excite the fluorophores. A band-pass 500–550 and 575–610 nm filter and the following wavelengths were used: 850 nm (GFP, TRITC-dextran) and 950 nm (tdTomato). Z intervals of 3 μm and gains between 620 and 750 were used. Laser power was tuned as low as possible to avoid phototoxicity. For in vivo imaging, mice were narcotized with isoflurane (in 100% O2). Mice were fixed using an implanted custom-made titanium ring to ensure a stable and painless fixation during the repetitive imaging procedures. High-molecular TRITC-dextran (500 kDa; 52194, Sigma-Aldrich; 10 μg ml−1) was injected in the tail vein for angiography. Superficial angiograms made it easier to locate the particular regions during repetitive imaging time points, and the architecture of the vasculature helped identify the same cells over a long period of time. During the imaging procedure, body temperature was kept constant using a rectal thermometer and a heating pad.
Cell lines and cell culture.
Human primary glioblastoma cell lines (GBMSCs: S24, T269, T325, T1) were cultivated in DMEM-F12 medium (31330-038, Invitrogen) under serum-free nonadherent conditions, including B27 supplement (12587-010, Invitrogen), 5 μg ml−1 insulin (I9278, Sigma-Aldrich), 5 μg ml−1 heparin (H4784, Sigma-Aldrich), 20 μg ml−1 epidermal growth factor (rhEGF; 236-EG, R&D Systems), and 20 μg ml−1 basic fibroblast growth factor (bFGF; PHG0021, Thermo Fisher Scientific). For adherent conditions, S24 glioma cells were cultured in DMEM (D6429, Sigma-Aldrich) with 10% FBS (F7524, Sigma-Aldrich).
GBMSCs were stably transduced with lentiviral vectors to track the cells during in vivo MPLSM. Cytosolic RFP (tdTomato) expression was achieved by transduction with the LeGo-T2 vector (gift from A. Trumpp). Lentiviral knockdown of Ttyh1 [plKO.1-puro-CMV-TurboGFP-vector, Sigma-Aldrich; target sequence: TCAGACATCCTGAGCTATTAT (for knockdown in S24), GCTCTGACCACTAACACTCTT (for knockdown in T269), in addition to the two aforementioned sequences: CTTGGAGGAGACTCTGAATGT, CTCCAATCCAGACCCTTATGT, ATCGGTTTCTATGGCAACAGT (for knockdown in T1)] and VGF (target sequence: CCTTCCCGAAACCCACAAGTT) by shRNA technology was performed as described previously (Weiler et al., 2014). shRNA sequences were chosen from five different target sequences tested, according to their ability to produce a maximum reduction of protein expression while best preserving in vitro growth capabilities of the tumor cells. All five target sequences for Ttyh1 proved lethal in T1 GBSMCs. Control cells were transduced with appropriate control plKO.1-puro-CMV-TurboGFP_shnon-target-vector (SHC016, Sigma-Aldrich) lentiviral particles. For transduction, cells were incubated with lentiviral particles and 10 μg ml−1 polybrene (TR-1003-G, Merck Millipore) for 24 h.
Western blot analysis revealed a 95% knockdown for VGF and a 30% knockdown for Ttyh1 in the S24 GBMSC cell line, and a 96% knockdown for Ttyh1 in the T269 GBMSC cell line. All cells were regularly tested for mycoplasma infections and species controls were performed for authenticity.
Invasion assay.
For studying the invasion capacity of human GBMSCs in vitro, single GBMSC spheroids were seeded into a Collagen I matrix gel (Collagen I, A1048301, Thermo Fisher Scientific; MEM, 31095-029, Invitrogen; Fibronectin, F2006, Sigma-Aldrich) and the spreading of single GBMSCs was monitored by light microscopic images after 0 and 48 h. For quantification, the radial distance of glioma cells that invaded farthest in the full circumference of the spheroid (∼1 cell per 6°) was measured and expressed as difference to the mean radial distance of the spheroid at 0 h.
AlamarBlue viability and proliferation assay.
Cell viability and proliferation was compared using an AlamarBlue assay. One thousand cells were seeded in opaque 96-well plates and AlamarBlue Cell Viability Reagent (DAL1025, Thermo Fisher Scientific) was added directly to the cell suspension on days 0, 1, 3, and 5. Fluorescence intensity (excitation, 560 nm; emission, 590 nm) was measured using a SpectraMax M5e microplate reader (Molecular Devices) after 3 h of incubation at 37°C and 5% CO2. Metabolic activity (cell viability) was compared on day 0 and proliferation was assessed in the exponential growth phase (days 0–3; Rampersad, 2012).
Flow cytometry.
For detection of the proliferating growth fraction, S24 GBMSCs were stained for Ki67. Dead cells were labeled using a fixable Viability Dye eFluor780 (65-0865-14, eBioscience). Cells were then fixed and permeabilized (Intracellular Fixation & Permeabilization Buffer Set, 88-8824-00, eBioscience). The fixed cells were incubated with the eFluor450-labeled Ki67 antibody (48-5699, eBioscience) diluted in 1× Permeabilization Buffer (00-8333-56, eBioscience). After washing with 1× Permeabilization Buffer, cells were resuspended in FACS buffer (3% FBS, 2 mm EDTA in PBS).
For comparison of apoptosis in S24 shControl and shTtyh1 cells, cells were gently dissociated with Accutase (A6964, Sigma-Aldrich). The supernatant was removed and cells were resuspended in APC-Annexin V (640920, BioLegend) and propidium iodide (421301, BioLegend) diluted in Annexin binding buffer (422201, BioLegend).
Measurements were performed on a FACS Canto II (BD Biosciences) and data analysis was done using FlowJo software. The apoptotic cell population is characterized by Annexin V+/PI− and thereby separated from necrotic cells or cells with otherwise disturbed membrane integrity (e.g., due to shear forces during sample preparation), leading to intracellular binding of Annexin V (Annexin V+ and PI+; Pozarowski et al., 2004).
Western blot.
For Western blot, standard protocols were used. Total protein lysates were electrophoretically separated using a 10% SDS-PAGE. Gels were incubated with anti-Ttyh1 (HPA023617, Sigma-Aldrich) and anti-VGF (PA5-20523, Thermo Fisher Scientific) antibodies after blotting and blocking overnight at 4°C. Blots were incubated with HRP-linked donkey anti-rabbit secondary antibody (NA9340-1 ml, GE Healthcare) at room temperature for 1 h. As loading control, anti-GAPDH (LAH1064, Linaris) and donkey anti-goat IgG-HRP (sc-2020, Santa Cruz Biotechnology) antibodies were used. Protein expression levels were measured with ImageJ (National Institutes of Health, Bethesda, MD) after digitalization of Super RX-N films (Fujifilm).
Immunohistochemistry and immunocytochemistry.
For immunohistochemistry, mice with fully established brain tumors were cardially perfused with PBS, followed by 4.5% phosphate-buffered formaldehyde solution (Roti-Histofix 4.5%, 2213, Carl Roth). Brains were incubated in 30% sucrose solution overnight for cryoprotection and frozen afterward. Heat-induced epitope retrieval with 0.01 m citrate buffer, pH 6.0, was performed before immunohistochemical staining. For immunocytochemistry, cells were grown on coverslips for 3 d and fixed with 4.5% formaldehyde solution (Roti-Histofix 4.5%, 2213, Carl Roth) or acetone afterward. The following antibodies were used for the staining of 10 μm cryotome sections and immunocytochemistry: anti-nestin (ab6320, Abcam), anti-Ttyh1 (HPA023617, Sigma-Aldrich), anti-integrin α5 (ab6131, Abcam), anti-VGF (PA5-20523, Thermo Fisher Scientific), anti-Ki67 (ab15580, Abcam), anti-active caspase-3 (ab13847, Abcam). As secondary antibodies, goat anti-mouse IgG Alexa Fluor 488 conjugate (A-11029, Thermo Fisher Scientific) and goat anti-rabbit IgG Alexa Fluor 633 conjugate (A-21070, Thermo Fisher Scientific) were used. For demonstration of cellular subtypes in human IDH1-mutated astrocytoma specimen, human brain tumor specimens were fixed in 4% PFA and 100 μm sections were cut on a vibratome. Heat-induced antigen retrieval was performed with Tris-EDTA buffer. Free-floating sections were incubated with the primary antibody anti-IDH1 R132H (DIA H09, Dianova) for 24 h. A AF488-conjugated anti-mouse secondary antibody (A11029, Life Technologies) was used. Sudan Black solution was used for reduction of auto-fluorescence. For IDH1/Ttyh1 costainings of human astrocytoma specimen, 3 μm sections of paraffin-embedded tissue samples were deparafinized and heat-induced antigen retrieval was performed with Cell Conditioning Solution, pH 6.0 (CC2, #950-123, Ventana). Anti-IDH1 R132H (DIA H09, Dianova) and anti-Ttyh1 (HPA023617, Sigma-Aldrich) primary antibodies were used.
Tumor cells and their TMs were identified by coimmunofluorescence stainings against tumor-cell-specific antigens [isocitrate dehydrogenase (IDH)1 R132H mutation-specific antibody for human tumor specimen or anti-human nestin for patient-derived GBMSCs growing in mouse brains].
Confocal immunohistochemical and immunocytochemical images were acquired using a Leica TCS SP5 microscope.
Quantification of MPLSM imaging, confocal microscopy and MRI data.
In vivo MPLSM data were analyzed using Imaris (Bitplane) and ImageJ (National Institutes of Health, Bethesda, MD). For measurements of TM length, TMs were measured manually in the slice mode of Imaris. TMs were defined as cellular protrusions of a minimum length of 10 μm, a minimum thickness of 0.5 μm, and maximum thickness of 2.5 μm (Osswald et al., 2015, 2016, histological, in vivo microscopy, and ultrastructural data). For the measurements of the invasion distance, the radial distance of all invaded tumor cells from the borders of the tumor bulk were measured in Imaris slice mode. The invasion speed of different subgroups of GBMSCs in vivo was determined by following single tumor cells over three time points within 24 h on day 21 (+/−1) after tumor injection. Short intervals were essential to certainly identify individual cells during the time course. The individual invasion speed was then determined by measuring the covered three-dimensional distance of individual cells and the time between the two imaging timepoints. The distance of tumor cells from the tumor bulk (defined as an area with a radial width of 500 μm) was measured in a single-plane image. The number of TMs per cell, the connectivity, and cell numbers before and after radiation therapy were counted manually in the same regions at different time points. A cell was classified as connected if ≥1 of its TMs connected two tumor-cell bodies directly. To determine the portion of connected and unconnected cells, all cells in a region were classified 20 and 40 (±1) d after tumor implantation and absolute numbers were set in proportion. For absolute cell numbers before and after irradiation, cell numbers in the same region of a specific volume were counted manually at both time points. For the evaluation of differential effects on connected and unconnected tumor cells, the numbers of these subgroups in specific regions after and before irradiation were set in proportion. For the dissemination coefficient, the number of cells >1500 μm from the tumor-bulk center were set in proportion to the tumor-bulk area. For the measurement of tumor-cell area, single-plane tile scans of the whole tumor-bearing hemisphere were transferred into ImageJ. Manual thresholding was applied to achieve comparable cellular visibility. Background noise was reduced by removing outliers of a radius of 0.5 μm. Afterward the total area of all pixels in the green channel (GFP) was measured.
Confocal microscope datasets were imported in ImageJ (National Institutes of Health, Bethesda, MD) and positive (Ttyh1, Ki67, active caspase-3) cells or TMs were counted manually.
For the quantification of the tumor/brain area ratio in MRI images, the tumor and the whole-brain area were measured manually in the T2-weighted slide with the largest tumor expansion. For quantification of the midline shift, the highest orthogonal deviation of the anatomical midline structures from a line designating the midline was measured.
Image processing.
MPLSM data were acquired by Zeiss ZEN Software (Zeiss), which was also used for primary image calculation. Images were then transferred to Imaris (Bitplane) or ImageJ (National Institutes of Health) for analysis and processing. In the figures, single planes, maximum intensity projections, or 3D images are shown.
RNA microarray and ingenuity pathway analyses.
For RNA microarray analysis, cells were either cultured under serum-free nonadherent (stem-like) or adherent conditions (for details, see above) for 4 weeks. Biological triplicates were harvested and RNA was isolated using a RNeasy Mini kit (74104, Qiagen). RNA was eluted in a solution of Tris-EDTA buffer and water. The quality of total RNA was checked by gel analysis using the total RNA Nano chip assay on an Agilent 2100 Bioanalyzer (Agilent Technologies). Only samples with RNA index values >8.5 were selected for expression profiling. Illumina Human Sentrix-12 BeadChip arrays (Illumina) were prepared according to Illumina's recommended sample-labeling procedure based on the modified Eberwine protocol (Eberwine et al., 1992). Microarray scanning was done using an iScan array scanner.
Data extraction was done for all beads individually, and, for each Probe ID, bead outliers were removed when the absolute difference to the median was >2.5 times that of the median absolute deviation (2.5 Hampel's method). All remaining bead-level data points were then quantile normalized (Bolstad et al., 2003). For each gene symbol annotated on the chip, all nonoutlier beads for the Probe IDs for a given gene have been averaged (mean) to calculate expression values and were used to test for significance. As a measure of significance, the Student's t test was used on the bead values of the two groups of interest (stem-like and adherent culture conditions). In both cases Benjamini–Hochberg correction (Benjamini and Hochberg, 1995) was applied to the complete set of p values of all 31,427 gene symbols on the chip.
The entire list of genes differentially expressed between cells grown under nonadherent and adherent conditions generated as described above was put into Ingenuity Pathways Analysis (Qiagen), using a |fold change| >2.5 and false discovery rate-adjusted p value of <0.05 as inclusion criteria. Briefly, the software calculates whether there is a nonrandom overlap between these differentially expressed genes and manually curated biological functions (such as “cellular movement” or “neurotrophin signaling”). Furthermore, an activation z score is computed. This score takes into consideration the expression state of these differentially expressed genes and aims to predict the activity of these biological functions. If, for example, many genes known to activate a given pathway are overexpressed in one group, then this pathway is predicted to be more active in this group. To derive an activation score for function categories (summarizing related functions), we calculated a mean activation z score for all functions included in the respective category. In parallel, we generated a running sum statistic, which was increased by 1 when a function was activated (z > 0) and decreased by 1 when a function was inhibited (z < 0), and finally divided by the number of functions in a category. The category activation score was calculated as mean z score * |running sum|, to highlight homogeneously activated categories.
Statistical analysis.
The obtained quantitative data were transferred to the SigmaPlot Software (Systat Software) to test for statistical significance with appropriate tests. Datasets were tested for normality with a Shapiro–Wilk test. Statistical significance of normally distributed data was assessed by a two-sided Student's t test. Non-normally distributed data were assessed with a Mann–Whitney rank-sum test. For statistical analyses of datasets with >2 groups ANOVA or ANOVA on ranks with the appropriate post hoc tests (Tukey's for ANOVA; Tukey's, Student–Newman–Keuls and Dunn's for ANOVA on ranks) were performed. For Kaplan–Meier survival analysis, a log-rank test was performed. For the correlation between the Ttyh1 protein level and the dissemination coefficient, a linear regression analysis was performed. Results were considered statistically significant if the p value was <0.05. Quantitative MPLSM in vivo data are depicted as mean. Error bars show SDs (*p < 0.05, **p < 0.01, ***p < 0.001).
Results
A screen to discover new TM-relevant genes
To study the formation and functions of TMs, and to interrogate potential molecular drivers, primary glioblastoma cells from resected brain tumors were kept under nondifferentiating, nonadhering, stem-cell like conditions (GBMSCs) that allow the preservation of gene expression patterns and in vivo biology of the human tumor (Lee et al., 2006). Dynamic tumor growth in the mouse brain was followed using repetitive in vivo MPLSM as described previously (Osswald et al., 2015). This technique enables study of brain tumor growth and the cellular behavior of individual tumor cells over minutes, hours, days, and ultimately several months, deep in the brain of living mice (Osswald et al., 2015). As early as 2 weeks after implantation, GBMSCs typically extended multiple TMs in the live mouse brain, and were starting to invade it effectively (Fig. 1a). In contrast, cultivation of the same glioblastoma cells under nonstem-like, differentiating, serum-containing conditions for 4 weeks in vitro resulted in a strong impairment of TM formation after implantation into the mouse brain in vivo, accompanied by massively impaired tumor-cell invasion into the brain parenchyma (Fig. 1b–d). Remarkably, when followed for months by intravital microscopy, these TM-inhibitory and invasion-inhibitory effects of the differentiating in vitro growth conditions were reversible: during the course of ∼100 d of very slow in vivo growth, those gliomas progressively transformed into TM-proficient and invasive tumors (Fig. 1e,f). Considering these findings, we hypothesized that the differentiating in vitro cell culture conditions did not completely eradicate TM-relevant tumor-cell subpopulations, but transiently decreased the expression of TM-relevant and invasion-relevant genes in the broad tumor-cell population, which is in principle reversible when these cells grow later in the proper brain microenvironment. Thus, it was plausible to perform a gene-expression microarray analysis in which glioblastoma cells cultured under both conditions were compared. Ingenuity pathway analysis (Fig. 1g) and assessment of biological functions (Fig. 1h) revealed that pathways involved in cellular movement were most activated under stem-like conditions compared with differentiating, serum-containing conditions. Among the top three upregulated genes was GAP-43, the only factor known so far to drive TM formation and function (Osswald et al., 2015), which supported the potential of the screen to identify TM-relevant genes. The other two were VGF and TTYH1 (Table 1). These findings were confirmed on the protein level (Fig. 2a). All three genes have been previously associated with CNS (particularly neuronal) development (Goslin et al., 1988; Kumada et al., 2010; Thakker-Varia et al., 2014).
Figure 1.

TM formation is restricted to glioblastoma cells cultured under stem-like conditions, but can be rescued by the brain microenvironment. a, b, Glioma growing in the live mouse brain after implantation of S24 GBMSCs cultured under stem-like spheroid conditions (a; arrowheads indicate TMs of invasive cells) and under serum-containing, adherent conditions (b) (z = 180 μm; representative images 12 d after implantation). c, Distance of invaded tumor cells from the surface of the main tumor 14 d after implantation of S24 cells cultured under serum-containing (adherent) versus serum-free (GBMSC) conditions (20–115 cells in n = 3 mice per group; Mann–Whitney test). d, Quantification of TM length of S24 tumor cells cultured under adherent versus GBMSC conditions 14 d after implantation (20–52 TMs in n = 3 mice per group; Mann–Whitney test). e, Representative image of S24 glioma on day 65 (left) and 104 (right), after GBMSCs had been cultured under stem-like conditions (day 65: z = 105 μm; day 104: z = 165 μm). Arrowheads mark typical TMs. f, Representative image of S24 glioma on day 68 (left) and 101 (right), after GBMSCs were cultured under serum-containing conditions (day 68: z = 105 μm; day 101: z = 165 μm). This demonstrates that the cells progressively regain their ability to form morphologically intact TMs (arrowheads) resembling the TMs observed after cultivation under stem-like conditions. g, Heat map of biological functions from ingenuity pathway analysis (IPA) comparing the expression in GBMSCs cultured under stem-like versus serum-containing adherent conditions (RNA microarray data). h, IPA of microarray data from the comparison of GBMSCs cultivated under stem-like spheroid conditions versus serum-containing, adherent conditions showing the 10 most-activated categories. A high positive activation z score indicates an upregulation under stem-like conditions. a–f, Data obtained by in vivo MPLSM; a, b, e, f, 3D images. ***p < 0.001.
Table 1.
Differential gene expression under two cell-culture conditions that give rise to TM-proficient and TM-deficient tumors in mice
| Cell-culture condition | Position | Gene symbol | Fold change |
|---|---|---|---|
| A | 1. | GAP43 | 27.59 |
| 2. | VGF | 20.88 | |
| 3. | TTYH1 | 14.78 | |
| 4. | KCNF1 | 14.08 | |
| 5. | OLIG2 | 12.79 | |
| 6. | CA9 | 12.29 | |
| 7. | OLIG1 | 11.53 | |
| 8. | H19 | 10.79 | |
| 9. | FXYD6 | 10.07 | |
| 10. | HES5 | 9.51 | |
| 11. | NDUFA4L2 | 9.36 | |
| 12. | C18orf51 | 9.13 | |
| 13. | TEK | 9.05 | |
| 14. | C1orf61 | 8.32 | |
| 15. | C1orf115 | 8.05 | |
| 16. | GRIK1 | 8.05 | |
| 17. | HEPACAM | 8.05 | |
| 18. | FAM181B | 7.39 | |
| 19. | CDC20 | 7.06 | |
| 20. | ASCL1 | 6.57 | |
| B | 31,413. | INHBE | 0.05 |
| 31,414. | DBC1 | 0.05 | |
| 31,415. | GLIPR1 | 0.05 | |
| 31,416. | VIPR1 | 0.04 | |
| 31,417. | IFITM1 | 0.04 | |
| 31,418. | IFI27 | 0.04 | |
| 31,419. | RGS4 | 0.04 | |
| 31,420. | SLPI | 0.04 | |
| 31,421. | CCL2 | 0.04 | |
| 31,422. | GPNMB | 0.03 | |
| 31,423. | AKR1C3 | 0.03 | |
| 31,424. | ALDH3A1 | 0.03 | |
| 31,425. | PCP4 | 0.03 | |
| 31,426. | CXCL14 | 0.02 | |
| 31,427. | SRG1 | 0.02 |
Differentially expressed genes of primary glioblastoma cells cultured under two in vitro growth conditions. The 20 most upregulated (A) and 15 most downregulated (B) genes in a RNA microarray analysis comparing S24 GBMSCs cultured under nonadherent stem-like versus adherent growth conditions in vitro (see text for details; fold change of mean normalized data for every gene).
Figure 2.

VGF protein is associated with TMs, without an obvious impact on function. a, Western blot analysis of VGF and Ttyh1 protein expression levels of S24 and T1 GBMSCs cultured under serum-free, nonadherent conditions and serum-containing, adherent conditions for 7 d, demonstrating a downregulation on the protein level under adherent conditions (cropped gels). b, Maximum intensity projection images of immunohistochemical stainings of human nestin (green) and VGF (red) acquired by confocal microscopy (S24 GBMSC tumors). Arrowheads indicate VGF-positive TMs. c, Verification of shRNA knockdown of VGF in S24 GBMSC by Western blot analysis (95% reduction in protein level). d, In vivo 3D MPLSM images of S24 shControl and shVGF GBMSCs on day 40 (z = 45 μm), demonstrating no obvious phenotypical aberration and no apparent difference in tumor invasion and growth. Green, GBMSCs; blue, blood vessels.
Ttyh1 expression and tumor-cell heterogeneity
With earlier investigations suggesting that both VGF and Ttyh1 have functions in neurite outgrowth (Stefaniuk et al., 2010; Sakamoto et al., 2015), we chose to investigate whether these top scoring hits in the screen are involved in the outgrowth of TMs. Although VGF was expressed in GBMSCs (Fig. 2a) and was detectable in cell somata as well as in some TMs (Fig. 2b), marked reduction of its gene expression via shRNA (Fig. 2c) did not result in any differences in growth pattern of gliomas in the brain, including the formation of TMs (Fig. 2d). This apparent lack of functional relevance of VGF suggested proceeding to Ttyh1.
To reveal the subcellular compartments in which Ttyh1 is localized, we performed immunocytochemical stainings of GBMSCs, which demonstrated a localization of Ttyh1 as punctuate structures in the cell body, conforming with the localization observed in other cell types (Matthews et al., 2007; Wiernasz et al., 2014), and a concentration along the membrane of TM-like cellular protrusions, most prominent at their growth cone-like tips (Fig. 3a). When investigating Ttyh1 staining patterns in gliomas, we made an interesting discovery: the staining of tumor-cell TMs was highly heterogeneous, with a high fraction of Ttyh1-positive TMs in cells extending one or two TMs in mouse (Fig. 3b) and human brain tumors (Fig. 3c), and infrequent TM-positivity for Ttyh1 in tumor cells extending multiple (>4) TMs [with only 11.0 ± 1.80% (mean ± SEM) Ttyh1+ TMs; n = 4 mice; Fig. 3d–g]. Further analyses confirmed that both in human GBMSC lines growing to gliomas in mice (Fig. 3h) and in human gliomas (Fig. 3i), at least four different cell types were morphologically evident: tumor cells extending no TMs; one TM; two TMs; and multiple (>4) TMs. This striking cellular heterogeneity, and the indications for tumor cell subtype-specific Ttyh1 expression, suggested the need to further investigate the role of Tthy1 in the different biological functions associated with TMs in gliomas (Osswald et al., 2015).
Figure 3.

Ttyh1 protein is heterogeneously found in TMs. a, Maximum intensity projection images of immunocytochemical stainings of Ttyh1 (red) in S24 GFP cells (green) revealing Ttyh1 positivity in the cell body and a preferential concentration of Ttyh1 protein along the protrusion membrane (inset: scale bars, 5 μm) and at the growth cone-like tip of these TM-like structures (arrowheads; right, higher magnification of a tip). b, Maximum intensity projection images of an immunohistochemical double-staining of human nestin (green), which specifically labels patient-derived GBMSCs, including their TMs, and Ttyh1 (red) in a S24 GBMSC tumor, demonstrating a unipolar tumor cell (asterisk, cell body) and its Ttyh1-positive TM (arrowheads) within many Ttyh1-negative TMs (arrows) of other tumor cells. c, Immunohistochemical double-staining of the IDH1–R132H mutation (green) and Ttyh1 (red) in a human astrocytoma specimen. A Ttyh1-positive unipolar glioma cell and its TM (arrowhead) is shown. Blue, DAPI. d, Quantification of immunohistochemical stainings of S24 GBMSC tumors showing the fraction of cells with solely Ttyh1-positive TMs (n = 4 mice; Mann–Whitney test). e, Immunohistochemical staining of a S24 GBMSC tumor showing a multipolar tumor cell (asterisk, cell body) with both Ttyh1-positive (arrowheads) and Ttyh1-negative (arrows) TMs. f, Immunohistochemical staining (green, IDH1 R132H mutation; red, Ttyh1; blue, DAPI) demonstrating a multipolar (>4 TMs) tumor cell (asterisk) with Ttyh1-negative TMs in a human astrocytoma specimen. g, Fraction of multipolar cells with 0, 1–4, or >4 Ttyh1-positive TMs in S24 GBMSC tumors determined by immunohistochemistry (n = 4 mice; ANOVA on ranks). h, Representative in vivo 3D MPLSM images of cellular subtypes with zero, one, two, and >4 TMs (S24, T269, T1 GBMSCs). i, Demonstration of cellular subtypes in human astrocytomas (IDH1 R132H mutation-specific antibody). a–g, i, Confocal microscopy. **p < 0.01; ***p < 0.001.
Glioma cells with 1–2 TMs and high Ttyh1 expression are more invasive
To determine whether those glioma cells with 1–2 TMs (regularly Ttyh1-positive) show a different biological behavior compared with those bearing >4 TMs (mostly Ttyh1-negative), we used our in vivo two-photon microscopy technology and analyzed tumor regions imaged over a period up to 24 hours. Here, a significant difference was found with respect to in vivo invasion capacity in progressing gliomas: while tumor cells with 1–2 TMs were highly motile, using their TMs as leading structures for high-velocity infiltration of the brain, those with >4 TMs were mostly stationary (Movie 1, Fig. 4a). In line with this, we found a strong positive correlation of overall Ttyh1 expression and tumor-cell dissemination in vivo between different GBMSC lines (Fig. 4b,c).
Figure 4.

Ttyh1 expression correlates with invasiveness in gliomas. a, Invasion distance of cellular subtypes with 1–2 and >4 TMs (S24 GBMSCs) in 24 h measured by repetitive MPLSM in vivo (n = 3 mice, Mann–Whitney test). b, Western blot analysis of Ttyh1 protein levels in different GBMSCs (cropped gel). c, Left, Linear regression revealed a correlation between mean Ttyh1 protein level assessed with Western blot analysis and diffuse infiltration capacity of three different glioma-cell lines in vivo. The dissemination coefficient (mean cell number >1500 μm from the center of tumor bulk in relation to the tumor-bulk area) describes the degree of diffuse infiltration capacity of each GBMSC line (n = 3 mice per cell line). Right, Representative in vivo 3D MPLSM images of S24, T269, and T325 tumors demonstrating the different degrees of diffuse infiltration on day 39 (±5 d). a, c, Data obtained by in vivo MPLSM. ***p < 0.001.
Movie 1.
TM-associated tumor-cell heterogeneity and invasion capacity. a, Time series of three different unipolar (1 TM) or bipolar (2 TMs) S24 GBMSCs in vivo illustrating the fast invasion speed and dynamic adaptation of cell shape of these cellular subtypes; z dimensions: cell 1, 30 μm; cell 2, 21 μm; cell 3, 15 μm. Red, Cytoplasm; green, nuclei. b, Time series of four different multipolar (>4 TMs) S24 GBMSCs in vivo illustrating their mainly resident position over time; z dimensions: 21 μm. Red, Cytoplasm; green, nuclei. All data acquired by in vivo MPLSM. Time: [hh:mm].
Ttyh1 knockdown compromises invasive TMs
To investigate the impact of Ttyh1 expression on TM formation and the different aspects of glioma progression in more depth, we next performed shRNA-mediated knockdown of Ttyh1 in the three highly invasive and Ttyh1-expressing GBMSC cell lines S24, T269 (Fig. 5a), and T1. T1 GBMSCs did not survive the knockdown and died in vitro. In those cell lines that survived the Ttyh1 knockdown, overall tumor-cell viability in vitro was not significantly impaired compared with shControl-transduced cells (Fig. 5b–d).
Figure 5.

Ttyh1 knockdown alters TM phenotypes in vivo. a, Verification of shRNA knockdown of Ttyh1 in S24 (left) and T269 (right) GBMSCs by Western blot analysis (30% reduction in protein level in S24; 96% reduction in T269). b, AlamarBlue viability and proliferation assay of S24 shControl and shTtyh1 cells demonstrates that the metabolic activity/viability [as measured on day 0 (D0)], as well as the proliferation (exponential growth phase shown), is not significantly altered by the shRNA-mediated knockdown (n = 12 replicates for each shControl and shTtyh1; ANOVA on the ranks; mean ± SEM). c, d, Exemplary flow cytometry analyses of S24 shControl and shTtyh1 revealed no significant differences in the Ki67+ growth fraction (c; n = 3 replicates for shControl and shTtyh1 respectively; 2-sided t test; p = 0.066) or apoptosis rate (d; n = 3 replicates for shControl and shTtyh1 respectively; 2-tailed t test; p = 0.289). Red numbers indicate populations in percentage. e, f, Exemplary in vivo 3D MPLSM images of S24 shControl and shTtyh1 GBMSC TMs (e) as well as T269 shControl and shTtyh1 GBMSC TMs (f). Note that shTtyh1 cells show morphologically altered TMs with filament beading (arrowheads). g, Observations of filament beading by MPLSM in vivo itemized regarding cellular subpopulations (n = 6 mice, S24, day 20; n = 5 mice, T269, day 21 ± 2; Mann–Whitney tests). h, Exemplary in vivo MPLSM images of TM-rich multipolar tumor cells in S24 shControl and S24 shTtyh1 tumors showing no phenotypic changes in this cellular subtype. i, Relative fractions of GBMSCs with zero, one or two, and >4 TMs in S24 shControl versus shTtyh1 tumors (20–25 d after implantation; n = 3 mice per group; 2-tailed t tests). j, Absolute number of tumor cells per mm3 categorized regarding these cellular subtypes (n = 3 mice per group; ANOVA on ranks). k, Quantification of the fractions of TM-connected GBMSCs in the cellular subgroups with 1–2 TMs versus >4 TMs, demonstrating that most cells with >4 TMs are connected, whereas the cells with 1–2 TMs are mainly unconnected to other tumor cells in this glioma via their TMs (S24 shControl: day 20 ± 5; S24 shTtyh1: day 20; n = 4 mice per group; 1-way ANOVA). e–k: data obtained by in vivo MPLSM. *p < 0.05; ***p < 0.001.
In vivo, however, striking cellular changes due to the shTtyh1 knockdown could be observed, both in the S24 and T269 GBMSC lines: their TMs, which were the leading routes for invasion (invasive TMs), frequently showed morphological abnormalities resembling chains of beads (Fig. 5e,f). This phenomenon had been previously reported after silencing of Ttyh1 in hippocampal neurons in vitro (Stefaniuk et al., 2010). Filament beading was predominantly evident in the invasive subpopulation extending 1–2 TMs and only rarely found in cells with >4 TMs (Fig. 5g), whose morphology was largely unaltered by the Ttyh1 knockdown (Fig. 5h). Remarkably, we never observed filament beading (967 cells from n = 4 animals for S24; 667 cells from n = 5 animals in T269 tumors) in interconnecting TMs, neither in the unipolar/bipolar nor in the multipolar subpopulation.
Additionally, the Ttyh1 knockdown reduced the relative portion of the invasive glioma cells with 1 or 2 TMs, whereas the more stationary population with >4 TMs was relatively (Fig. 5i), but not absolutely (Fig. 5j), increased. This multipolar cell population (>4 TMs) formed particularly extensive TM-mediated cell–cell interconnections, which were preserved in shTtyh1 tumors (Fig. 5k). Collectively these results confirm that the invasive glioma-cell subpopulations with 1–2 TMs depends on proficient Ttyh1 expression, while Ttyh1 appears to be of minor importance for multipolar glioma cells and their cell–cell interconnecting TMs.
Ttyh1 knockdown reduces glioma-cell invasion
In light of all the findings reported so far that link Ttyh1 expression and TM-dependent glioma-cell invasion, we next wondered whether Ttyh1 knockdown would compromise tumor-cell invasiveness in vivo. For that we took advantage of the ability to track individual tumor cells over time in live tumors, allowing us to measure invasion independently from tumor-cell proliferation. These experiments confirmed that glioma cells in control tumors invaded the brain efficiently while dynamically extending TMs (Fig. 6a), but invasion was reduced to a minimum in the shTtyh1 GBMSCs (Fig. 6b): the analyses revealed a nearly fourfold reduction in average cell-soma invasion speed in the Ttyh1-knockdown cells (Fig. 6c).
Figure 6.
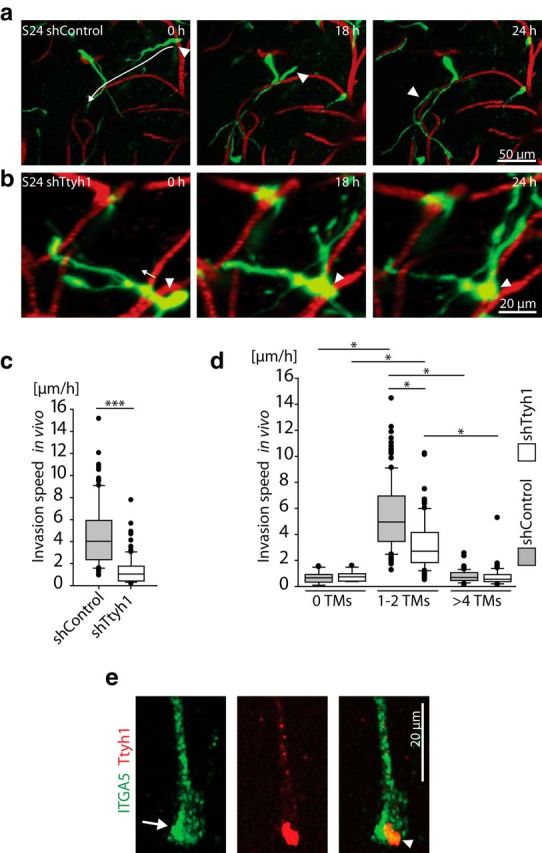
Ttyh1 deficiency slows glioma-cell invasion. a, b, Time series of 3D images of S24 shControl GBMSCs (a; z = 36 μm) and S24 shTtyh1 GBMSCs (b; z = 69 μm) reveal the impaired invasion capacity induced by Ttyh1 knockdown. Left, Arrows indicate the subsequent invasion route; arrowheads label the cell bodies of the invading GBMSCs (green). Red, blood vessels. c, Measurements of the invasion speed of single S24 shControl versus shTtyh1 GBMSCs in vivo measured by repetitive MPLSM over 24 h (128–150 cells from n = 3 mice per group; day 21 ± 1; Mann–Whitney test). d, Measurements of the invasion speed of S24 shControl versus shTtyh1 GBMSCs in vivo subcategorized regarding their number of TMs (13–126 cells from n = 3 mice per group; day 21 ± 1; ANOVA on ranks). e, 3D confocal microscopy image of an immunocytochemical staining of integrin-α5 (ITGA5; green) and Ttyh1 (red) in S24 cells (arrow, ITGA5 enrichment at the growth cone-like tip; arrowhead, colocalization of ITGA5 and Ttyh1 at the tip of the TM). a–d, Data obtained by in vivo MPLSM. *p < 0.05; ***p < 0.001.
To exclude the possibility that the depletion of the highly invasive subpopulation with 1–2 TMs (Fig. 5i,j) and the integration into a more densely woven multicellular network itself hinders glioma cell migration in the Ttyh1 knockdown cells, we analyzed the invasion speed of tumor-cell populations with no TMs versus one or two TMs versus >4 TMs separately. The Ttyh1 knockdown specifically reduced the invasion speed of the particularly mobile tumor-cell population extending 1–2 TMs (Fig. 6d). Together, this data indicates that the reduced invasion capacity of Ttyh1-knockdown cells is a combined effect of a proportional reduction of the particularly invasion-competent tumor-cell subpopulation with one or two TMs (Fig. 5i), and an additional migration deficit of the remaining cells of this subtype by interference with the formation of functional invasive TMs. As one potential proinvasive mechanism and in accordance with previous reports (Matthews et al., 2007), we found colocalization of Ttyh1 and integrin α5, a member of a family of transmembrane proteins involved in the formation of focal adhesions at the leading edge of invading cells (D'Abaco and Kaye, 2008) and in growth-cone migration (Robles and Gomez, 2006), most pronounced at the growth cone-like tip of GBMSCs (Fig. 6e).
Brain colonization is strongly reduced by Ttyh1 deficiency
Colonization of the brain by tumor cells depends both on invasion and proliferation. To gain further insights into the impact of Ttyh1 expression on these biological hallmarks of glioma progression, we performed an in vitro invasion assay, where the Ttyh1 knockdown led to a reduced colonization of a Collagen I matrix (Fig. 7a). Using in vivo MPLSM, we then investigated whether this inhibitory effect was also present in the complex extracellular matrix and microenvironment of the live brain. Here an even stronger effect was evident: whereas control tumors revealed marked tumor growth and diffuse colonization of the whole brain hemisphere with many cells having infiltrated farther than 1 mm from the main tumor (Fig. 7b), the growth of S24 GBMSC Ttyh1-knockdown tumors was circumscribed at the implantation site, with only few tumor cells invading the brain (Fig. 7c,d). In T269 GBMSCs, a highly invasive glioma-cell line showing a very diffuse growth pattern (Lemke et al., 2014), Ttyh1 shRNA knockdown led to a marked reduction of overall tumorigenicity in vivo, with only very few remnant tumor cells detectable in the brain parenchyma after many weeks (Fig. 7e–g).
Figure 7.
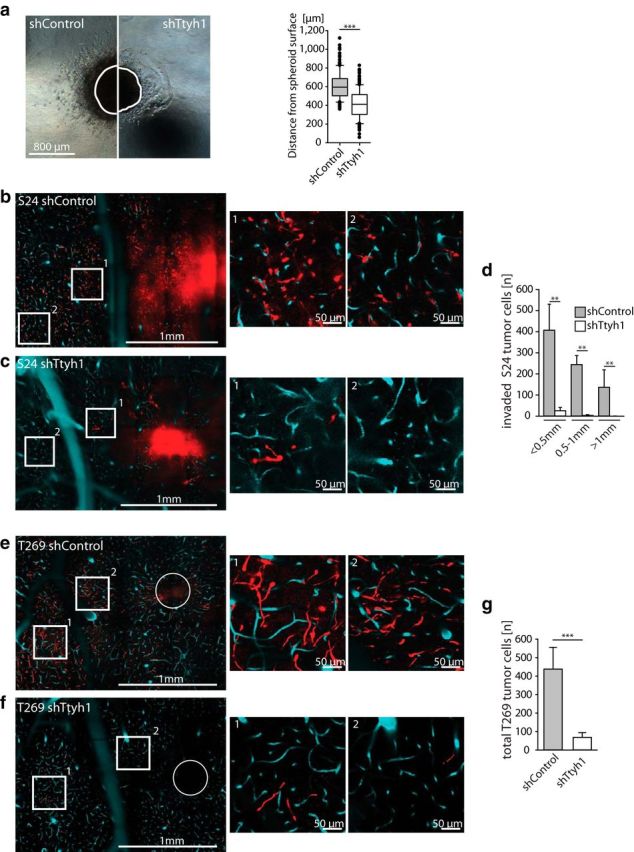
Brain colonization is strongly reduced by Ttyh1 deficiency. a, Spheroid invasion assay from S24 shControl versus shTtyh1 cells in a collagen matrix 48 h after seeding. The surface borders of the spheroids directly after seeding are marked as white lines (n = 3 spheroids per group; Mann–Whitney test). b, c, Representative single-plane images of S24 shControl (b) and shTtyh1 (c) tumors 20 d after implantation demonstrating the reduced brain colonization caused by the Ttyh1 knockdown; middle and right images show higher magnifications of the corresponding regions in the overview (left). Red, GBMSCs; turquoise, blood vessels; circle, tumor injection site. d, Corresponding quantification of invaded S24 tumor cells per range from the main tumor, which was defined as the area with a radius of 500 μm (n = 3 mice per group; Mann–Whitney tests). e, f, Equivalent representative single-plane images of T269 shControl (e) and shTtyh1 (f) tumors. Note that tumorigenicity is massively reduced in the highly diffuse infiltrating T269 cell line. g, Absolute number of tumor cells in T269 shControl versus shTtyh1 measured on a single-plane image of the whole hemisphere on day 20 (n = 3 mice per group; 2-tailed t test). b–g, Data obtained by in vivo MPLSM. **p < 0.01; ***p < 0.001.
In addition to the reduced infiltration of the brain parenchyma, the knockdown led to a reduced tumor-cell load (Fig. 8a). This was due to an anti-proliferative effect of the Ttyh1 knockdown in vivo (Fig. 8b), which was largely absent in vitro (Fig. 5b,c). There were no differences in the apoptotic cell fraction, indicating that glioma cells remained viable in vivo despite Ttyh1 knockdown (Fig. 8b).
Figure 8.

Ttyh1 deficiency reduces tumor growth and prolongs survival. a, Measurements of overall tumor-cell area in single-plane tile scan images of the whole tumor-bearing hemisphere on day 20 after tumor-cell implantation demonstrating a reduced tumor burden in Ttyh1-knockdown animals (n = 3 mice per group; Mann–Whitney tests, in vivo MPLSM). b, Quantification of immunohistochemical stainings of Ki67 and active caspase-3 in S24 shControl and shTtyh1 tumors (day 45; n = 3 mice per group; Mann–Whitney tests). c, 9.4 tesla T2 MRI images of S24 shControl (day 72) versus shTtyh1 tumors (day 75 after implantation), and corresponding quantification of tumor area/brain area ratio (n = 6 animals per group; 2-tailed t test). Green line, Tumor area. d, Kaplan–Meier survival plot of S24 shControl versus shTtyh1 tumor-bearing mice (n = 6 animals per group; log-rank test). **p < 0.01; ***p < 0.001.
We next analyzed gross tumor growth after >70 d by high-field MRI. The S24 model was chosen because of all three GBMSC lines tested, S24 GBMSCs were least affected by the Ttyh1 knockdown, with some preserved capacity to colonize the brain in vivo. A marked reduction of MRI tumor size by the Ttyh1 knockdown was evident, with minimal tumor-derived signal changes detectable, and a mean midline shift of only 0.08 (±0.07) mm (Fig. 8c). At the same time, control tumors were very large, extending over the whole hemisphere (Fig. 8c), which led to a significant mass effect with a mean midline shift of 1.35 (±0.16) mm (p < 0.001, two-tailed t test) and neurological symptoms. Importantly, inhibition of glioma progression by Ttyh1 downregulation significantly improved the clinical course of the disease, with median survival time massively prolonged (from 75 to 182 d; Fig. 8d). In summary, both anti-invasive and anti-proliferative effects of Ttyh1 deficiency contributed to decreased brain colonization.
A more interconnected tumor-cell network is more radioresistant
We finally aimed to clarify whether the Ttyh1 knockdown also influenced another crucial TM-mediated function: interconnection of single glioma cells to one large and resistant multicellular network. As the relative fraction of cells bearing multiple, morphologically unimpaired TMs was increased in the small Ttyh1-knockdown tumors of low cellular density (Fig. 5j), we investigated whether this leads to a more interconnected multicellular network. Indeed, anatomical cell–cell connectivity via TMs was increased in Ttyh1-knockdown tumors (Fig. 9a).
Figure 9.

TM-mediated tumor-cell interconnections and radioresistance. a, Ratio of TM-connected/non-TM-connected S24 shControl and shTtyh1 GBMSCs 20 and 40 d after implantation (n = 3 mice per group; Mann–Whitney tests). b, Left, Representative 3D MPLSM images of S24 shControl and shTtyh1 tumors before (Pre Rad) and 7 d after (Post Rad) irradiation (z = 51 μm). Right, Corresponding quantification shows absolute cell numbers in a volume of 276 * 103 μm3 before and 7 d after irradiation (n = 3 animals per group; ANOVA on ranks). c, Ratio of cell number 7 d after/before irradiation with respect to TM connectivity (n = 3 mice per group; ANOVA). a–c, Data obtained by in vivo MPLSM. *p < 0.05; **p < 0.01; ***p < 0.001.
Higher TM interconnectivity has been shown to lead to increased glioma-cell resistance against the cytotoxic effects of radiotherapy (Osswald et al., 2015). Accordingly, the sparse and invasion-deficient, but more densely interconnected, Ttyh1-knockdown gliomas were highly therapy-resistant when treated with radiotherapy, compared with control tumors (Fig. 9b). A closer analysis revealed that the cytotoxic effects of irradiation were again restricted to the non-TM-connected tumor cells, while TM-connected GBMSCs were largely protected (Fig. 9c), and these effects were very similar for shTtyh1 and control gliomas (Fig. 9c). Together, these data suggest that functionally undisturbed interconnecting TMs, mediating tumor cell–tumor cell interconnections, despite Ttyh1 deficiency, preserve the radioresistance of these otherwise growth-deficient (Figs. 7, 8) tumors.
Discussion
In this study we aimed to identify novel drivers of the various functions of TMs. We found Ttyh1 of particular relevance for TM-mediated glioma-cell invasion and proliferation, which are both necessary for brain colonization. More than that, the results imply that ≥2 different TM-proficient glioma-cell subpopulations with functionally different TM subtypes exist: one particularly invasive with 1–2 TMs, where Ttyh1 is of high functional relevance (invasive TMs), and one with multiple TMs, typically forming a dense multicellular network with other glioma cells (interconnecting TMs); the latter appears uncompromised by interference with Ttyh1 (Fig. 10). Invasive TMs share traits with other cellular protrusions described to be involved in glioma-cell invasion, such as invadopodia (Linder, 2007) or filopodia (Murphy and Courtneidge, 2011), but TMs are characterized by their length (>10, up to several hundreds of micrometer) as well as duration (some >100 d), thereby in many respects rather resemble stable neuronal protrusions, such as axons and dendrites (Osswald et al., 2015). Despite elaborate studies to identify structural components of TMs, no specific marker for TMs has been be identified, which is a general pitfall in the field of cellular protrusions (Murphy and Courtneidge, 2011; Saykali and El-Sibai, 2014; Jacquemet et al., 2015), rendering a certain overlap possible. Nonetheless, we here report Ttyh1 as a marker for invasive TMs, while Ttyh1 was not found to be associated with other cellular protrusions, such as invadopodia, filopodia, or tunneling nanotubes, in proteome analyses (Mattila and Lappalainen, 2008; Schoumacher et al., 2010; Murphy and Courtneidge, 2011; Abounit and Zurzolo, 2012; Hastie and Sherwood, 2016).
Figure 10.

Schematic illustration of the role of Ttyh1 for TM functions and brain tumor progression. a, In the presence of functional Ttyh1, the subtype of glioma cells extending 1–2 TMs is highly invasive (blue), while another one with multiple TMs interconnecting tumor cells to one multicellular network (red) is more stationary. TMs show a normal phenotype, and the tumor is highly proliferative. b, In the absence of Tthy1, tumors become invasion-deficient and growth-deficient, resulting in greatly reduced brain colonization. The proportion of invasive glioma cells (unipolar/bipolar cells) is dramatically reduced, and the remaining cells of this cell type show pathological TMs (blue cells, box). Multiconnected cells (red cells) are unaltered. Arrows indicate the invasion speed of TMs and tumor cells.
Of note, the TTYH1 gene is located on chromosome 19q, and codeletion of the chromosomal parts 1p and 19q characterizes oligodendrogliomas, another related glioma type that has a much better prognosis than astrocytomas (Cairncross et al., 2014). Consistently, Ttyh1 appears downregulated in 1p/19q codeleted versus 1p/19q intact human gliomas when revisiting a comparative RNA-Seq gene-expression analysis (Osswald et al., 2015). Because of deficient TM formation and function, 1p/19q-codeleted oligodendrogliomas are invasion-deficient (Osswald et al., 2015). This suggests a role of Ttyh1 expression and function for the different courses of these human diseases.
Ttyh1, a membrane protein, is normally restrictively expressed in neural tissue and the testis, particularly during development (Matthews et al., 2007). Interestingly, the sole overexpression of Ttyh1 was sufficient to induce marked extensions of neurites (i.e., long membrane protrusions involved in the formation of axons and dendrites) in neuronal as well as non-neuronal cells, whereas the knockdown of Ttyh1 led to morphological changes of protrusions described as neurite beading (Stefaniuk et al., 2010), which is similar to what we found in TMs of glioblastoma cells. Ttyh1 is also expressed in reactive and migrating astrocytes, where it concentrated at the leading edge of cellular protrusions (Wiernasz et al., 2014), resembling our results from subcellular distribution of Ttyh1 protein in glioma cells. The basal expression in nonreactive astrocytes was low (Wiernasz et al., 2014), emphasizing a more restricted function to the migratory subgroup of cells, which again is in accordance with our findings in glioma cells. Interestingly, Venkatesh and colleagues showed that neuronal activity promotes the proliferation and growth of high-grade glioma through the activity-regulated secretion of neuroligin-3, which was associated (while not functionally verified) with increased TTYH1 expression in a gene-expression screen (Venkatesh et al., 2015). Furthermore, a high-throughput analysis revealed high TTYH1 expression in glial tumors (Feng et al., 2012), but our study is the first to elucidate its role in glioma biology.
During embryonic CNS development, Ttyh1 is specifically expressed in proliferative regions, where neural stem cells (NSCs) are accommodated (Cao et al., 2017). In recent years, NSCs and neural progenitor cells have been discussed as potential origins of gliomas (Jackson and Alvarez-Buylla, 2008; Zong et al., 2012). Glioma cells not only share morphological features of and molecular traits with neural progenitor cells, but also recapitulate migration patterns observed during normal CNS development (Cayre et al., 2009; Cuddapah et al., 2014). Interestingly, the different migratory properties of migratory bipolar and stationary multipolar tumor cells reported here have been described for neural precursors before (Koizumi et al., 2006; Zhang et al., 2007). Our data thereby support the hypothesis that glioma cells exploit developmental pathways and molecules for TM formation and cell invasion. The identification of two primarily neuronal proteins, Ttyh1 and Gap-43, as molecular drivers of TM formation and function, as well as the presence on TMs of growth cone-like tips, certainly demonstrate some similarities between TMs and such neuronal cell protrusions as neurites and axons. However, not unexpectedly, the absent expression of markers of mature neurons in TMs, such as β III tubulin (Osswald et al., 2015), indicates a different biological entity.
Since one of the proposed functions of Ttyh1 includes a chloride-channel function (Suzuki and Mizuno, 2004; Suzuki, 2006), it is possible that it executes its promigratory function through its chloride-conducting properties and regulation of the cell volume. Glioma cells accumulate chloride ions (Habela et al., 2009) and use the efflux of water following chloride efflux to adjust their cell shape (Lui et al., 2010) when infiltrating the dense neuropil (Movie 1). Chloride-channel blockade or knockdown leads to reduced invasion capacity (Cuddapah et al., 2013), similar to the effect of the Ttyh1 knockdown, and is currently being investigated in clinical trials as a potential therapeutic target (Cuddapah et al., 2014). This might explain why Ttyh1 plays functional roles primarily in the TMs of the migratory 1–2 TM glioma-cell subtype (invasive TMs), where it is consistently expressed. The observed filament beading induced by Ttyh1 knockdown could be the equivalent of local cell swelling (Suzuki, 2006; Stefaniuk et al., 2010), thereby hindering effective cell-shape adaptation. After formation of stable intercellular connections, cell and TM shape adaption mediated by Ttyh1 seems of minor importance.
Chloride channel-mediated cell-volume regulation is not only required for cell rounding during mitosis, but potentially also for the transport of nuclei along TMs as a means of tumor-cell dissemination (Osswald et al., 2015), which thereby might explain the anti-proliferative effect of Ttyh1 downregulation, as demonstrated for other chloride channels (Cuddapah et al., 2012; Rao et al., 2015).
Another potential mechanism of action of Ttyh1 could be an interaction with proinvasive integrins (Tabatabai et al., 2011) as Matthews and colleagues demonstrated that Ttyh1 colocalized with α5-integrin (Matthews et al., 2007), which was also seen in our GBMSCs.
When comparing the quantitative impact of undisturbed Ttyh1 expression on successful brain colonization with that of Gap-43 in a previous study (Osswald et al., 2015), it appears that Ttyh1 might be even more relevant for tumor-cell invasion and proliferation than Gap-43. Knockdown of Ttyh1, unlike knockdown of Gap-43, increased the relative number of highly TM-interconnected and more stationary glioma cells in S24 GBMSCs. The differential effects on distinct subpopulations and TM functions lead to the hypothesis that different TM subtypes with particular molecular drivers and/or functional components exist, with Ttyh1 emerging as marker for the invasive subtype of TMs.
One can speculate that the invasive deficit of the Ttyh1-knockdown tumors might facilitate the interconnection of neighboring tumor cells with TMs, using Ttyh1-independent machineries like Gap-43 for the formation of this TM subtype. We hypothesize that the two subpopulations are two different stages of tumor cells rather than ab initio different cells. After the cells with 1–2 TMs have invaded the brain, they become resident at some point and transform into interconnecting multipolar cells, as indicated by increase of this subpopulation during tumor progression (Osswald et al., 2015). The Ttyh1 knockdown might facilitate this transformation into a more resident stage. Finally, the results of this study support the finding that TM-interconnected glioma cells build the radioresistant backbone of the brain tumor no matter how invasion-deficient and small the tumor is. However, the anti-proliferative effect after Ttyh1 knockdown might additionally enhance tumor-cell resistance against cytotoxic therapy (Pawlik and Keyomarsi, 2004).
In conclusion, our study identifies Ttyh1 as a novel and important molecular driver of distinct TM functions related to brain colonization. Interestingly, Ttyh1 has mainly been associated with CNS development and repair so far. Moreover, we report important additional information about TM-associated tumor-cell heterogeneity, as well as TM heterogeneity, in gliomas, pointing toward the necessity of distinct therapeutic strategies to target different tumor-cell or TM subtypes. Both TM-associated tumor-cell subtypes with their intrinsic features of diffuse infiltration (1–2 TMs) and high therapy resistance (multiple TMs) appear to contribute to the current poor prognosis of malignant astrocytomas. The question how and when to target which TMs is of translational importance (Osswald et al., 2016). In contrast to Gap-43, the most promising therapeutic window for Ttyh1 inhibition could be after completion of standard cytotoxic therapy, or even instead of such therapy; concomitant combination with radiotherapy might be avoided. The strong anti-invasive and anti-proliferative effects of the genetic Ttyh1 knockdown, however, and the potentially limited importance for the adult CNS (Abramova et al., 2005) make Ttyh1 an interesting target for future drug development.
Footnotes
This work was supported by the Deutsche Forschungsgemeinschaft (Grant DFG WI 1930/5-1), the Faculty of Medicine of the Technical University of Munich (to B.W.: grant of the Kommission für Klinische Forschung [KKF]), the medical faculty of Heidelberg University, the Hoffmann-Klose Foundation (grant to F.T.K.), the Helmholtz International Graduate School (to C.T.), and Deutsche Krebshilfe (Grant 110624 to W.W.). We thank the Microarray Unit of the German Cancer Research Center Genomics and Proteomics Core Facility for providing the Illumina Whole-Genome Expression Beadchips and related services, as well as the Central Animal Laboratory of the German Cancer Research Center for their support. We thank Petra Rübmann and Antje Habel for technical assistance.
The authors declare no competing financial interests.
References
- Abounit S, Zurzolo C (2012) Wiring through tunneling nanotubes—from electrical signals to organelle transfer. J Cell Sci 125:1089–1098. 10.1242/jcs.083279 [DOI] [PubMed] [Google Scholar]
- Abramova N, Charniga C, Goderie SK, Temple S (2005) Stage-specific changes in gene expression in acutely isolated mouse CNS progenitor cells. Dev Biol 283:269–281. 10.1016/j.ydbio.2005.03.040 [DOI] [PubMed] [Google Scholar]
- Benjamini Y, Hochberg Y (1995) Controlling the false discovery rate—a practical and powerful approach to multiple testing. J Roy Stat Soc B Met 57:289–300. [Google Scholar]
- Bolstad BM, Irizarry RA, Astrand M, Speed TP (2003) A comparison of normalization methods for high density oligonucleotide array data based on variance and bias. Bioinformatics 19:185–193. 10.1093/bioinformatics/19.2.185 [DOI] [PubMed] [Google Scholar]
- Cairncross JG, Wang M, Jenkins RB, Shaw EG, Giannini C, Brachman DG, Buckner JC, Fink KL, Souhami L, Laperriere NJ, Huse JT, Mehta MP, Curran WJ Jr (2014) Benefit from procarbazine, lomustine, and vincristine in oligodendroglial tumors is associated with mutation of IDH. J Clin Oncol 32:783–790. 10.1200/JCO.2013.49.3726 [DOI] [PMC free article] [PubMed] [Google Scholar]
- Cao XL, Zhang X, Zhang YF, Zhang YZ, Song CG, Liu F, Hu YY, Zheng MH, Han H (2017) Expression and purification of mouse Ttyh1 fragments as antigens to generate Ttyh1-specific monoclonal antibodies. Protein Expr Purif 130:81–89. 10.1016/j.pep.2016.09.013 [DOI] [PubMed] [Google Scholar]
- Cayre M, Canoll P, Goldman JE (2009) Cell migration in the normal and pathological postnatal mammalian brain. Prog Neurobiol 88:41–63. 10.1016/j.pneurobio.2009.02.001 [DOI] [PMC free article] [PubMed] [Google Scholar]
- Claes A, Idema AJ, Wesseling P (2007) Diffuse glioma growth: a guerilla war. Acta Neuropathol 114:443–458. 10.1007/s00401-007-0293-7 [DOI] [PMC free article] [PubMed] [Google Scholar]
- Combs SE, Schmid TE, Vaupel P, Multhoff G (2016) Stress response leading to resistance in glioblastoma—the need for innovative radiotherapy (iRT) concepts. Cancers (Basel) 8:pii:E15. 10.3390/cancers8010015 [DOI] [PMC free article] [PubMed] [Google Scholar]
- Cuddapah VA, Habela CW, Watkins S, Moore LS, Barclay TT, Sontheimer H (2012) Kinase activation of ClC-3 accelerates cytoplasmic condensation during mitotic cell rounding. Am J Physiol Cell Physiol 302:C527–C538. 10.1152/ajpcell.00248.2011 [DOI] [PMC free article] [PubMed] [Google Scholar]
- Cuddapah VA, Turner KL, Seifert S, Sontheimer H (2013) Bradykinin-induced chemotaxis of human gliomas requires the activation of KCa3.1 and ClC-3. J Neurosci 33:1427–1440. 10.1523/JNEUROSCI.3980-12.2013 [DOI] [PMC free article] [PubMed] [Google Scholar]
- Cuddapah VA, Robel S, Watkins S, Sontheimer H (2014) A neurocentric perspective on glioma invasion. Nat Rev Neurosci 15:455–465. 10.1038/nrn3765 [DOI] [PMC free article] [PubMed] [Google Scholar]
- D'Abaco GM, Kaye AH (2008) Integrin-linked kinase: a potential therapeutic target for the treatment of glioma. J Clin Neurosci 15:1079–1084. 10.1016/j.jocn.2008.01.008 [DOI] [PubMed] [Google Scholar]
- Eberwine J, Yeh H, Miyashiro K, Cao Y, Nair S, Finnell R, Zettel M, Coleman P (1992) Analysis of gene expression in single live neurons. Proc Natl Acad Sci U S A 89:3010–3014. 10.1073/pnas.89.7.3010 [DOI] [PMC free article] [PubMed] [Google Scholar]
- Feng Y, Hurst J, Almeida-De-Macedo M, Chen X, Li L, Ransom N, Wurtele ES (2012) Massive human co-expression network and its medical applications. Chem Biodivers 9:868–887. 10.1002/cbdv.201100355 [DOI] [PMC free article] [PubMed] [Google Scholar]
- Goslin K, Schreyer DJ, Skene JH, Banker G (1988) Development of neuronal polarity: GAP-43 distinguishes axonal from dendritic growth cones. Nature 336:672–674. 10.1038/336672a0 [DOI] [PubMed] [Google Scholar]
- Habela CW, Ernest NJ, Swindall AF, Sontheimer H (2009) Chloride accumulation drives volume dynamics underlying cell proliferation and migration. J Neurophysiol 101:750–757. 10.1152/jn.90840.2008 [DOI] [PMC free article] [PubMed] [Google Scholar]
- Halleran AD, Sehdev M, Rabe BA, Huyck RW, Williams CC, Saha MS (2015) Characterization of tweety gene (ttyh1–3) expression in Xenopus laevis during embryonic development. Gene Expr Patterns 17:38–44. 10.1016/j.gep.2014.12.002 [DOI] [PMC free article] [PubMed] [Google Scholar]
- Hamard L, Ratel D, Selek L, Berger F, van der Sanden B, Wion D (2016) The brain tissue response to surgical injury and its possible contribution to glioma recurrence. J Neurooncol 128:1–8. 10.1007/s11060-016-2096-y [DOI] [PubMed] [Google Scholar]
- Hastie EL, Sherwood DR (2016) A new front in cell invasion: the invadopodial membrane. Eur J Cell Biol 95:441–448. 10.1016/j.ejcb.2016.06.006 [DOI] [PMC free article] [PubMed] [Google Scholar]
- Jackson EL, Alvarez-Buylla A (2008) Characterization of adult neural stem cells and their relation to brain tumors. Cells Tissues Organs 188:212–224. 10.1159/000114541 [DOI] [PubMed] [Google Scholar]
- Jacquemet G, Hamidi H, Ivaska J (2015) Filopodia in cell adhesion, 3D migration and cancer cell invasion. Curr Opin Cell Biol 36:23–31. 10.1016/j.ceb.2015.06.007 [DOI] [PubMed] [Google Scholar]
- Koizumi H, Higginbotham H, Poon T, Tanaka T, Brinkman BC, Gleeson JG (2006) Doublecortin maintains bipolar shape and nuclear translocation during migration in the adult forebrain. Nat Neurosci 9:779–786. 10.1038/nn1704 [DOI] [PubMed] [Google Scholar]
- Kumada T, Yamanaka Y, Kitano A, Shibata M, Awaya T, Kato T, Okawa K, Abe T, Oshima N, Nakahata T, Heike T (2010) Ttyh1, a Ca(2+)-binding protein localized to the endoplasmic reticulum, is required for early embryonic development. Dev Dyn 239:2233–2245. 10.1002/dvdy.22348 [DOI] [PubMed] [Google Scholar]
- Lee J, Kotliarova S, Kotliarov Y, Li A, Su Q, Donin NM, Pastorino S, Purow BW, Christopher N, Zhang W, Park JK, Fine HA (2006) Tumor stem cells derived from glioblastomas cultured in bFGF and EGF more closely mirror the phenotype and genotype of primary tumors than do serum-cultured cell lines. Cancer Cell 9:391–403. 10.1016/j.ccr.2006.03.030 [DOI] [PubMed] [Google Scholar]
- Lemke D, Weiler M, Blaes J, Wiestler B, Jestaedt L, Klein AC, Löw S, Eisele G, Radlwimmer B, Capper D, Schmieder K, Mittelbronn M, Combs SE, Bendszus M, Weller M, Platten M, Wick W (2014) Primary glioblastoma cultures: can profiling of stem cell markers predict radiotherapy sensitivity? J Neurochem 131:251–264. 10.1111/jnc.12802 [DOI] [PubMed] [Google Scholar]
- Linder S. (2007) The matrix corroded: podosomes and invadopodia in extracellular matrix degradation. Trends Cell Biol 17:107–117. 10.1016/j.tcb.2007.01.002 [DOI] [PubMed] [Google Scholar]
- Lowery LA, Van Vactor D (2009) The trip of the tip: understanding the growth cone machinery. Nat Rev Mol Cell Biol 10:332–343. 10.1038/nrm2679 [DOI] [PMC free article] [PubMed] [Google Scholar]
- Lui VC, Lung SS, Pu JK, Hung KN, Leung GK (2010) Invasion of human glioma cells is regulated by multiple chloride channels including ClC-3. Anticancer Res 30:4515–4524. [PubMed] [Google Scholar]
- Matthews CA, Shaw JE, Hooper JA, Young IG, Crouch MF, Campbell HD (2007) Expression and evolution of the mammalian brain gene Ttyh1. J Neurochem 100:693–707. 10.1111/j.1471-4159.2006.04237.x [DOI] [PubMed] [Google Scholar]
- Mattila PK, Lappalainen P (2008) Filopodia: molecular architecture and cellular functions. Nat Rev Mol Cell Biol 9:446–454. 10.1038/nrm2406 [DOI] [PubMed] [Google Scholar]
- Murphy DA, Courtneidge SA (2011) The ‘ins’ and ‘outs’ of podosomes and invadopodia: characteristics, formation and function. Nat Rev Mol Cell Biol 12:413–426. 10.1038/nrm3141 [DOI] [PMC free article] [PubMed] [Google Scholar]
- Osswald M, Jung E, Sahm F, Solecki G, Venkataramani V, Blaes J, Weil S, Horstmann H, Wiestler B, Syed M, Huang L, Ratliff M, Karimian Jazi K, Kurz FT, Schmenger T, Lemke D, Gömmel M, Pauli M, Liao Y, Häring P, et al. (2015) Brain tumour cells interconnect to a functional and resistant network. Nature 528:93–98. 10.1038/nature16071 [DOI] [PubMed] [Google Scholar]
- Osswald M, Solecki G, Wick W, Winkler F (2016) A malignant cellular network in gliomas: potential clinical implications. Neuro Oncol 18:479–485. 10.1093/neuonc/now014 [DOI] [PMC free article] [PubMed] [Google Scholar]
- Pawlik TM, Keyomarsi K (2004) Role of cell cycle in mediating sensitivity to radiotherapy. Int J Radiat Oncol Biol Phys 59:928–942. 10.1016/j.ijrobp.2004.03.005 [DOI] [PubMed] [Google Scholar]
- Pozarowski P, Grabarek J, Darzynkiewicz Z (2004) Flow cytometry of apoptosis. Curr Protoc Cytom Chapter 7:Unit 7.19. 10.1002/0471142956.cy0719s25 [DOI] [PubMed] [Google Scholar]
- Rampersad SN. (2012) Multiple applications of Alamar Blue as an indicator of metabolic function and cellular health in cell viability bioassays. Sensors (Basel) 12:12347–12360. 10.3390/s120912347 [DOI] [PMC free article] [PubMed] [Google Scholar]
- Rao VR, Perez-Neut M, Kaja S, Gentile S (2015) Voltage-gated ion channels in cancer cell proliferation. Cancers (Basel) 7:849–875. 10.3390/cancers7020813 [DOI] [PMC free article] [PubMed] [Google Scholar]
- Robles E, Gomez TM (2006) Focal adhesion kinase signaling at sites of integrin-mediated adhesion controls axon pathfinding. Nat Neurosci 9:1274–1283. 10.1038/nn1762 [DOI] [PubMed] [Google Scholar]
- Sahm F, Capper D, Jeibmann A, Habel A, Paulus W, Troost D, von Deimling A (2012) Addressing diffuse glioma as a systemic brain disease with single-cell analysis. Arch Neurol 69:523–526. 10.1001/archneurol.2011.2910 [DOI] [PubMed] [Google Scholar]
- Sakamoto M, Miyazaki Y, Kitajo K, Yamaguchi A (2015) VGF, which is induced transcriptionally in stroke brain, enhances neurite extension and confers protection against ischemia in vitro. Transl Stroke Res 6:301–308. 10.1007/s12975-015-0401-2 [DOI] [PubMed] [Google Scholar]
- Saykali BA, El-Sibai M (2014) Invadopodia, regulation, and assembly in cancer cell invasion. Cell Commun Adhes 21:207–212. 10.3109/15419061.2014.923845 [DOI] [PubMed] [Google Scholar]
- Schoumacher M, Goldman RD, Louvard D, Vignjevic DM (2010) Actin, microtubules, and vimentin intermediate filaments cooperate for elongation of invadopodia. J Cell Biol 189:541–556. 10.1083/jcb.200909113 [DOI] [PMC free article] [PubMed] [Google Scholar]
- Stefaniuk M, Swiech L, Dzwonek J, Lukasiuk K (2010) Expression of Ttyh1, a member of the Tweety family in neurons in vitro and in vivo and its potential role in brain pathology. J Neurochem 115:1183–1194. 10.1111/j.1471-4159.2010.07023.x [DOI] [PubMed] [Google Scholar]
- Suzuki M. (2006) The Drosophila tweety family: molecular candidates for large-conductance Ca2+-activated Cl− channels. Exp Physiol 91:141–147. 10.1113/expphysiol.2005.031773 [DOI] [PubMed] [Google Scholar]
- Suzuki M, Mizuno A (2004) A novel human Cl(−) channel family related to Drosophila flightless locus. J Biol Chem 279:22461–22468. 10.1074/jbc.M313813200 [DOI] [PubMed] [Google Scholar]
- Tabatabai G, Tonn JC, Stupp R, Weller M (2011) The role of integrins in glioma biology and anti-glioma therapies. Curr Pharm Des 17:2402–2410. 10.2174/138161211797249189 [DOI] [PubMed] [Google Scholar]
- Thakker-Varia S, Behnke J, Doobin D, Dalal V, Thakkar K, Khadim F, Wilson E, Palmieri A, Antila H, Rantamaki T, Alder J (2014) VGF (TLQP-62)-induced neurogenesis targets early phase neural progenitor cells in the adult hippocampus and requires glutamate and BDNF signaling. Stem Cell Res 12:762–777. 10.1016/j.scr.2014.03.005 [DOI] [PMC free article] [PubMed] [Google Scholar]
- Venkatesh HS, Johung TB, Caretti V, Noll A, Tang Y, Nagaraja S, Gibson EM, Mount CW, Polepalli J, Mitra SS, Woo PJ, Malenka RC, Vogel H, Bredel M, Mallick P, Monje M (2015) Neuronal activity promotes glioma growth through neuroligin-3 secretion. Cell 161:803–816. 10.1016/j.cell.2015.04.012 [DOI] [PMC free article] [PubMed] [Google Scholar]
- Weiler M, Blaes J, Pusch S, Sahm F, Czabanka M, Luger S, Bunse L, Solecki G, Eichwald V, Jugold M, Hodecker S, Osswald M, Meisner C, Hielscher T, Rübmann P, Pfenning PN, Ronellenfitsch M, Kempf T, Schnölzer M, Abdollahi A, et al. (2014) mTOR target NDRG1 confers MGMT-dependent resistance to alkylating chemotherapy. Proc Natl Acad Sci U S A 111:409–414. 10.1073/pnas.1314469111 [DOI] [PMC free article] [PubMed] [Google Scholar]
- Weller M, Wick W, Aldape K, Brada M, Berger M, Pfister SM, Nishikawa R, Rosenthal M, Wen PY, Stupp R, Reifenberger G (2015) Glioma. Nature Rev Dis Primers 1:15017. 10.1038/nrdp.2015.17 [DOI] [PubMed] [Google Scholar]
- Wiernasz E, Kaliszewska A, Brutkowski W, Bednarczyk J, Gorniak M, Kaza B, Lukasiuk K (2014) Ttyh1 protein is expressed in glia in vitro and shows elevated expression in activated astrocytes following status epilepticus. Neurochem Res 39:2516–2526. 10.1007/s11064-014-1455-3 [DOI] [PMC free article] [PubMed] [Google Scholar]
- Zhang RL, LeTourneau Y, Gregg SR, Wang Y, Toh Y, Robin AM, Zhang ZG, Chopp M (2007) Neuroblast division during migration toward the ischemic striatum: a study of dynamic migratory and proliferative characteristics of neuroblasts from the subventricular zone. J Neurosci 27:3157–3162. 10.1523/JNEUROSCI.4969-06.2007 [DOI] [PMC free article] [PubMed] [Google Scholar]
- Zong H, Verhaak RG, Canoll P (2012) The cellular origin for malignant glioma and prospects for clinical advancements. Expert Rev Mol Diagn 12:383–394. 10.1586/erm.12.30 [DOI] [PMC free article] [PubMed] [Google Scholar]