

Abstract
Past investigations on stem cell-mediated recovery after stroke have limited their focus on the extent and morphological development of the ischemic lesion itself over time or on the integration capacity of the stem cell graft ex vivo. However, an assessment of the long-term functional and structural improvement in vivo is essential to reliably quantify the regenerative capacity of cell implantation after stroke. We induced ischemic stroke in nude mice and implanted human neural stem cells (H9 derived) into the ipsilateral cortex in the acute phase. Functional and structural connectivity changes of the sensorimotor network were noninvasively monitored using magnetic resonance imaging for 3 months after stem cell implantation. A sharp decrease of the functional sensorimotor network extended even to the contralateral hemisphere, persisting for the whole 12 weeks of observation. In mice with stem cell implantation, functional networks were stabilized early on, pointing to a paracrine effect as an early supportive mechanism of the graft. This stabilization required the persistent vitality of the stem cells, monitored by bioluminescence imaging. Thus, we also observed deterioration of the early network stabilization upon vitality loss of the graft after a few weeks. Structural connectivity analysis showed fiber-density increases between the cortex and white matter regions occurring predominantly on the ischemic hemisphere. These fiber-density changes were nearly the same for both study groups. This motivated us to hypothesize that the stem cells can influence, via early paracrine effect, the functional networks, while observed structural changes are mainly stimulated by the ischemic event.
SIGNIFICANCE STATEMENT In recent years, research on strokes has made a shift away from a focus on immediate ischemic effects and towards an emphasis on the long-range effects of the lesion on the whole brain. Outcome improvements in stem cell therapies also require the understanding of their influence on the whole-brain networks. Here, we have longitudinally and noninvasively monitored the structural and functional network alterations in the mouse model of focal cerebral ischemia. Structural changes of fiber-density increases are stimulated in the endogenous tissue without further modulation by the stem cells, while functional networks are stabilized by the stem cells via a paracrine effect. These results will help decipher the underlying networks of brain plasticity in response to cerebral lesions and offer clues to unravelling the mystery of how stem cells mediate regeneration.
Keywords: functional networks, mouse, stem cell implantation, stroke, structural networks
Introduction
Stroke remains the major cause of permanent disabilities and ranks among the most common causes of death in Western countries. Up to now, thrombolysis is the only clinically available treatment. Unfortunately, because this treatment is effective only if it is administered quickly after stroke, and even then with risks of serious side effects, only 5–10% of stroke patients profit from it. Therefore, there is an urgent need for new, additional therapeutic strategies that remain or are specifically effective after the relevant thrombolytic time window. With the onset of stem cell biology, stem cells, with their unique capacity of cell renewal, have quickly gained high interest as a source for regenerative therapy.
Several experimental investigations have already reported outcome improvement after stem cell implantation in rodent models of stroke (Bacigaluppi et al., 2009; Minnerup et al., 2011; Doeppner et al., 2017). The attention of those studies has typically been limited to the ischemic focus itself assessing e.g., lesion size or has been drawn to the fate of the stem cell graft, e.g., structural and functional integration into the host brain tissue, while correlating these aspects with behavioral deficit and improvement, respectively (Ramos-Cabrer et al., 2010; Oki et al., 2012; Tornero et al., 2013).
In the present investigation, we take a different approach as we have set out to discover how the whole brain is affected by the ischemic event as well as by the treatment with the stem cell engraftment. For this purpose, we have focused on changes of structural and functional connectivities of the sensorimotor networks. This approach permits us to assess the stroke-induced far-ranging disturbances in the networks while unraveling the therapeutic effect of the stem cell graft and clarifying its mechanism of action. We pay particular attention to the contralateral hemisphere, which researchers suspect plays an important role during cortical reorganization and related recovery (Reitmeir et al., 2011, 2012; Buetefisch, 2015).
We have applied state-of-the-art high-field magnetic resonance imaging (MRI) using resting-state fMRI (rsfMRI) for functional connectivity analysis. rsfMRI depends on blood oxygenation level-dependent fluctuations that modulate the MRI signal during resting brain condition. Functional connectivity of rsfMRI is then based on strong temporal correlations between regional fluctuations. In a recent report, Ma et al. (2016) compared rsfMRI data with simultaneously recorded neural activity, measured with optical imaging of calcium-sensitive fluorophore GCaMP. In this study, these authors demonstrated a direct and strong coupling between the rsfMRI hemodynamic pattern and the excitatory neural activity. Active, functional links between brain regions that are spatially segregated can then further be identified through the correlation of the acquired MRI time profiles.
High angular resolution diffusion imaging maps the underlying neural pathways through the reconstruction of axonal bundles (fibers). Also, the spherical harmonics-based Q-ball reconstruction algorithm (Tuch, 2004; Descoteaux et al., 2007) allows researchers to accurately resolve regions with a rather complex fiber architecture that involves multiple fiber directions within one voxel (Tuch et al., 2003). Thus, we have looked at the changes in fiber density of the sensorimotor structural pathways. By combining both methods, we have obtained a full picture of the neural connectivity changes from the combined structural and functional point of view.
Far-reaching disturbances of the sensorimotor networks in the mouse brain after stroke are characterized, extending to the contralesional hemisphere.
We report here for the first time that stem cell implantation after stroke results in direct stabilization of this functional network, leaving it indistinguishable from normal brain networks. Including in vivo bioluminescence imaging (Aswendt et al., 2013; Adamczak et al., 2017), we demonstrate that this stabilization requires persistent graft vitality. Noted increases of fiber density in the structural sensorimotor network of the ischemic hemisphere are exclusively stroke-induced, but are not further modulated by stem cell grafting.
Our studies show for the first time the long-range stabilizing effect by the stem cell graft on the functional network. This effect, interpreted as a paracrine effect, takes place without the need for integration into the host brain tissue.
Materials and Methods
Experimental animals and experimental design
All animal experiments were performed in accordance with the guidelines of the German Animal Welfare Act and approved by the local authorities (Landesamt für Natur, Umwelt und Verbraucherschutz Nordrhein-Westfalen). Animals were socially housed under a fixed 12 h light/dark cycle with ad libitum access to food and water.
Adult, male NMRI (Naval Medical Research Institute)-nu mice (12–14 weeks old, 32–37 g; Janvier Labs) were used in this study. All surgical experiments were performed under anesthesia with 1.5–2% of isoflurane in a mixture of 70:30% N2O/O2 atmosphere, accompanied by subcutaneous injection of 4 mg/kg carprofen (Rimadyl, Zoetis) twice a day as an analgesic, for 3 d following surgery. Stroke was induced by the filament occlusion method on Day 0 (see below for details). Two days later, stem cells were grafted or HBSS injected (compare with method described below). MRI was performed 5–8 d before, as well as 1, 2, 4, 8, and 12 weeks after stroke induction and cell implantation (2 d after stroke), while bioluminescence imaging (BLI) of the transgenic graft was recorded at Weeks 2, 4, 6, 8, 10, and 12 after stroke.
Transient middle cerebral artery occlusion
After MRI baseline measurements, focal ischemic stroke was initiated by transient occlusion of the middle cerebral artery (MCAO) with an intraluminal filament as described previously (Adamczak et al., 2014; Hamzei Taj et al., 2016). In brief, mice were anesthetized with isoflurane and the branch of the right common carotid artery (CCA), the external carotid artery, and the internal carotid artery were exposed. A rubber-coated filament (length, 20 mm; diameter, 170 μm at the tip; Doccol) was inserted into the internal carotid artery until blockage of the MCA. The filament was kept in place for 30 min and mice were allowed to wake up during this period. At the end of the occlusion time, the animals were reanesthetized, the filament was removed to allow for reperfusion, and the CCA was ligated permanently. Analgesic medication was started briefly before surgery and provided during 3 d thereafter. During the following 2 weeks, body weight was monitored and a Modified Neurological Deficit Score (mNDS) was recorded (Chen et al., 2001; Hamzei Taj et al., 2016) to support evaluation of comparable stroke severity between groups by assessment of sensorimotor function deficit.
Intracerebral injection and monitoring of transgenic neural stem cells
The commercially available human neural stem cell (NSC) line H9-NSC (WA09, Life Technologies) was lentivirally transduced with the construct EF1α-Luc2-T2A-eGFP to express the light-emitting imaging reporter firefly luciferase (Luc2) and an enhanced green fluorescence protein (eGFP) under the constitutive promotor of the elongation factor 1 α (EF1α). Cell generation, cultivation, and quantification have been described in detail previously (Tennstaedt et al., 2015).
Two days after stroke induction and before cell implantation, all animals were tested and sorted with MRI for successful stroke development in the cortex and striatum. For cell implantation, NMRI-ν mice were anesthetized and the head was fixed in a stereotaxic frame (Stoelting). A small hole was drilled into the skull above the planned injection site, and a Hamilton syringe (26 ga needle) was slowly inserted ipsilesionally into the cortex at the injection site (+0.5 mm anteroposterior, −0.5 mm dorsoventral relative to bregma. The lateral coordinate was previously determined near the lesion for each individual with the acquired MR image at approximately L: 1–2 mm.
Nine randomly selected animals with a corticostriatal stroke were injected with 2 μl of H9-EF1α-Luc2-T2A-eGFP cells (150,000 cells/μl), resuspended in HBSS (Life Technologies), at a flow rate of 150 nl/min. After injection, the needle was kept in place for 5 min before withdrawal. Six ischemic animals were used as a sham group and were injected with 2 μl of HBSS instead of cells under the same experimental conditions as the cell group.
For sequential monitoring of cell vitality, BLI was conducted once every 1–2 weeks for the duration of the study. For BLI measurements, the mice were intraperitoneally injected with 300 mg/kg D-luciferin sodium salt (Synchem) dissolved in Dulbecco's PBS (Life Technologies) and subsequently anesthetized with a mixture of 2% isoflurane in 70:30% N2O/O2 atmosphere (Aswendt et al., 2013). Photon emission was recorded for 30 min with the photon imager IVIS SpectrumCT (PerkinElmer) under continuous isoflurane anesthesia.
Structural and functional MRI data acquisition
All experiments were conducted on a small-animal 9.4 T horizontal MRI system with a 20 cm bore diameter and actively shielded gradient coils (BGA12S2, 600 mT/m; Bruker BioSpin). Radio frequency (RF) excitation and signal reception were performed with a 1H quadrature cryogenic surface coil (CryoProbe, Bruker BioSpin). Image acquisition was executed via ParaVision 5.1 software (Bruker BioSpin). Physiological parameters were monitored with the 1025T System (SA Instruments) and recorded with DASYlab Software (Measurement Computing). Body temperature was measured via a fiber optic rectal probe (SA Instruments) and kept constant at 37 ± 1.0°C by a water-circulating system (MedRes). Animals were anesthetized with 2% isoflurane in a mixture of 70:30% N2/O2 and the head was fixated in the animal cradle with ear bars and a tooth holder in a nose cone with continuous gas flow. At the beginning of the imaging session, isoflurane was reduced to 1.5%.
Structural MRI and fMRI were both acquired within one session to allow for better temporal correlation. Functional activity was acquired as rsfMRI and the structural network with diffusion-sensitive Q-ball imaging. All MRI sessions were preceded by a three-plane scout scan (tripilot), adjustment of the RF signal receiver gain, and a FieldMap with consecutive local shim to optimize field homogeneity and image quality. An anatomical reference scan was acquired with a T2-weighted turbo-RARE (turbo-rapid acquisition with relaxation enhancement) sequence [field of view (FOV), 17.5 × 17.5 mm2; 48 contiguous slices 0.2 mm thick; matrix dimension, 256 × 256; repetition time (TR) = 5500 ms; echo time (TE) = 32.5 ms; RARE factor of 8 with two averages].
A bolus of 0.1 mg/kg medetomidine (Domitor, Elanco), suspended in 250 μl of NaCl, was administered subcutaneously 15–20 min before the functional imaging scan, with subsequent reduction of isoflurane level to 0.5%, following an adapted protocol of Grandjean and colleagues (2014). A gradient-echo echo-planar imaging sequence was used for rsfMRI with the following parameters: FOV, 17.5 × 17.5 mm2; matrix size, 96 × 96; in-plane resolution, 182 × 182 μm2; TR = 2840 ms; TE = 18 ms. One hundred five images were acquired with 16 slices (slice thickness, 0.5 mm; interslice gap, 0.1 mm) recorded noninterleaved and covering the whole forebrain, starting only after ≥10 min on reduced isoflurane levels.
A half-sphere Q-ball imaging protocol was acquired with a four-shot spin-echo EPI sequence (FOV, 17.8 × 17.8 mm2; matrix size, 128 × 128; in-plane resolution, 139 × 139 μm2; TR = 3500 ms; TE = 20 ms; 16 contiguous slices; 0.5 mm slice thickness. One hundred twenty-six diffusion encoding gradient directions covering half a unit sphere from a fivefold tessellated icosahedron with a constant b value of 2000 s/mm2 (Kuo et al., 2008) were used with the time between diffusion gradients Δ = 10 ms and their duration δ = 4 ms. For registration purposes, eight A0 (b = 0 s/mm2) images, distributed linearly between the diffusion-sensitized images, were acquired additionally.
Data processing
rsfMRI preprocessing.
All datasets were brain-extracted, slice-wise motion-corrected with FSL [FMRIB (Oxford Centre for Functional MRI of the Brain) Software Library; http://www.fmrib.ox.ac.uk/fsl; Smith, 2002; Cox et al., 2004] and linearly detrended (Kalthoff et al., 2011). To allow for comparison of different sessions and imaging sequences for analysis of specific regions of interest (ROIs), we coregistered our datasets to publicly available mouse-brain atlases of the whole brain (Dorr et al., 2008) and the neocortex (Ullmann et al., 2013) through the following multistep process using FSL's FLIRT (FMRIB's Linear Image Registration Tool; Jenkinson et al., 2002): (1) MR mouse brain template made in house was warped through an affine, nonlinear transformation to both brain atlases; (2) the acquired anatomical reference scan from each individual session was further linearly (6 df) coregistered to the in-house mouse brain template; (3) the functional datasets were further linearly (6 df) coregistered to the anatomical datasets via rigid-body transformation; and (4) all concatenated matrices were inverted and applied to the mouse-brain atlas to avoid deformation bias of the raw data. This detailed and complex coregistration process of the original data to the mouse-brain atlas is essential to ensure accurate and stable assignment of the selected ROIs throughout a longitudinal study with repetitive measurements.
Six ROIs, or nodes, were extracted from the sensorimotor network, separate for each hemisphere: the primary and secondary motor cortex (M1/M2), the primary somatosensory cortex excluding the limb regions (S1 w/o limbs), the S1 forepaw and hindpaw limb regions (S1 limbs), the secondary somatosensory cortex (S2), the thalamus (Th), and the caudate–putamen (CPu). Bilateral ROIs were only analyzed until Week 2 after stroke induction for accuracy purposes of ROI extraction. For longer periods after stroke, only the contralateral hemisphere was analyzed.
We further accounted for noise contributions in the resting-state signal. Regression of physiological noise was performed by regressing out the recorded respiratory signals, motion parameters, and drifts up to the second order that were obtained from the motion-correction step, as explained in further detail by Kalthoff et al. (2011). Furthermore, the data were spatially smoothed with a Gaussian filter of FWHM = 0.3 mm in-plane (Smith and Brady, 1997). Additionally, to limit contributions from low-frequency signal drifts and high-frequency physiological noise, the time series signal was bandpass-filtered to 0.01–0.08 Hz and normalized. Group-wise full Pearson correlation between pairs of ROIs (i.e., nodes) of the average time series were calculated with a customized version of FSLNets (v0.6; www.fmrib.ox.ac.uk/fsl) and compiled in matrix form. Additionally, intranode connectivity of the rsfMRI data was computed, correlating all voxels per animal within each ROI and extracting the average value per ROI and group using custom-written scripts. No global signal removal was performed because of the controversy over whether such a step is useful and because the meaning of negative correlation values, which often appear after global signal removal, is not understood. All correlation values were transformed to z values by taking the Fisher transformation of the r values before averaging.
Diffusion data processing.
The acquired A0 images were brain-extracted and motion-corrected. The resulting correction matrices for each individual A0 image were interpolated for the diffusion-weighted images recorded in between the A0 images and applied to the corresponding diffusion images. For ROI-based data extraction, we coregistered the A0 images to the mouse-brain atlases and applied the inverse matrix to the mouse atlas, as already described. In addition to the ROIs used for the functional datasets, we included the following white matter regions: cerebral peduncle (cp), corpus callosum (cc), fimbria (fi), fornix (fx), internal capsule (ic), and the anterior commissure (ac). Diffusion data were reconstructed with DSIStudio (dsi-studio.labsolver.org) by using spherical harmonics-based Q-ball reconstruction (Tuch, 2004; Descoteaux et al., 2007) with a regularization parameter of 0.006 (Descoteaux et al., 2007) and eightfold tessellation. Quantitative anisotropy maps were calculated and group-wise averaged, then ROI-based analysis was conducted with ImageJ using custom macros (Version 1.46; National Institutes of Health, Bethesda, MD; http://rsbweb.nih.gov/ij). Deterministic streamline whole-brain tractography (Basser et al., 2000) was performed with DSI-Studio using a 0.5 mm step size, a weighting of 0.1 between directions, and a quantitative anisotropy (QA) threshold of 0.02. Fibers with a length of <5 or >120 mm, as well as fibers with a turning angle of >55° were discarded. Fiber-count connectivity matrices were calculated (DSIStudio) that represent the number of fibers passing between ROIs. To account for differences in ROI volumes, fiber counts were voxel-normalized and a minimal threshold of one fiber per voxel was applied using Matlab v.2014b (MathWorks). Matrices present the difference in voxel-normalized fiber density between two time points.
Immunohistochemistry
After the last MRI measurement, 12 weeks after stroke induction, all animals were deeply anesthetized with isoflurane and transcardially perfused with PBS, followed by 4% paraformaldehyde (PFA; Carl Roth). The whole brain was removed and kept in PFA overnight. On the following day, brains were transferred to a 30% sucrose solution and soaked for ≥2 d. Finally, brains were frozen in −40°C 2-methylbutane (Merck Millipore) and stored at −80°C. Coronal sections (14 μm) were cut on a cryostat (Leica), mounted on SuperFrost Plus slides (Thermo Fisher Scientific), and stored at −20°C. Antigen retrieval was conducted before staining by incubating tissue sections in sodium citrate buffer, pH 6.0, at 80°C for 30 min. To locate engrafted human NSCs and to prove cell graft for neuronal differentiation, brain sections were stained against human nuclei (HuNu; 1:100; Millipore Bioscience Research Reagents) and neuronal nuclei (NeuN; 1:100; Synaptic Systems) as described previously (Tennstaedt et al., 2015). Cell nuclei of all cells were counterstained with Hoechst 33342 (1:1000; Sigma-Aldrich) and sections were mounted in Entellan (Merck Millipore). Images were acquired with a 4×, 20×, or 60× magnification objective with the BioRevo BZ-9000 fluorescence microscope (Keyence) and the BZ-II Analyzer 2.1 software (Keyence).
Statistical analysis
Statistical analysis was performed with SPSS 24 software (IBM) and Matlab 2014b (MathWorks). Statistical significance levels were set to *p < 0.05, **p < 0.005.
Functional connectivity.
Univariate repeated-measures ANOVA was used for the statistical analysis of the cross-correlation, within-group results, and mixed ANOVA for the cross-correlation between-group effects, with post hoc Bonferroni corrections, respectively. Most of the comparisons did not survive the most conservative statistical correction for multiple comparisons. We refrained from the less accurate statistical analysis but decided to present the changes over time and the difference between groups as strong trends, except where statistical significance is explicitly given.
Structural connectivity.
Fiber density was statistically tested for significance with Friedman test and Dunn post hoc corrections for multiple comparisons for the longitudinal within-group analysis and with Mann–Whitney for pairwise, between-group analysis for each week separately. Repeated-measures ANOVA was used for the intranode QA analysis.
Results
Characterization of ischemic lesion
Two characteristic lesion types were generated by the 30 min MCA occlusion, namely lesions restricted to the striatum (n = 6) and lesions involving both striatum and cortex (n = 15). For analysis of the functional data, only a homogeneous group of corticostriatal lesions was included to ensure equal condition in both groups (sham implantation and stem cell implantation, respectively). During the longitudinal study protocol, T2-weighted RARE MR images of the included animals were acquired before stroke induction and at Weeks 1, 2, 4, 8, and 12 after stroke induction. One week before MCAO, RARE images showed no signs of lesion of the healthy subjects. At Week 1 after MCAO, areas with markedly increased T2 values, presenting as hyperintensity, demarcated the lesion extending over large parts of the striatum and the cortex on the right hemisphere. Early brain swelling due to vasogenic edema was only minor. A pronounced curvature of the midline could be noted from Week 2 on due to brain atrophy, distorting the ischemic hemisphere and therefore prohibiting reliable assignment of anatomic regions through coregistration to the anatomic atlas. Therefore, analysis of anatomic regions on the ipsilateral hemisphere was extended only until Week 2, after which time data are presented only for the robust coregistration on the contralateral hemisphere. For the monitoring of acute and chronic ischemic lesion location, size, and development, diffusion changes were registered. Incidence maps of the QA value were chosen to indicate the comparable lesion extent in both groups (Fig. 1A).
Figure 1.
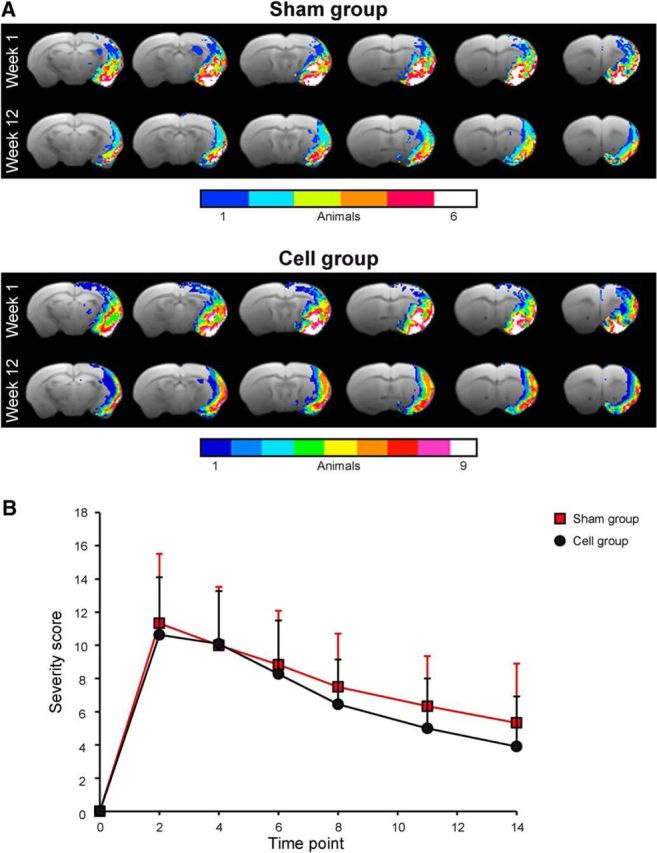
Characterization of the ischemic territory extent and lesion severity in both animal groups. A, The lesion territory is presented by the QA values of the Q-ball diffusion MRI data, indicating the pathological change of diffusion anisotropy and thereby reflecting the ischemic lesion territory. From the individual maps of the animals, incidence maps were calculated to determine the homogeneity of the lesion expansion within each group. B, The neurological deficit score was monitored during the first 2 weeks after stroke induction to ascertain whether the lesion severity is equal in both animal groups.
The modified neurological deficit score had nearly identical time curves for both animal groups (Fig. 1B). mNDS with a scale of 0–16 points increased from value of 0 before stroke to a maximum of 10–12 points at Day 2 after MCAO, indicating a severe functional sensorimotor deficit. During the following 10 d, mNDS values decreased to 6–7 points, reflecting a moderate lesion.
Functional connectivity
Both hemispheres during the first 2 weeks after stroke
Before stroke, the functional connectivity matrices of the sensorimotor networks (z-score values; Fig. 2A) show equal correlation strength in both hemispheres within each group. Moreover, the matrices of both groups do not show statistically significant differences before intervention. At Week 1 after stroke, a strong, global decrease of connectivity strength is noted in the sham-implantation group (upper matrix triangle), but not in the cell-implantation group (lower matrix triangle). No statistically significant change in connectivity strength is seen between consecutive time points within each group and node during the first 2 weeks following stroke.
Figure 2.

Cross-correlation z-score matrices of sensorimotor functional connectivity. A, Z-score matrices of the whole mouse brain sensorimotor networks before (prestroke) stroke induction and 1 and 2 weeks after stroke induction. Directly after stroke induction, the correlation strengths are decreased in the sham group (upper matrix triangle). The effect is strongest for the ipsilateral (right) hemisphere. In animals with stroke and stem cell implantation into the cortex adjacent to the ischemic lesion (cell group; lower matrix triangle), no reduction in the functional network is observed, but it is stabilized with slight increases above prestroke in Week 1 after stroke. B, Z-score matrices of the sensorimotor networks on the contralateral hemisphere during the whole 12 weeks of observation. Here, similar to the ischemic hemisphere, but less pronounced, the sham group shows a connectivity decrease continuously more severe during the 12 weeks of observation. The lowest point is reached at Week 8. In the stem cell-implantation group the implantation stabilizes the connectivity strength still at Week 2. Then, the functional connectivity continually decreases, approximating the lower value matrices of the sham-implantation group between Weeks 8 and 12. “l” prefix, left hemisphere; “r” prefix, right hemisphere; M1/M2, primary/secondary motor cortex; S1 w/o limbs, S1 somatosensory cortex without limb representation area; S1 limbs, limb representation area of the S1 somatosensory cortex; S2: secondary somatosensory cortex; Th, thalamus; CPu, caudate–putamen.
The intergroup statistical analysis at Week 1 shows that both the ipsilateral thalamus and contralateral thalamus have significantly higher correlation strengths to almost all contralateral cortical nodes (with the exception of the motor cortex; 0.005 < p < 0.05) in the cell-implantation group compared with the sham-implantation group.
The ipsilateral, intrahemispheric connectivities (Fig. 3A) of the motor cortex show decreased values for the connection to the S1 and the caudate–putamen in the sham-implantation group. In contrast, no change in ipsilateral, intrahemispheric connectivities of the motor cortex is observed in the stem cell-implantation group, but instead rather an intermittent slight increase is found at Week 1, recovering to prestroke values again at Week 2.
Figure 3.

Z-score values of various connectivities between both hemispheres before and during the first 2 weeks following stroke induction. A, Connectivities within the ischemic hemisphere. B, Interhemispheric connectivities between homotopic nodes of both hemispheres before and during the first 2 weeks following stroke. Error bars indicate SD. None of the temporal comparisons was found to be statistically significant.
The interhemispheric homotopic connectivities of the various sensorimotor network nodes (Fig. 3B) show a clear decline already in Week 1 for the sham-implantation group. In the stem cell-implantation group, no such change is observed at Week 1, but a slight trend toward decreasing values may be noted at Week 2.
The contralateral hemisphere during 12 weeks after stroke
In this analysis, the connectivity matrices of the sensorimotor networks are limited to the healthy hemisphere (Fig. 2B), as the ischemic hemisphere was too strongly affected by beginning atrophy after Week 2 to allow safe coregistration with the anatomic atlas. The situation until Week 2 is the subset of data already presented in Figure 2A. The global decrease in connectivity strength continues for the sham-implantation group (upper matrix triangle) with its lowest values around Week 8, with a slight increase at Week 12. In the stem cell-implantation group (lower matrix triangle), connectivity starts to decrease more sharply only at Week 4 and also reaches a minimum at Week 8, similar to the sham group. At Week 12, both groups present indistinguishable connectivity matrices.
A threshold of ≥15% change in the difference between cross-correlation values was chosen for the discrimination of substantial changes in connectivity strength over time. The situation for the interhemispheric and intrahemispheric connectivity networks is depicted schematically in Figure 4 for both treatment groups. Figure 4A presents the interhemispheric network changes and the intrahemispheric changes of the ischemic hemisphere during the first 2 weeks, when the ischemic hemisphere could be included in the analysis. While the interhemispheric connectivities decreased by ≥20% after stroke in the sham group, no change was noted in the stem cell group. Similarly, the ischemic hemisphere showed several large decreases during the first 2 weeks in the sham group, but only decreases from the S1 in the stem cell group, and only after 2 weeks. Figure 4B reflects the intrahemispheric changes of the contralateral, healthy hemisphere between prestroke and Week 2, and between prestroke and Week 12. Even the contralateral hemisphere was affected by stroke onset, with first decrease already after 2 weeks in the sham group. The stem cell group showed no alterations at this time. Both groups had a strongly reduced (>20%) connectivity network at the end of the observation period at 12 weeks.
Figure 4.
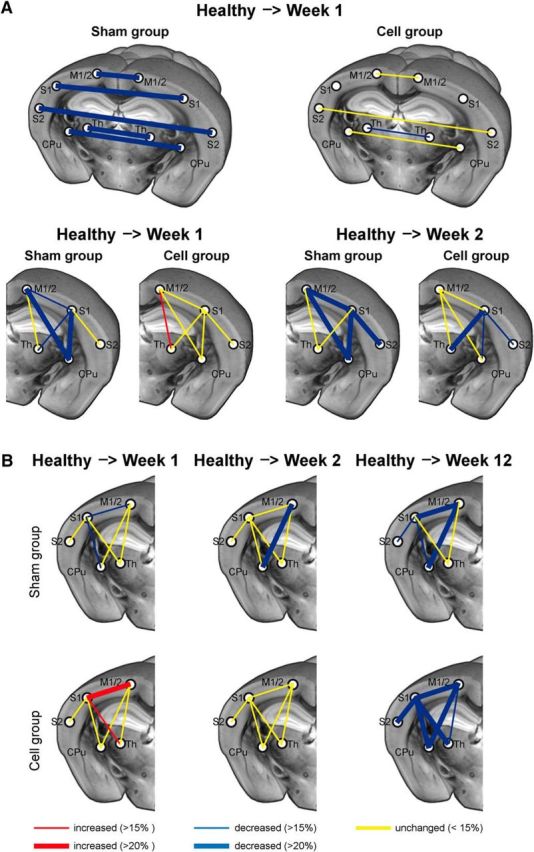
Schematic of the interhemispheric and intrahemispheric functional connectivity changes of the sensorimotor networks. A, Interhemispheric connectivity changes are very pronounced in the sham-implantation group, while in the cell-implantation group, all interhemispheric connectivities remain unchanged, except for a small decrease of the interthalamic connections. The ipsilesional intrahemispheric functional networks are severely affected in the sham-implantation group but show very few and only small changes in the stem cell-implantation group. B, The contralesional intrahemispheric functional connectivity changes show a continuously increasing weakening effect for the sham-implantation group over the 12 weeks of observation. In the stem cell-implantation group, the situation is stable during the first 2 weeks with few changes, followed by a delayed decrease toward the end of the observation period at 12 weeks after stroke. Thicker connecting lines reflect increasing intensity of change with z-score values differing ≫15%. For abbreviations see Figure 2.
Functional changes of intranode correlations
When discussing functional changes of internode correlation coefficients, it is helpful to discriminate whether the alterations result from changes in the connection between the nodes or whether the nodes themselves are affected. We have calculated the intranode correlation coefficient for all nodes of the sensorimotor networks, normalized to the prestroke values for better analysis of changes during the ischemic period. Figure 5 presents the intranode correlation coefficients of the sensorimotor networks; on the left, the ischemic hemisphere is depicted for the first 2 weeks while the changes on the contralateral hemisphere during the 12 weeks are shown on the right diagram.
Figure 5.

Intranode connectivity strength of the nodes of the sensorimotor network. Values of all individual sensorimotor nodes were normalized to their corresponding prestroke values. A, Values of the sham group show a strong decrease to ≤60% on the ischemic hemisphere during the first week. On the contralateral hemisphere, there is only a marginal further decrease after the first week of stroke. B, At 80%, the z-score reduction of the stem cell group is much less during the first week on the ischemic hemisphere. On the contralateral hemisphere, the stem cell group values start with ∼90% to almost 100% of prestroke values during the first week after stroke, followed by slow further decrease to ∼60% at Week 12, which is still slightly higher than the sham group at that time point. Error bars indicate SD. None of the temporal comparisons was found to be statistically significant. For abbreviations see Figure 2.
In the sham-implantation group (Fig. 5A), there is a substantial global decrease of intranode correlation to ∼60% already during Week 1 after stroke induction. During Week 2, the development on the ipsilateral, ischemic hemisphere is rather heterogeneous. The stem cell group (Fig. 5B) has a reduction to ∼80% at Week 1, with little further reduction at Week 2.
The values on the contralateral hemisphere of the sham group remain ≤60%, with a transient recovery at Week 2. In contrast, the values of the stem cell-implantation group show only a minor decrease to ∼90% during Week 1. From Week 2, there is a continuous decrease reaching ∼60% at Week 12, with nearly identical values of the sham group at that time.
Structural connectivity
Both hemispheres during the first 2 weeks after stroke
All fibers passing through as well as ending in two selected regions were calculated and compiled in matrix form, equivalent to the functional connectivity correlation coefficients. The changes in counted fibers over time were difficult to reliably discriminate in the absolute value matrices. Therefore, in a first step, fiber count per region was normalized to the region volume (i.e., a voxel-based normalization was executed) resulting in a local fiber-density value. Then, changes between consecutive measurement time points were displayed as percentage change of the fiber-density value at the earlier time point.
Figure 6 presents the matrices of fiber-density changes between all selected regions. The left matrix column demonstrates the changes from prestroke to Week 1, the right matrix column gives the changes from Weeks 1 to 2. Results of the sham-implantation group are shown in the upper matrix triangle; those of the cell-implantation group are shown in the lower matrix triangle. The dominant changes, marked with white circles and yellow boxes, are comparable in both groups. Many changes marked in the matrices, but in particular those of the white matter connections, are statistically significant, typically at 0.005 < p < 0.05, and in some individual cases p < 0.005 (not individually listed). During the first week, a decrease in fiber density between the contralateral sensorimotor cortex and several regions on the ipsilateral hemisphere are found (nodes in the matrices depicted in dark blue). During the second week, most of these apparent decreases normalized again. This apparent fiber reduction must, however, be assigned to transient diffusion changes caused by some accumulation of vasogenic edema during the first week. The sensorimotor cortex of the ischemic hemisphere shows an increased fiber density connecting with the limb region of the contralateral sensory cortex for both groups (yellow box). In the cell group, the contralateral limb region of the sensory cortex shows an additional fiber-density increase with various white matter regions on the ischemic hemisphere (lower part of the yellow box). During both weeks, there is a strong increase in fiber density on the ipsilateral, ischemic hemisphere between the sensory cortex area and white matter forming the corticospinal tract (CST), the thalamus, and the caudate–putamen (white circles). In the sham-implantation group, these increases are more pronounced in the first week, with a smaller further increase during the second week. In the cell-implantation group, the increase in these connections started somewhat later, being more pronounced in the second week. Changes in a few nodes at different times were found to be statistically significant between both groups, but are not sufficient to conclude that the outcome for the cell-treated group was structurally improved. Thus, a clear positive effect of the cell implantation on the structural connectivity (e.g., a higher fiber density) cannot be confirmed.
Figure 6.

Fiber-tract density changes in the ischemic mouse brain after cortical stem cell grafting. Matrices represent the voxel size-normalized percentage difference for two consecutive time points of fiber counts passing through or ending in two nodes. A, Whole-brain analysis with the difference between the baseline measurement and the first week after stroke (left column), and between the second week and the first week (right column). The dominant increases in fiber densities between the two respective time points are between the somatosensory cortex and white matter regions forming the corticospinal tract (white circles). The marked regions are the same for both groups (upper matrix triangle, sham group; lower matrix triangle, stem cell group) but the highest fiber-density increase occurs earlier in the sham-implantation group (Week 1) than in the stem cell-implantation group (Week 2). Additionally, both groups show a fiber-density increase between the contralesional motor cortex and several white matter regions (yellow box). B, Analysis of the contralesional hemisphere during the whole 12 week period. Represented are the differences in fiber density between two sequential measurement time points after stroke as indicated. Again, as for the bihemispheric analysis of the first 2 weeks, most pronounced fiber-density increases are noted in the somatosensory cortex areas with various white matter regions (white ellipses). Delayed between Weeks 8 and 12, the motor cortex shows a fiber increase to white matter regions (yellow box). No structural difference, but temporal delay in occurrence of the ellipses is noted between the two groups. “l” prefix, left hemisphere; “r” prefix, right hemisphere; M1/M2, primary/secondary motor cortex; S1 w/o limbs, S1 somatosensory cortex without limb representation area; S1 limbs, limb representation area of the S1 somatosensory cortex; S2: secondary somatosensory cortex; Th, thalamus; CPu, caudate–putamen; cp, cerebral peduncle; cc, corpus callosum; ic, internal capsule; ac, anterior commissure.
The mean QA values following stroke induction show a similar trend of temporal behavior for both groups and all regions, and independent of the hemisphere. The situation for the contralateral hemisphere is shown for the whole observation period of 12 weeks in Figure 7. All values statistically decrease (p < 0.001) below the baseline value in the first week for both groups. The first drop is most pronounced in all white matter tissue regions. The values show a continuous rise again from the second week on. For the white matter regions, these changes remain statistically significant between consecutive time points (all p's < 0.03 or less). Most values recovered close to baseline for both groups at the end of the observation period at Week 12, but the values of the cerebral peduncle and the anterior commissure remained below baseline. Comparison between the prestroke values and those at Week 12 result in statistical significance for the white matter regions (<0.016 or less for sham group; <0.001 for cell group).
Figure 7.

QA values of nodes from the sensorimotor networks on the contralateral hemisphere during the full 12 week observation period. The QA values were determined from the Q-ball diffusion MRI data. Error bars indicate SD. Statistical significance was found for all ROIs from before stroke induction to Week 1 after stroke (p < 0.001). For later consecutive time points, white matter ROIs showed a statistical significance with p < 0.016 or less.
The contralateral hemisphere during 12 weeks after stroke
The changes in fiber density on the contralateral hemisphere during the whole 12 week observation period are presented in Figure 6B. During the first 4 weeks, mainly the sensory cortex areas (S1 limbs; S1 without limbs; S2) show a fiber-density increase with white matter regions (except corpus callosum and fimbria), the thalamus, and the caudate–putamen. This pronounced fiber-density increase of S1 without limbs and of S2 with the white matter regions is strongest at the second week in the sham-implantation group, but delayed in the cell-implantation group and appearing only between Weeks 2 and 4 (maximal increases marked by white ellipses). Interestingly, the motor cortex shows a strong fiber-density increase with some white matter tissue regions only between Weeks 8 and 12 (yellow box) in both groups.
Cell fate of the graft
The human NSCs, H9-NSCs, had been lentivirally transduced to express firefly luciferase and eGFP under the constitutive promotor EF1α. The ATP-dependent and oxygen-dependent bioluminescence signal of luciferase was recorded to assess the graft vitality (Fig. 8A). While absolute signal intensity varies considerably between the individual mice (gray lines), the group average signal (red line) clearly indicates a substantial reduction in graft vitality during the first 4 weeks, leveling off at 4–5 weeks and remaining at ∼30% of baseline intensity directly after implantation.
Figure 8.

Characterization of the stem cell graft. A, Vitality of the graft over time was determined from in vivo bioluminescence imaging. Total photon flux shows an intensity decrease over time for all individual animals (gray lines). Values were only included in the analysis from Week 2 on, as earlier values were considered unreliable due to incompletely recovered scalp after grafting. After Week 4, the loss of viable stem cells of the total graft becomes severe as best recognized in the group average curve (red line). After Week 4, viability of the graft is reduced to ∼30% of the original graft and remains at this lower level for the further 8 weeks. B–G, Immunohistochemical staining of the engrafted NSCs shows spontaneous differentiation into neuronal cells. Transgenic NSCs positive for eGFP were located within cortical regions and show nuclear as well as cytoplasmic eGFP expression, including neuronal-like processes (B–D). To prove neuronal differentiation of the engrafted human NSCs, sections were stained for the neuronal marker NeuN (E) and the human cell marker HuNu (F). Several NSCs double-positive for both markers were detected within the graft side, indicating a neuronal differentiation of the engrafted NSCs (G, arrows). Broken lines represent the border between cell graft and host tissue. Scale bars are indicated for each microscopic image.
Twelve weeks after implantation, intracortically engrafted H9-NSCs show spontaneous differentiation into neuronal cells. Transgenic NSCs, positive for eGFP, were located within cortical regions and counterstained with HuNu to identify them as human NSCs (Fig. 8B–G). Neuronal differentiation was marked by NeuN staining counterstained with HuNu to discriminate origin of human stem cells. Several NSCs double-positive for both markers were detected within the graft site, indicating neuronal differentiation of the engrafted NSCs (Fig. 8G, arrows).
Discussion
We have studied the effect of a cortical stem cell graft on the functional and structural connectivity during 12 weeks after stroke in the mouse brain. The internode and intranode functional connectivity strength of the sensorimotor networks after stroke and after cell implantation was analyzed. The structural changes have been monitored by diffusion anisotropy and the fiber density between pairs of anatomic nodes. Vitality of the stem cell graft was followed by bioluminescence imaging. To the best of our knowledge, this is the first study combining a multimodal analysis with the therapeutically relevant approach of human stem cell implantation after stroke.
Stroke leads to a rapid decrease in functional connectivity strength, largely encompassing the contralateral, healthy hemisphere, and persisting during 3 months of observation. The viable stem cell graft, implanted 2 d after stroke induction, can stabilize the functional network, indicating a paracrine effect of the stem cells. Changes of structural connectivity, dominant in the ipsilateral connections of the sensorimotor cortex with white matter regions of the CST, were independent of stem cell engraftment.
Fate of the stem cell graft
Our study design aimed to implant the human NSCs in a viable location, adjacent but outside the cortical lesion. This was secured by selecting the coordinates on the individual T2-weighted MRI scans, recorded directly before implantation. However, in vivo bioluminescence imaging documented a substantial loss to 20–30% of the original graft 4 weeks after grafting. The remaining viable fraction showed neuronal differentiation. This is in full agreement with our earlier cell-fate study of the H9-NSC line with in vivo bioluminescence of differentiation-specific reporters in healthy mouse cortex (Tennstaedt et al., 2015). There, early doublecortin-specific differentiation was observed after 5 weeks, while mature neurons with active synaptogenesis were detected after 2–3 months. Our present results show that the surviving stem cells behave like in healthy cortex. This is further supported by additional experiments (data not shown) where the entire grafts in the cortex of mice with only a striatal lesion survived over the whole observation period. However, after the implantation in the present study, the ischemic territory in the cortex extended into the location of the engraftment. Thus, the graft environment was no longer sufficiently supportive of stem cell survival.
Functional connectivity changes
Stroke-induced changes
The focal ischemic lesion leads to a massive reduction in the complete sensorimotor functional connectivity network. A stroke, within the first week after occurring, severely affects even long-range interhemispheric connections to the healthy, opposite hemisphere. In particular, interhemispheric weakening between homotopic nodes of the sensorimotor networks is seen, an observation consistent with several clinical studies reporting a close correlation of the interhemispheric functional connectivity decrease of the motor cortices with clinical scores for functional deficits (Carter et al., 2010; Park et al., 2011; Xu et al., 2014; Volz et al., 2016). Intrahemispheric sensorimotor networks of the healthy hemisphere are only slightly decreased at the beginning, but several connections of the network continue to weaken during the following 12 weeks; functional network decrease was strongest on the ipsilateral, ischemic hemisphere. Bauer et al. reported severe interhemispheric, homotopic functional connectivity decrease at 3 d after stroke in the mouse cortex, in agreement with our findings at 1 week after stroke (Bauer et al., 2014). van Meer and colleagues reported a pronounced interhemispheric, homotopic functional connectivity decrease in the rat brain lasting for 10 weeks (van Meer et al., 2010b, 2012) for large corticostriatal ischemic lesions, comparable to our present stroke extent in the mouse. Those authors also described a reduction in the intranode connectivity strength of the ipsilateral hemisphere (van Meer et al., 2012), which agrees with our findings. However, they reported that the intranode connectivity strength of the opposite hemisphere remained unaffected, which differs from our findings in the mouse. This difference between our present findings and those of van Meer and colleagues may be because van Meer and colleagues conducted only a general analysis of the averaged entire sensorimotor network (van Meer et al., 2012), while our data are detailed for individual nodes of the sensorimotor network. Furthermore, their lack of clear change of the contralesional functional intranode strength may be due to a weaker response of the more robust rats to the stroke, thus reducing the far reaching functional deficits.
The substantial decrease of 20–40% of the intranode connectivity strength indicates that changes in the connection between the nodes, but also within the nodes themselves, are responsible for the substantial weakening of the functional sensorimotor networks.
Modulation by stem cell graft
The implantation of the human NSCs into the ipsilateral cortex induces an early stabilization of the functional sensorimotor network directly at Week 1. The ischemic hemisphere shows no network weakening and the interhemispheric connections (with the exception of a slight weakening of the thalamic connections) remain unaltered from the prestroke situation. The stem cell graft also has a stabilizing effect on the intranode functional strength, showing only a slight trend to smaller values.
This stabilization of the functional networks by the stem cell engraftment is, however, only transient and decreases in parallel with the loss of the graft vitality. Thus, at Week 2, a slight decrease is already noted at some network connections in the ischemic hemisphere. As time goes on, the network on the contralateral hemisphere is also affected, and after Week 4, the functional networks of the stem cell group are continuously decreasing in strength, slowly approximating the condition of the weakened functional networks of the sham implantation group. Our data show that a vital stem cell graft can stabilize the functional network.
A further important note is the early time point of the network stabilization by the graft. We have demonstrated in our recent in vivo cell-fate study (Tennstaedt et al., 2015) that it takes NSCs >6 weeks to become mature neurons under in vivo conditions. Further studies by us and by others have shown extensive innervation by the host tissue of the stem cell graft in healthy (Doerr et al., 2017) and stroke-damaged brain (Oki et al., 2012; Tornero et al., 2013). Tornero and colleagues reported afferent and efferent connections of the graft with functional integration and response to sensory stimuli in ischemic rats (Tornero et al., 2017). But all these graft-integration results were obtained only ≥3 months after implantation. For the presently observed stabilization of the functional sensorimotor network just a few days after engraftment, the cells have not differentiated into mature neurons yet. Thus, the network stabilization points to a paracrine effect of the NSCs secreting growth factors and cytokines. Our interpretation of the stem cells acting via paracrine effect is in line with the findings of a recent study (Bacigaluppi et al., 2016) discussing modification of the excitatory–inhibitory balance caused by the paracrine effect of NPCs transplanted 3 d after stroke in mice, and reflects the growing consensus that the therapeutic value of stem cells for stroke lies in their growth factor-mediated and immunomodulation-mediated neuroprotective potential (Guzman, 2009; Janowski et al., 2015).
Structural connectivity changes
Only a few substantial decreases in structural-connectivity strength were observed. These are pronounced between the contralesional sensorimotor cortex and several ipsilesional white matter regions of the CST. The distinct changes in structural networks following stroke are increases in fiber density, specifically in the ipsilateral hemisphere encompassing sensorimotor cortex and CST. This is supported by Reitmeir et al., who reported a substantial axonal sprouting in the CST after stroke in the mouse (Reitmeir et al., 2011). Further, the contralateral S1 has shown increased connection density to the ipsilateral, ischemic sensorimotor cortex. Interestingly, a delayed increased fiber density between the motor cortex and white matter regions, the peduncle, the fornix, and the anterior commissure is seen on the contralateral hemisphere only during the third month. van Meer et al. described structural changes in ischemic rats based only on anisotropy values of diffusion-weighted MRI (van Meer et al., 2010a, 2012). Here, we applied Q-ball imaging to determine fiber-density changes and thereby obtained a more detailed view of long-range structural changes.
The structural network changes appear to be primarily induced by the ischemic event. The engraftment of the stem cells has no substantial modulatory effect on the structural networks in the time window of lasting graft vitality. However, we cannot exclude the possibility that the paracrine effect also acts on the structural connectivity but with a time profile quite different from the one observed for functional connectivity. The difference in response to the engraftment underscores the need to collect information on both structural and functional networks, as both networks may well be decoupled from each other in their response to a pathophysiological event. With this combined, complementary information, researchers will be able to offer fuller explanations for the networks changes affected by the pathophysiological processes.
The weakening of the functional networks, as discussed above, is not due primarily to structural damage between nodes but must rather be explained by a lack of persistent electrical synchronicity associated with a decrease in communication between the affected nodes. These findings also lead us to conclude that under condition of stroke, there is an apparent decoupling between structural and functional networks: structural connectivity damage does not provide a straightforward explanation for findings of weakened or even defective functional connectivity.
Structural and functional network changes influence recovery chances and quality of improvement. However, a comparison of the present functional and structural connectivities with behavioral studies was beyond the scope of the present investigation and will await future studies.
Conclusions
Using state-of-the-art MR imaging we have assessed in great detail for the first time the combination of functional and structural sensorimotor network changes following stroke and after stem cell implantation. Wide-range weakening of the functional networks follows after stroke induction, extending into the contralesional hemisphere and persisting for 3 months. Intracortical implantation of human NSCs leads to an early stabilization of the functional networks, but requires continuing graft vitality for endurance. With cell replacement excluded as a possible reason, stabilization of functional networks was interpreted to be the paracrine effect of stem cell mediation. Major structural network changes are independent of stem cell engraftment and reflect early fiber-density increases between ipsilesional sensorimotor cortex areas and white matter regions forming the CST. The outcome of the structural and functional analysis does not provide a direct correlation of time profiles.
Future investigations will further assess the underlying mechanisms of the long-term functional network stabilization and functional improvement under conditions of preserved stem cell graft vitality.
Footnotes
This work was supported by grants from the EU-FP7 programs TargetBraIn (HEALTH-F2-2012-279017) and BrainPath (PIAPP-GA-2013-612360) and by a grant from the German Research Foundation DFG (AS-464/1-1). We gratefully acknowledge the excellent support of Ulla Uhlenküken for graphical art work and of Melanie Nelles with brain processing for histology.
The authors declare no competing financial interests.
References
- Adamczak JM, Schneider G, Nelles M, Que I, Suidgeest E, van der Weerd L, Löwik C, Hoehn M (2014) In vivo bioluminescence imaging of vascular remodeling after stroke. Front Cell Neurosci 8:274. 10.3389/fncel.2014.00274 [DOI] [PMC free article] [PubMed] [Google Scholar]
- Adamczak J, Aswendt M, Kreutzer C, Rotheneichner P, Riou A, Selt M, Beyrau A, Uhlenküken U, Diedenhofen M, Nelles M, Aigner L, Couillard-Despres S, Hoehn M (2017) Neurogenesis upregulation on the healthy hemisphere after stroke enhances compensation for age-dependent decrease of basal neurogenesis. Neurobiol Dis 99:47–57. 10.1016/j.nbd.2016.12.015 [DOI] [PubMed] [Google Scholar]
- Aswendt M, Adamczak J, Couillard-Despres S, Hoehn M (2013) Boosting bioluminescence neuroimaging: an optimized protocol for brain studies. PloS One 8:e55662. 10.1371/journal.pone.0055662 [DOI] [PMC free article] [PubMed] [Google Scholar]
- Bacigaluppi M, Pluchino S, Peruzzotti-Jametti L, Jametti LP, Kilic E, Kilic U, Salani G, Brambilla E, West MJ, Comi G, Martino G, Hermann DM (2009) Delayed postischemic neuroprotection following systemic neural stem cell transplantation involves multiple mechanisms. Brain 132:2239–2251. 10.1093/brain/awp174 [DOI] [PubMed] [Google Scholar]
- Bacigaluppi M, Russo GL, Peruzzotti-Jametti L, Rossi S, Sandrone S, Butti E, De Ceglia R, Bergamaschi A, Motta C, Gallizioli M, Studer V, Colombo E, Farina C, Comi G, Politi LS, Muzio L, Villani C, Invernizzi RW, Hermann DM, Centonze D, et al. (2016) Neural stem cell transplantation induces stroke recovery by upregulating glutamate transporter GLT-1 in astrocytes. J Neurosci 36:10529–10544. 10.1523/JNEUROSCI.1643-16.2016 [DOI] [PMC free article] [PubMed] [Google Scholar]
- Basser PJ, Pajevic S, Pierpaoli C, Duda J, Aldroubi A (2000) In vivo fiber tractography using DT-MRI data. Magnet Reson Med 44:625–632. [DOI] [PubMed] [Google Scholar]
- Bauer AQ, Kraft AW, Wright PW, Snyder AZ, Lee JM, Culver JP (2014) Optical imaging of disrupted functional connectivity following ischemic stroke in mice. Neuroimage 99:388–401. 10.1016/j.neuroimage.2014.05.051 [DOI] [PMC free article] [PubMed] [Google Scholar]
- Buetefisch CM. (2015) Role of the contralesional hemisphere in post-stroke recovery of upper extremity motor function. Front Neurol 6:214. 10.3389/fneur.2015.00214 [DOI] [PMC free article] [PubMed] [Google Scholar]
- Carter AR, Astafiev SV, Lang CE, Connor LT, Rengachary J, Strube MJ, Pope DL, Shulman GL, Corbetta M (2010) Resting interhemispheric functional magnetic resonance imaging connectivity predicts performance after stroke. Ann Neurol 67:365–375. 10.1002/ana.21905 [DOI] [PMC free article] [PubMed] [Google Scholar]
- Chen J, Sanberg PR, Li Y, Wang L, Lu M, Willing AE, Sanchez-Ramos J, Chopp M (2001) Intravenous administration of human umbilical cord blood reduces behavioral deficits after stroke in rats. Stroke 32:2682–2688. 10.1161/hs1101.098367 [DOI] [PubMed] [Google Scholar]
- Cox RWAJ, Brown H, Fissell K, Haselgrove C, Holmes CJ, Lancasster JL, Rex DE, Smith SM, Woodward JB, Strother SC, Jenkinson M (2004) A (sort of) new image data format standard: NIfTI-1. Paper presented at 10th Annual Meeting of the Organisation of Human Brain Mapping, Budapest, January. [Google Scholar]
- Descoteaux M, Angelino E, Fitzgibbons S, Deriche R (2007) Regularized, fast, and robust analytical Q-ball imaging. Magnet Reson Med 58:497–510. 10.1002/mrm.21277 [DOI] [PubMed] [Google Scholar]
- Doeppner TR, Traut V, Heidenreich A, Kaltwasser B, Bosche B, Bähr M, Hermann DM (2017) Conditioned medium derived from neural progenitor cells induces long-term post-ischemic neuroprotection, sustained neurological recovery, neurogenesis, and angiogenesis. Mol Neurobiol 54:1531–1540. 10.1007/s12035-016-9748-y [DOI] [PubMed] [Google Scholar]
- Doerr J, Schwarz MK, Wiedermann D, Leinhaas A, Jakobs A, Schloen F, Schwarz I, Diedenhofen M, Braun NC, Koch P, Peterson DA, Kubitschek U, Hoehn M, Brüstle O (2017) Whole-brain 3D mapping of human neural transplant innervation. Nat Commun 8:14162. 10.1038/ncomms14162 [DOI] [PMC free article] [PubMed] [Google Scholar]
- Dorr AE, Lerch JP, Spring S, Kabani N, Henkelman RM (2008) High resolution three-dimensional brain atlas using an average magnetic resonance image of 40 adult C57BL/6J mice. Neuroimage 42:60–69. 10.1016/j.neuroimage.2008.03.037 [DOI] [PubMed] [Google Scholar]
- Grandjean J, Schroeter A, Batata I, Rudin M (2014) Optimization of anesthesia protocol for resting-state fMRI in mice based on differential effects of anesthetics on functional connectivity patterns. Neuroimage 102:838–847. 10.1016/j.neuroimage.2014.08.043 [DOI] [PubMed] [Google Scholar]
- Guzman R. (2009) Cellular stroke therapy: from cell replacement to trophic support. Expert Rev Cardiovasc Ther 7:1187–1190. 10.1586/erc.09.121 [DOI] [PubMed] [Google Scholar]
- Hamzei Taj S, Kho W, Riou A, Wiedermann D, Hoehn M (2016) MiRNA-124 induces neuroprotection and functional improvement after focal cerebral ischemia. Biomaterials 91:151–165. 10.1016/j.biomaterials.2016.03.025 [DOI] [PubMed] [Google Scholar]
- Janowski M, Wagner DC, Boltze J (2015) Stem cell-based tissue replacement after stroke: factual necessity or notorious fiction? Stroke 46:2354–2363. 10.1161/STROKEAHA.114.007803 [DOI] [PMC free article] [PubMed] [Google Scholar]
- Jenkinson M, Bannister P, Brady M, Smith S (2002) Improved optimization for the robust and accurate linear registration and motion correction of brain images. Neuroimage 17:825–841. 10.1006/nimg.2002.1132 [DOI] [PubMed] [Google Scholar]
- Kalthoff D, Seehafer JU, Po C, Wiedermann D, Hoehn M (2011) Functional connectivity in the rat at 11.7T: impact of physiological noise in resting state fMRI. Neuroimage 54:2828–2839. 10.1016/j.neuroimage.2010.10.053 [DOI] [PubMed] [Google Scholar]
- Kuo LW, Chen JH, Wedeen VJ, Tseng WY (2008) Optimization of diffusion spectrum imaging and Q-ball imaging on clinical MRI system. Neuroimage 41:7–18. 10.1016/j.neuroimage.2008.02.016 [DOI] [PubMed] [Google Scholar]
- Ma Y, Shaik MA, Kozberg MG, Kim SH, Portes JP, Timerman D, Hillman EM (2016) Resting-state hemodynamics are spatiotemporally coupled to synchronized and symmetric neural activity in excitatory neurons. Proc Natl Acad Sci U S A 113:E8463–E8471. 10.1073/pnas.1525369113 [DOI] [PMC free article] [PubMed] [Google Scholar]
- Minnerup J, Kim JB, Schmidt A, Diederich K, Bauer H, Schilling M, Strecker JK, Ringelstein EB, Sommer C, Schöler HR, Schäbitz WR (2011) Effects of neural progenitor cells on sensorimotor recovery and endogenous repair mechanisms after photthrombotic stroke. Stroke 42:1757–1763. 10.1161/STROKEAHA.110.599282 [DOI] [PubMed] [Google Scholar]
- Oki K, Tatarishvili J, Wood J, Koch P, Wattananit S, Mine Y, Monni E, Tornero D, Ahlenius H, Ladewig J, Brüstle O, Lindvall O, Kokaia Z (2012) Human-induced pluripotent stem cells form functional neurons and improve recovery after grafting in stroke-damaged brain. Stem Cells 30:1120–1133. 10.1002/stem.1104 [DOI] [PubMed] [Google Scholar]
- Park CH, Chang WH, Ohn SH, Kim ST, Bang OY, Pascual-Leone A, Kim YH (2011) Longitudinal changes of resting-state functional connectivity during motor recovery after stroke. Stroke 42:1357–1362. 10.1161/STROKEAHA.110.596155 [DOI] [PMC free article] [PubMed] [Google Scholar]
- Ramos-Cabrer P, Justicia C, Wiedermann D, Hoehn M (2010) Stem cell mediation of functional recovery after stroke in the rat. PloS One 5:e12779. 10.1371/journal.pone.0012779 [DOI] [PMC free article] [PubMed] [Google Scholar]
- Reitmeir R, Kilic E, Kilic U,Bacigaluppi M, ElAli A, Salani G, Pluchino S, Gassmann M, Hermann DM (2011) Post-acute delivery of erythropoietin induces stroke recovery by promoting perilesional tissue remodelling and contralesional pyramidal tract plasticity. Brain 134:84–99. 10.1093/brain/awq344 [DOI] [PubMed] [Google Scholar]
- Reitmeir R, Kilic E, Reinboth BS, Guo Z, ElAli A, Zechariah A, Kilic Ü, Hermann DM (2012) Vascular endothelial growth factor induces contralesional corticobulbar plasticity and functional neurological recovery in the ischemic brain. Acta Neuropathologica 123:273–284. 10.1007/s00401-011-0914-z [DOI] [PubMed] [Google Scholar]
- Smith SM. (2002) Fast robust automated brain extraction. Hum Brain Mapp 17:143–155. 10.1002/hbm.10062 [DOI] [PMC free article] [PubMed] [Google Scholar]
- Smith SM, Brady JM (1997) SUSAN—a new approach to low level image processing. Int J Comput Vis 23:45–78. 10.1023/A:1007963824710 [DOI] [Google Scholar]
- Tennstaedt A, Aswendt M, Adamczak J, Collienne U, Selt M, Schneider G, Henn N, Schaefer C, Lagouge M, Wiedermann D, Kloppenburg P, Hoehn M (2015) Human neural stem cell intracerebral grafts show spontaneous early neuronal differentiation after several weeks. Biomaterials 44:143–154. 10.1016/j.biomaterials.2014.12.038 [DOI] [PubMed] [Google Scholar]
- Tornero D, Wattananit S, Grønning Madsen M, Koch P, Wood J, Tatarishvili J, Mine Y, Ge R, Monni E, Devaraju K, Hevner RF, Brüstle O, Lindvall O, Kokaia Z (2013) Human induced pluripotent stem cell-derived cortical neurons integrate in stroke-injured cortex and improve functional recovery. Brain 136:3561–3577. 10.1093/brain/awt278 [DOI] [PubMed] [Google Scholar]
- Tornero D, Tsupykov O, Granmo M, Rodriguez C, Grønning-Hansen M, Thelin J, Smozhanik E, Laterza C, Wattananit S, Ge R, Tatarishvili J, Grealish S, Brüstle O, Skibo G, Parmar M, Schouenborg J, Lindvall O, Kokaia Z (2017) Synaptic inputs from stroke-injured brain to grafted human stem cell-derived neurons activated by sensory stimuli. Brain 140:692–706. 10.1093/brain/aww347 [DOI] [PubMed] [Google Scholar]
- Tuch DS. (2004) Q-Ball imaging. Magnet Reson Med 52:1358–1372. 10.1002/mrm.20279 [DOI] [PubMed] [Google Scholar]
- Tuch DS, Reese TG, Wiegell MR, Wedeen VJ (2003) Diffusion MRI of complex neural architecture. Neuron 40:885–895. 10.1016/S0896-6273(03)00758-X [DOI] [PubMed] [Google Scholar]
- Ullmann JF, Watson C, Janke AL, Kurniawan ND, Reutens DC (2013) A segmentation protocol and MRI atlas of the C57BL/6J mouse neocortex. Neuroimage 78:196–203. 10.1016/j.neuroimage.2013.04.008 [DOI] [PubMed] [Google Scholar]
- van Meer MP, van der Marel K, Wang K, Otte WM, El Bouazati S, Roeling TA, Viergever MA, Berkelbach van der Sprenkel JW, Dijkhuizen RM (2010a) Recovery of sensorimotor function after experimental stroke correlates with restoration of resting-state interhemispheric functional connectivity. J Neurosci 30:3964–3972. 10.1523/JNEUROSCI.5709-09.2010 [DOI] [PMC free article] [PubMed] [Google Scholar]
- van Meer MP, van der Marel K, Otte WM, Berkelbach van der Sprenkel JW, Dijkhuizen RM (2010b) Correspondence between altered functional and structural connectivity in the contralesional sensorimotor cortex after unilateral stroke in rats: a combined resting-state functional MRI and manganese-enhanced MRI. J Cereb Blood Flow Metab 30:1707–1711. 10.1038/jcbfm.2010.124 [DOI] [PMC free article] [PubMed] [Google Scholar]
- van Meer MP, Otte WM, van der Marel K, Nijboer CH, Kavelaars A, Berkelbach van der Sprenkel JW, Viergever MA, Dijkhuizen RM (2012) Extent of bilateral neuronal network reorganization and functional recovery in relation to stroke severity. J Neurosci 32:4495–4507. 10.1523/JNEUROSCI.3662-11.2012 [DOI] [PMC free article] [PubMed] [Google Scholar]
- Volz LJ, Rehme AK, Michely J, Nettekoven C, Eickhoff SB, Fink GR, Grefkes C (2016) Shaping early reorganization of neural networks promotes motor function after stroke. Cereb Cortex 26:2882–2894. 10.1093/cercor/bhw034 [DOI] [PMC free article] [PubMed] [Google Scholar]
- Xu H, Qin W, Chen H, Jiang L, Li K, Yu C (2014) Contribution of the resting-state functional connectivity of the contralesional primary sensorimotor cortex to motor recovery after subcortical stroke. PloS One 9:e84729. 10.1371/journal.pone.0084729 [DOI] [PMC free article] [PubMed] [Google Scholar]