

Abstract
Glutamate transporter 1 (GLT1) is the main astrocytic transporter that shapes glutamatergic transmission in the brain. However, whether this transporter modulates sleep–wake regulatory neurons is unknown. Using quantitative immunohistochemical analysis, we assessed perisomatic GLT1 apposition with sleep–wake neurons in the male rat following 6 h sleep deprivation (SD) or following 6 h undisturbed conditions when animals were mostly asleep (Rest). We found that SD decreased perisomatic GLT1 apposition with wake-promoting orexin neurons in the lateral hypothalamus compared with Rest. Reduced GLT1 apposition was associated with tonic presynaptic inhibition of excitatory transmission to these neurons due to the activation of Group III metabotropic glutamate receptors, an effect mimicked by a GLT1 inhibitor in the Rest condition. In contrast, SD resulted in increased GLT1 apposition with sleep-promoting melanin-concentrating hormone (MCH) neurons in the lateral hypothalamus. Functionally, this decreased the postsynaptic response of MCH neurons to high-frequency synaptic activation without changing presynaptic glutamate release. The changes in GLT1 apposition with orexin and MCH neurons were reversed after 3 h of sleep opportunity following 6 h SD. These SD effects were specific to orexin and MCH neurons, as no change in GLT1 apposition was seen in basal forebrain cholinergic or parvalbumin-positive GABA neurons. Thus, within a single hypothalamic area, GLT1 differentially regulates excitatory transmission to wake- and sleep-promoting neurons depending on sleep history. These processes may constitute novel astrocyte-mediated homeostatic mechanisms controlling sleep–wake behavior.
SIGNIFICANCE STATEMENT Sleep–wake cycles are regulated by the alternate activation of sleep- and wake-promoting neurons. Whether and how astrocytes can regulate this reciprocal neuronal activity are unclear. Here we report that, within the lateral hypothalamus, where functionally opposite wake-promoting orexin neurons and sleep-promoting melanin-concentrating hormone neurons codistribute, the glutamate transporter GLT1, mainly present on astrocytes, distinctly modulates excitatory transmission in a cell-type-specific manner and according to sleep history. Specifically, GLT1 is reduced around the somata of orexin neurons while increased around melanin-concentrating hormone neurons following sleep deprivation, resulting in different forms of synaptic plasticity. Thus, astrocytes can fine-tune the excitability of functionally discrete neurons via glutamate transport, which may represent novel regulatory mechanisms for sleep.
Keywords: astrocyte, basal forebrain, confocal microscopy, lateral hypothalamus, patch-clamp recording, synaptic plasticity
Introduction
Research on the regulation of sleep–wake behavior historically focused on neurons, resulting in detailed knowledge of the neuronal systems regulating sleep and wake states under homeostatic and circadian influences (Saper et al., 2010; Weber and Dan, 2016). Increasing evidence, however, has implicated glia, particularly astrocytes, in sleep regulation. Astrocytes regulate extracellular levels of adenosine, an endogenous sleep-promoting factor in the brain (Porkka-Heiskanen et al., 1997), by releasing its precursor ATP (Pascual et al., 2005) and by metabolizing adenosine via astrocytic adenosine kinase (Bjorness et al., 2016). Extracellular adenosine levels increase after sleep deprivation (SD) in the basal forebrain (BF) (Porkka-Heiskanen et al., 1997; Halassa et al., 2009), where adenosine reduces the excitability of cholinergic and GABAergic BF neurons that project to the cerebral cortex, thereby dampening cortical activation (Arrigoni et al., 2006; Yang et al., 2013). Astrocytes also play a causal role in shifting neocortical neuronal activity to synchronized slow oscillations, a hallmark of slow-wave sleep, by altering extracellular glutamate levels (Poskanzer and Yuste, 2016). These studies have established astrocytes as a key component of the sleep–wake regulatory system.
While these forms of astrocytic regulation appear rather nonspecific in terms of neuronal effects, astrocytes can also fine-tune single synapses in several ways (Araque et al., 2014; Gundersen et al., 2015), for example, through glutamate reuptake via high-affinity glutamate transporters, such as glutamate transporter 1 (GLT1) (Oliet et al., 2001; Pannasch et al., 2014). GLT1 regulates glutamate diffusion and spillover, thus controlling the activation of synaptic and extrasynaptic glutamate receptors, heterosynaptic signaling, and synaptic plasticity (Oliet et al., 2001; Marcaggi et al., 2003; Huang et al., 2004; Genoud et al., 2006; Omrani et al., 2009). However, the possibility that GLT1 is involved in regulating neuronal activity patterns associated with the sleep–wake cycle or in sleep homeostasis had not been investigated.
To address this question, we focused on the lateral hypothalamus (LH), which houses two intermingled populations of peptidergic neurons with opposite roles in sleep–wake regulation. Orexin (ORX; also known as hypocretin) neurons are active during spontaneous or forced wake periods and silent during sleep, and their activation promotes wakefulness (Lee et al., 2005; Modirrousta et al., 2005; Adamantidis et al., 2007). In contrast, melanin-concentrating hormone (MCH) neurons are active during rapid eye movement (REM) sleep, and quiescent during wake or SD (Modirrousta et al., 2005; Hassani et al., 2009a). Their activation promotes REM sleep (Jego et al., 2013; Tsunematsu et al., 2014; Vetrivelan et al., 2016) or both non-REM and REM sleep (Konadhode et al., 2013; Blanco-Centurion et al., 2016). The reciprocal activity patterns of these two functionally opposing cell groups may be coordinated by local mechanisms.
Thus, in the present study, we tested the hypothesis that astrocytic GLT1 differentially regulates excitatory synaptic inputs to ORX and MCH neurons according to sleep need, thereby coordinating their reciprocal activity patterns, using immunoconfocal microscopy and in vitro electrophysiology. For comparison, our confocal analysis included cholinergic and parvalbumin (PV)-expressing GABAergic neurons in the BF, both of which are active during wakefulness and REM sleep, and promote cortical activation (Duque et al., 2000; Manns et al., 2000; Hassani et al., 2009a; Anaclet et al., 2015; Kim et al., 2015). To the best of our knowledge, this is the first study to address the role of glutamate transport in the synaptic regulation of sleep–wake-regulatory neurons.
Materials and Methods
Ethics.
All animal handling procedures were conducted in accordance with the Canadian Council on Animal Care and were approved by the Dalhousie University Committee on Laboratory Animals (immunoconfocal study) and by the Memorial University Institutional Animal Care Committee (electrophysiological study).
Immunohistochemistry.
A total of 36 adult male Wistar rats (225–250 g; Charles River) were used in these experiments. On arrival, animals were housed in pairs in a colony room for 1 week and then in individual experimental chambers for 3–4 d of habituation. Throughout the experiment, rats were kept under a 12 h light/12 h dark cycle (lights on at 07:00), and food and water were available ad libitum.
On the experimental day at 09:00, rats were randomly assigned to 1 of 4 behavioral treatment groups: undisturbed for 6 h of sleep opportunity (Rest, R; n = 12); 6 h of SD (n = 12); 9 h of sleep opportunity (R9 h; n = 6); and 6 h of SD followed by 3 h of sleep opportunity (Recovery; n = 6). SD was conducted by gentle handling, a commonly used SD method that minimizes stress. Briefly, gentle handling interventions consisted of presenting the rat with novel objects, such as a new toy, or rustling its bedding when the rat closed its eyes or assumed a sleeping posture (Deurveilher et al., 2009). The first two groups were killed immediately at 15:00. The last two groups were killed immediately at 18:00. Animals were injected with an overdose of an anesthetic mixture (208 mg/kg ketamine, 9.6 mg/kg xylazine, and 1.8 mg/kg acepromazine, i.p.), and perfused intracardially with 100 ml of 0.1 m PBS, pH 7.4, followed by 400 ml of 4% PFA in 0.1 m PBS. The brains were quickly removed, postfixed for 2 h, and then placed in 30% sucrose in 0.01 m PBS for a minimum of 2 d at 4°C. Coronal brain sections (30 μm) through the BF (from bregma to 1.5 mm posterior to it) and the LH (from 2.5 mm to 3.5 mm posterior to bregma) were cut on a freezing microtome.
All immunohistochemical processing was conducted using 0.05 M Tris-buffered saline containing 0.03% Triton X-100 and, in case of primary antibody incubation, 0.01% sodium azide. Immunohistochemical processing of BF sections additionally included 2% normal donkey serum, which was omitted in LH tissue processing to optimize subsequent Nissl Neurotrace (see below). BF section sets were first incubated with a polyclonal anti-GLT1 antibody (1:2000; Table 1) overnight at room temperature or for 2 d at 4°C, followed by Cy3-conjugated donkey anti-guinea pig IgG (1:200) for 1–2 h at room temperature. This anti-GLT1 antibody was raised against a synthetic peptide from the C terminus of rat GLT1, an area containing no sequence homology with glutamate transporters GLAST or EAAT3 (Arriza et al., 1994). As summarized in Table 1, the specificity of this antibody has previously been established by Western blot (Redecker and Pabst, 2000; Lee et al., 2014; Roberts et al., 2014; Schreiner et al., 2014), preabsorption (Redecker and Pabst, 2000; Lee et al., 2014; Roberts et al., 2014), and using GLT1 knock-out mouse tissue (Schreiner et al., 2014).
Table 1.
Primary antibodies used for immunohistochemistry
| Antigen | Host | Source | Immunogen | Specificity |
|---|---|---|---|---|
| GLT1 | Guinea pig | EMD Millipore Catalog #AB1783 RRID:AB_90949 | Last 20 residues of (Mars et al., 2001; Chung et al., 2008; Leung et al., 2012; Schreiner et al., 2013; Schreiner et al. 2014), or a peptide from (MTI), the C terminus of rat GLT1 | Western blot analysis showed a band at 50–70 kDa corresponding to GLT1 (MTI) (Redecker and Pabst, 2000; Lee et al., 2014; Roberts et al., 2014; Schreiner et al., 2014). Preabsorption with the immunogenpeptide abolished immunostaining (MTI) (Redecker and Pabst, 2000; Lee et al., 2014) or the corresponding band on the western blot (Lee et al., 2014; Roberts et al., 2014), while preincubation with a peptide from the C-terminus region of excitatory amino acid transporter 1 had no effect on the immunostaining (Redecker and Pabst, 2000). No staining on GLT1 null mouse tissue (Schreiner et al., 2014). |
| ORX A | Goat | Santa Cruz Biotechnology Catalog #sc-8070 RRID:unavailable | A peptide from the C terminus of human orexin A (MTI; residues 48–66 of the precursor peptide (Henny and Jones, 2006)) | Western blot analysis confirmed specificity for rat, mouse, and human orexin A (MTI). Preabsorption with the immunogen peptide (sc-8070P) (Henny and Jones, 2006) or orexin A (Phoenix) (Glavas et al., 2008) abolished all immunostaining. |
| MCH | Rabbit | Phoenix Pharmaceuticals Catalog #H-070-47 RRID:AB_10013632 | Full-length MCH peptide (19 amino acids) | Competitive radioimmunoassay showed 100% crossreactivity with human, rat, and mouse MCH and 0% crossreactivity with orexin A and B (MTI) (Glavas et al., 2008). Preabsorption with full-length MCH peptide (Phoenix) abolished all staining (Glavas et al., 2008). |
| ChAT | Goat | EMD Millipore Catalog #AB144P RRID:AB_2079751 | Human placental ChAT (identical to human brain ChAT) (Bruce et al., 1985)) | Western blot analysis showed a band at 68–70 kDa corresponding to ChAT (MTI) (Corcoran et al., 2004). Preabsorption with recombinant rat ChAT (Chemicon AG220) abolished staining (Llewellyn-Smith et al., 2007; Márquez-Ruiz et al., 2007; Morcuende et al., 2011). Identical pattern of staining with another well-characterized ChAT antibody (Umbriaco et al., 1994) was confirmed with double immunofluorescence (Nickerson Poulin et al., 2006). |
| PV | Mouse monoclonal (clone PARV-19) | Sigma-Aldrich Catalog #P3088 RRID:AB_477329 | Frog muscle PV | Western blot analysis showed a single band at ∼12 kDa corresponding to PV (MTI). Preabsorption with rat muscle PV eliminated labeling in Western blots and immunostaining (Hackney et al., 2005). Identical pattern of staining with R301 below was confirmed in our lab with double immunofluorescence. |
| PV | Rabbit | Dr. K.G. Baimbridge (University of British Columbia) Catalog #R301 | Rat muscle PV | Preabsorption with rat muscle PV abolished staining (Sloviter, 1989). Identical pattern of staining with PARV-19 above was confirmed in our lab with double immunofluorescence. |
MTI, Manufacturer's technical information.
Next, as the second label, adjacent BF sets were incubated overnight at room temperature or for 2 d at 4°C with (1) a polyclonal anti-ChAT antibody (1:50; Table 1); or (2) either a monoclonal mouse anti-PV antibody (1:800; Table 1) or a rabbit anti-PV antibody (1:100; Table 1). ChAT was used as a marker for cholinergic BF neurons that project to the cortex, whereas PV was used as a marker for a cortically projecting subset of GABAergic BF neurons (Yang et al., 2017). Sections were subsequently incubated for 1–2 h at room temperature with either a Cy2 (1:100) or Dylight 488-conjugated donkey anti-goat IgG (1:200), a Cy2-conjugated donkey anti-mouse IgG (1:100), or a Cy2-conjugated donkey anti-rabbit IgG (1:100), as appropriate.
LH section sets were first processed to visualize GLT1, as described above. As the second label, adjacent LH sets were then incubated overnight at room temperature or for 2 d at 4°C with either a polyclonal anti-ORX A antibody (1:300; Table 1) or a polyclonal anti-MCH antibody (1:1500; Table 1). Sections were subsequently incubated for 1–2 h at room temperature with either a Cy2 (1:100) or Dylight 488-conjugated donkey anti-goat IgG antibody (1:200), or a Cy2 (1:100) or Dylight 488-conjugated donkey anti-rabbit IgG antibody (1:200), as appropriate. All LH sections were incubated for a further 20 min with Nissl Neurotrace Deep-Red fluorescent stain (1:75; N-21483, RRID:unavailable; Invitrogen), which clearly and reliably stains the entire neuronal soma (Cronk et al., 2012; Derecki et al., 2012).
Fluorescent Nissl stain was used for LH neurons to facilitate the delineation of the cell body perimeter. Immunoreactivity for ORX A and MCH was not homogeneously present in the cytoplasm under the current experimental conditions and tended to be denser near the nucleus (Figs. 1A–C, 2A1,B1). The globular appearance of the immunoreactivity is expected because secretory neuropeptides, such as ORX A and MCH, are synthesized and localized within the lumen of organelles of the secretory pathway, including the Golgi apparatus and dense core granules (Bittencourt et al., 1992; Peyron et al., 1998; Jancsik et al., 2018). In contrast, no Nissl stain was required for BF neurons, as both ChAT and PV diffusely and uniformly filled the cytoplasm, unambiguously delineating cell body boundaries (Fig. 2C1,D1). This is consistent with previous observations using immunoelectron microscopy (e.g., Martinez-Murillo et al., 1990; Gaykema and Zaborszky, 1997).
Figure 1.
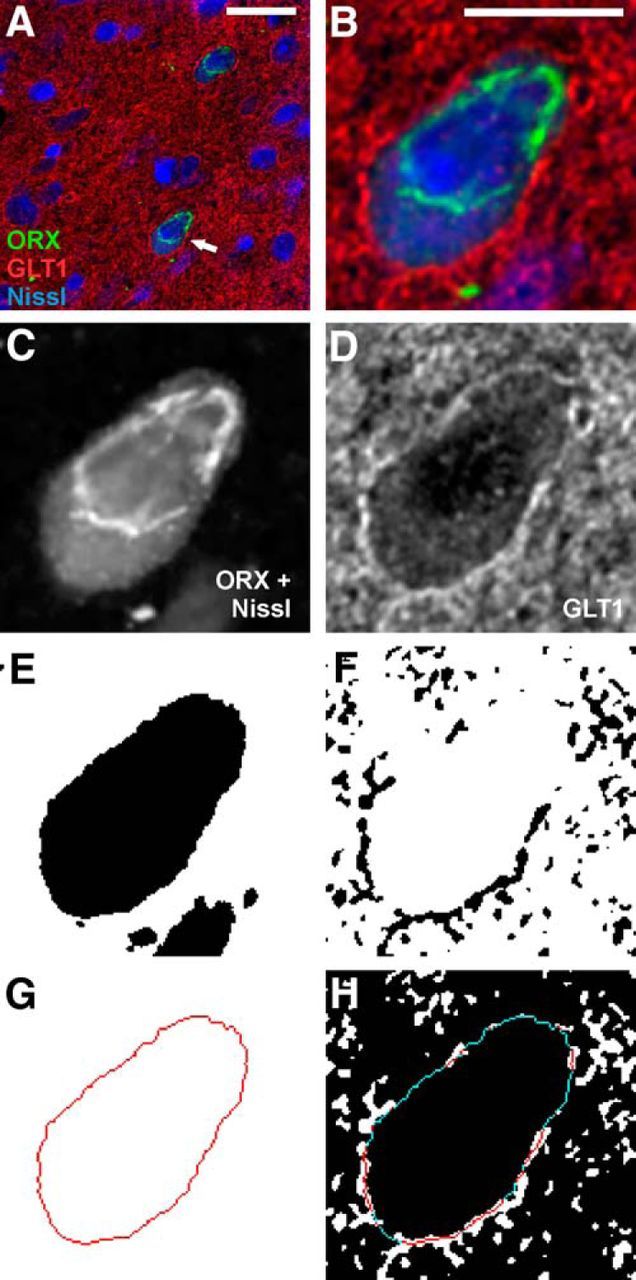
Image analysis procedures for GLT1 apposition. A, A triple-fluorescence image showing two fluorescent Nissl-stained neurons (blue) that are immunopositive for ORX A peptide (ORX, green), surrounded by GLT1 immunoreactivity (red). Arrow indicates the neuron shown in B–G. Scale bar, 20 μm. B, Larger image of ORX neuron from A. Scale bar, 10 μm. C, E, G, Grayscale image of the somatic markers (combined ORX A and fluorescent Nissl). C, Converted to a binary image, where black pixels represent areas positive for fluorescence (E). This binary image is used to generate a 1-pixel-wide outline that delineates the neuronal soma (G). D, F, Grayscale image of GLT1 immunoreactivity (D) is converted to a binary image (F). H, The somatic outline in G is superimposed onto the binary image of GLT1 immunoreactivity in F, revealing the portions of the somatic perimeter in direct apposition (i.e., without any pixel gap) with GLT1 (red) and those that are not (blue).
Figure 2.
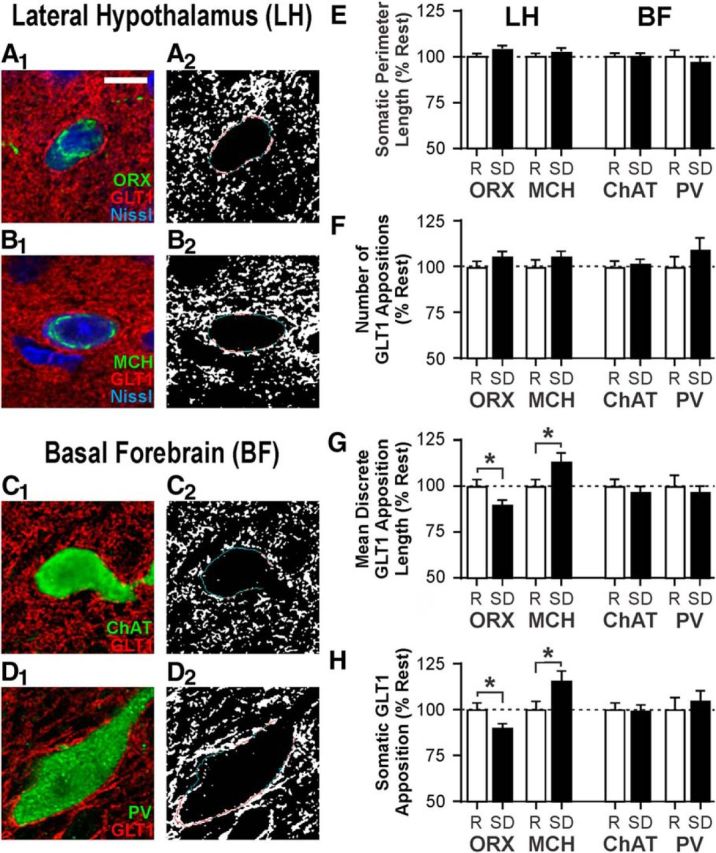
SD alters perisomatic GLT1 distribution in LH but not BF neurons. A1–D1, Representative fluorescence images of ORX (A1), MCH (B1), cholinergic (ChAT; C1), and PV neurons (D1) costained for GLT-1 and, where applicable, Nissl. Scale bar, 10 μm. A2, B2, C2, D2, Binary images of GLT1 fluorescence with the somatic outline of cells shown in A1–D1. Red lines indicates the portions where GLT1 and soma are apposed. Blue lines indicates portions where there is no apposition. Total somatic perimeter length (E) and number of discrete GLT1 appositions (F) are unaffected by sleep state. Opposite changes are seen following SD in ORX versus MCH neurons in mean length of individual GLT1 appositions (G) and the proportion of total somatic perimeter in apposition with GLT1 (H). No change in any of these measures is seen in ChAT and PV neurons. Values are normalized to the mean of respective values in the Rest group (indicated by the dashed line at 100%). Absolute values are reported in Table 2. R, Rest condition; SD, 6 h SD. *p < 0.05.
Sections were mounted on glass slides, air dried, and coverslipped with Cytoseal 60 mounting medium (Richard-Allan Scientific). Sections that were processed without primary antibodies to control for the secondary antibodies showed no specific staining.
Confocal imaging.
Immunofluorescent images were acquired with a laser scanning confocal microscope (Zeiss LSM 510 Meta). Separate emission channels were captured sequentially to limit nonspecific fluorescence. Laser power and emission filters were also adjusted to minimize bleed-through artifacts.
Neurons were randomly selected throughout the rostrocaudal extent within the magnocellular preoptic nucleus of the BF and within the LH (dorsomedial to the fornix), respectively, while the experimenter remained blind to the GLT1 fluorescence channel. The magnocellular preoptic nucleus was selected due to significant overlap between ChAT and PV neuron distributions and because it is often targeted as a representative region for studying the neuronal circuit and function of the BF (Yang et al., 2017). LH neurons were selected in the dorsomedial perifornical region of the LH because ORX neurons in the perifornical area may be preferentially involved in arousal, whereas lateral ORX neurons may be involved in reward (Harris and Aston-Jones, 2006). Neurons were included when (1) there was clear somatic immunostaining for the respective cell-type marker, and (2) the nucleus was present. Images were acquired using the ZEN software package (RRID:SCR_013672; Carl Zeiss Meditec). Approximately 10 neurons per cell type were imaged per rat. Labeling was sampled through each neuronal soma by taking 0.4 μm optical slices (z stack) of 1024 × 1024 pixel images. Each pixel measured 130 nm × 130 nm.
Image processing and analysis.
Each image was corrected for electrical noise using the mixed Poisson-Gaussian noise filter plugin, PureDenoise (by F. Luisier; Biomedical Imaging Group; http://bigwww.epfl.ch/algorithms/denoise/) (Luisier et al., 2007, 2011) for ImageJ (RRID:SCR_003070; National Institutes of Health). Image stacks were then deconvolved using a theoretical point-spread function using Huygens Professional (RRID:SCR_014237; Scientific Volume Imaging).
Following deconvolution, one image from each z stack was selected for analysis. The selection criteria were as follows: (1) the location through the middle of the neuronal soma as indicated by a clearly visible nucleus surrounded by visible cytoplasm; and (2) optimal labeling of the relevant neurophenotype marker, GLT1, and, where applicable, Neurotrace Nissl stain. GLT1 apposition was assessed using methods modified from Doucet et al. (2009), and a combination of steps with Adobe Photoshop CS4 (Adobe Systems) and ImageJ (Fig. 1). Briefly, each image was cropped to 400 × 400 pixels with the neuron soma located at the center of the image to limit possible unevenness in immunofluorescence within each image. Grayscale images for cell body markers (the neurochemical marker with or without Neurotrace Nissl stain) and those for GLT1 (Fig. 1C,D) were used to generate independent binary images (Fig. 1E,F). The threshold for positive GLT1 immunoreactivity was selected in a pilot study using a series of thresholds on a random subset of neurons followed by inspection of the resulting images relative to visual impression of the original images by two independent evaluators. The final threshold was set using the following formula:
 |
Next, a 1-pixel (130 nm)-wide cell body outline was generated using the binary images of cell body markers (Fig. 1G). When a dendrite or an axon extending from the soma was present, the cell body outline was discontinued immediately before this outward protrusion. The cell body outline was then superimposed onto the binary GLT1 image, also in a 130 nm pixel resolution (Fig. 1H). Neurons were excluded from analysis if >15% of the pixels within the cell body were immunopositive for GLT1 following thresholding. This cutoff was conservatively selected to eliminate sporadic neuronal cell bodies that appeared to contain fluorescent signal, as GLT1 protein has never been reported in neuronal cell bodies (e.g., Furness et al., 2008). GLT1 and the somatic perimeter were judged to be in apposition when pixels containing respective markers were directly adjacent to each other without any pixel gap. Several measurements were taken using the Simple Neurite Tracer plugin for ImageJ (Longair et al., 2011): total cell perimeter length, number of discrete GLT1 appositions, mean length of discrete GLT1 appositions, and percentage of the total perimeter length in apposition with GLT1 (percentage apposition).
In vitro electrophysiology.
Male Sprague Dawley rats were obtained from the breeding colony at Memorial University or from Charles River. Animals were housed in pairs under a 12 h light/12 h dark cycle (lights on at 08:00) in a colony room. Food and water were available ad libitum. Experiments were performed on brain slices from rats 29–58 d old. A total of 171 cells from 94 rats were included in the analyses reported in this study.
Rats were randomly assigned to one of two behavioral treatment groups at 08:00 and individually housed during behavioral treatment; one group underwent 6 h of sleep opportunity (Rest), and the other was subjected to 6 h of SD by gentle handling as described above for the immunoconfocal study. Both groups were killed immediately after the respective conditions at 14:00 for brain slice generation as follows.
Rats were deeply anesthetized with isoflurane and decapitated, and brains were quickly removed. Coronal brain slices (250 μm thick) through the hypothalamus were cut in ice-cold ACSF containing the following (in mm): 126 NaCl, 2.5 KCl, 1.2 NaH2PO4, 1.2 MgCl2, 18 NaHCO3, 2.5 glucose, and 2 CaCl2. Slices were then incubated in ACSF at 33°C-34°C for 30–45 min and then at room temperature until recording. ACSF was continuously bubbled with O2 (95%) and CO2 (5%). Slices were hemisected before transfer to the recording chamber.
Patch-clamp recordings were performed on hemisected hypothalamic slices superfused with 30°C-34°C ACSF at 2–2.5 ml/min. Under a differential interference contrast microscope (DM LFSA; Leica Microsystems), LH neurons that were located dorsomedial to the fornix and had a soma diameter of 10–20 μm were selected for recording. Recordings were performed using a Multiclamp 700B amplifier and pClamp 10.3 software (Molecular Devices). The whole-cell internal solution contained the following (in mm): 123 K gluconate, 2 MgCl2, 8 KCl, 10 HEPES, 0.2 EGTA, 5 Na2-ATP, and 0.3 Na2-GTP, adjusted to pH 7.29–7.30 with KOH. Biocytin (0.1%–0.2%) was added to the internal solution to label recorded cells. Filled recording electrodes had a tip resistance of 3–7 mΩ.
Once whole-cell access was achieved, a series of hyperpolarizing and depolarizing current steps (300 or 600 ms each) was applied to the cell to characterize its electrophysiological properties. ORX and MCH neurons, which have overlapping anatomical distributions, were tentatively identified by their well-established electrophysiological properties. ORX neurons are spontaneously active and have a uniphasic afterhyperpolarizing potential, a depolarized resting membrane potential, and H-current (Eggermann et al., 2003; Parsons et al., 2012; Linehan et al., 2015). MCH neurons are not spontaneously active in vitro, have a hyperpolarized RMP, lack H-current and rebound depolarization, and display spike-adaptation upon positive current injection (Alberto et al., 2011). A subset of cells was filled with biocytin, and the brain slices were processed for post hoc immunohistochemistry to confirm the neurochemical identity of recorded cells (see Post hoc neurochemical identification).
For EPSC recording, neurons were held at −70 mV and membrane currents were filtered at 1 kHz, digitized at 5–10 kHz, and stored for offline analysis. Picrotoxin (50 μm) was always present in the bath to block GABAA receptors and isolate EPSCs. To evoke EPSCs, a bipolar tungsten-stimulating electrode was placed within the LH, ∼100 μm lateral to the recorded cell. EPSCs were analyzed using Clampfit 10.3 software (RRID:SCR_011323; Molecular Devices). Paired pulses were applied at 25 Hz every 15 s, and paired pulse ratio (PPR) was calculated as the amplitude ratio of EPSC2/EPSC1. The rate of decay (τ) was measured by fitting a single exponential curve to the decay slope of EPSC1. Train stimulation consisted of 20 pulses at 50 Hz every 30 s. The amplitudes of the fast EPSCs with peaks within 10 ms following each pulse were measured. In addition, the amplitude of the slow EPSC subsequent to train stimulation was measured at 25 ms after the final stimulation artifact, and the area of the slow EPSC was measured over the following 750 ms. A 20 mV hyperpolarizing pulse (100 ms) was applied every 15–30 s, and the capacitive currents were monitored as measures of series/access resistance. Cells that showed significant change (>20%) in this parameter during electrophysiological recordings were excluded from analysis.
Recordings were performed during the remainder of the light phase and were discontinued before the beginning of the dark phase at 20:00. Neither time since dissection nor age of the rat was correlated with measures in this study (data not shown).
Post hoc neurochemical identification.
Immediately following electrophysiological recording, brain slices containing biocytin-filled cells were fixed in 10% formalin for >24 h at 4°C. To confirm the transmitter phenotypes of recorded cells, fixed slices were individually incubated with a mixture of goat anti-ORX A (1:2000; Table 1) and rabbit anti-MCH (1:2000; Table 1) antibodies for 3 d at 4°C. Next, slices were incubated with secondary antibodies (1:500; Alexa 594-conjugated donkey anti-goat IgG, and Alexa 488-conjugated donkey anti-rabbit IgG) as well as Alexa 350-conjugated streptavidin to visualize biocytin in recorded cells. Stained slices were examined with an epifluorescence microscope to determine colocalization of ORX A or MCH with biocytin. Fluorescent biocytin labeling was identified in 131 of 171 recorded neurons. The electrophysiological phenotype was confirmed by post hoc immunofluorescence in 99.2% of these biocytin-filled neurons (130 of 131). In one case, the immunohistochemical labeling was ambiguous.
Drugs.
All drugs were bath-perfused at final concentrations indicated, by diluting stock solutions in the ACSF immediately before use. Picrotoxin and biocytin were purchased from Sigma Aldrich, and dihydrokainate (DHK), (RS)-α-Cyclopropyl-4-phosphonophenylglycine (CPPG), and l-AP4 from Tocris Bioscience.
Experimental design and statistical analysis.
Detailed experimental designs of both immunoconfocal and electrophysiological studies are described in Materials and Methods, and Results, including the number of animals used and cells included in the analyses. These numbers were based on our previous studies and standard practices in the field.
Comparisons of morphological measures from immunoconfocal images were conducted using unpaired t tests (Rest vs SD). For electrophysiology, a paired t test or a one-way or two-way repeated-measures ANOVA was used to compare the drug effect to baseline as appropriate. For group comparisons of drug effects, the drug effect was normalized to its respective baseline before comparison by independent t test or a one-way ANOVA. No more than 2 cells per rat were included in any one drug treatment group. The Holm–Sidak post hoc test was used for all multiple comparisons. Statistical analyses were conducted with Prism 6 (RRID:SCR_002798; GraphPad Software). p values <0.05 were considered statistically significant. Values are expressed as mean ± SEM.
Results
Acute SD bidirectionally and reversibly alters perisomatic GLT1 apposition with ORX and MCH neurons
With confocal microscopy, we examined the effect of acute (6 h) SD on the juxtaposition of GLT1 with wake-active ORX and sleep-active MCH neurons in the LH, and wake/REM sleep-active cholinergic (ChAT) and PV-containing GABAergic neurons in the BF. GLT1 immunoreactivity was present in juxtaposition with every soma from all four neuronal populations (e.g., Fig. 2A–D). Values normalized to the Rest condition are reported below. Absolute values are reported in Table 2, with identical statistical results to the normalized values, as expected.
Table 2.
Measures of GLT1 apposition with sleep–wake regulatory neurons by sleep-history condition: 6 h of Rest or 6 h of SDa
| Variable | Rest |
SD |
p | ||||
|---|---|---|---|---|---|---|---|
| Mean | SEM | n | Mean | SEM | n | ||
| ORX neurons | |||||||
| Somatic perimeter length (μm) | 49.97 | 0.84 | 102 | 52.22 | 0.82 | 135 | 0.060 |
| No. of GLT1 appositions | 20.20 | 0.57 | 102 | 21.32 | 0.53 | 135 | 0.153 |
| Mean discrete GLT1 apposition length (μm) | 0.96 | 0.04 | 101b | 0.87 | 0.02 | 135 | 0.025 |
| GLT1 apposition (% somatic perimeter) | 39.21 | 1.48 | 102 | 35.24 | 1.02 | 135 | 0.023 |
| MCH neurons | |||||||
| Somatic perimeter length (μm) | 47.69 | 0.89 | 100 | 49.07 | 0.85 | 111 | 0.266 |
| No. of GLT1 appositions | 17.33 | 0.63 | 100 | 18.25 | 0.51 | 111 | 0.254 |
| Mean discrete GLT1 apposition length (μm) | 0.74 | 0.03 | 100 | 0.84 | 0.04 | 111 | 0.027 |
| GLT1 apposition (% somatic perimeter) | 27.03 | 1.23 | 100 | 31.34 | 1.37 | 111 | 0.021 |
| ChAT neurons | |||||||
| Somatic perimeter length (μm) | 53.34 | 1.03 | 100 | 53.48 | 0.87 | 123 | 0.918 |
| No. of GLT1 appositions | 17.87 | 0.53 | 100 | 18.09 | 0.47 | 123 | 0.758 |
| Mean discrete GLT1 apposition length (μm) | 0.97 | 0.04 | 99b | 0.94 | 0.03 | 121b | 0.498 |
| GLT1 apposition (% somatic perimeter) | 32.36 | 1.25 | 100 | 32.11 | 1.12 | 123 | 0.885 |
| PV neurons | |||||||
| Somatic perimeter length (μm) | 57.03 | 2.05 | 59 | 55.33 | 1.68 | 62 | 0.521 |
| No. of GLT1 appositions | 20.54 | 1.09 | 59 | 22.47 | 1.29 | 62 | 0.260 |
| Mean discrete GLT1 apposition length (μm) | 0.99 | 0.06 | 59 | 0.95 | 0.04 | 62 | 0.612 |
| GLT1 apposition (% somatic perimeter) | 35.98 | 2.39 | 59 | 37.76 | 1.91 | 62 | 0.559 |
aNeurons from 12 rats per behavioral group are included for each neuronal population.
bOutliers that were >4 SDs from the mean were excluded from analysis.
Six hours of SD had no effect on the somatic perimeter length of these neurons (n = 59–135 cells/sleep condition/neuron type from 12 rats per sleep condition; Fig. 2E; Table 2) or the number of discrete GLT1 appositions with their somata compared with Rest (Fig. 2F; Table 2). In contrast, SD altered the mean length of discrete GLT1 appositions on ORX and MCH neurons in opposite directions (Fig. 2G; Table 2). Consequently, the percentage of the total somatic perimeter in apposition with GLT1 was reduced by 10.1% in ORX neurons (unpaired t test, t(235) = 2.28, p = 0.023), and increased by 15.9% in MCH neurons (unpaired t test, t(209) = 2.33, p = 0.021; Fig. 2H; Table 2). Unlike LH neurons, there was no change in these measures in ChAT and PV neurons in the BF (Fig. 2G,H; Table 2), indicating that the changes in GLT1 apposition are specific to neuron type and/or brain region.
Linear regression analyses demonstrated that somatic perimeter length was not correlated with the percentage of the somatic perimeter in apposition with GLT1 for either ORX neurons (Fig. 3A) or MCH neurons (Fig. 3D). Thus, the total length of GLT1 apposition with these neurons was in general proportional to the size of the soma. While the number of GLT1 appositions was positively correlated with percentage GLT1 apposition in ORX neurons (Fig. 3B) and MCH neurons (Fig. 3E), mean length of discrete GLT1 appositions was the best predictor of total percentage GLT1 apposition. These relationships were maintained after SD in both LH neuronal populations (Fig. 3C,F), suggesting that the SD-induced changes in total GLT1 apposition were mainly due to altered length of individual GLT1 appositions.
Figure 3.

Mean length of discrete somatic GLT1 appositions is the best predictor of the proportion of GLT1 apposition with LH neurons. A, D, There is no correlation between percentage GLT1 apposition and somatic perimeter length for either ORX (A) or MCH (D) neurons. B, E, There is a positive correlation between percentage GLT1 apposition and number of GLT1 appositions for ORX (B) and MCH (E) neurons in both Rest and SD conditions. C, F, There is a positive correlation between percentage GLT1 apposition and mean GLT1 apposition length for both ORX (C) and MCH (F) neurons in both Rest and SD conditions. Each symbol represents one neuron. Open symbols represent the Rest condition. Filled symbols represent the SD condition.
Next, we asked whether the SD-induced changes in GLT1 apposition with ORX and MCH neurons were reversible. After an additional 3 h period of sleep opportunity following 6 h of SD (Recovery), no GLT1 apposition measure was significantly different from that obtained from time-matched 9 h Rest animals (R9 h; n = 62–82 cells/sleep condition/neuron type from 6 rats per sleep condition), indicating that the SD-induced changes in GLT1 apposition are reversible (Fig. 4; Table 3).
Figure 4.

SD-induced changes in GLT1 apposition with ORX and MCH neurons are reversible with subsequent sleep opportunity. Rats were given a 3 h period of sleep opportunity (Recovery, Rec) after 6 h of SD and compared with those from the time-matched control group that was left undisturbed through the same 9 h period (R9 h). A, B, Sleep state manipulation has no effect on somatic perimeter length (A) or number of GLT1 appositions (B). C, D, After recovery, there is no difference in mean GLT1 apposition length (C) or total somatic GLT1 apposition (D) relative to the time-matched control group. Responses are normalized to respective mean from R9 h (represented by the dashed line at 100%). Absolute values are reported in Table 3.
Table 3.
Measures of GLT1 apposition with sleep–wake regulatory neurons by sleep-history condition: 9 h of Rest (Rest9 h) or 6 h SD + 3 h Rest (Recovery)a
| Variable | Rest9 h |
Recovery |
p | ||||
|---|---|---|---|---|---|---|---|
| Mean | SEM | n | Mean | SEM | n | ||
| ORX neurons | |||||||
| Somatic perimeter length (μm) | 55.73 | 1.14 | 67 | 53.05 | 0.93 | 70 | 0.071 |
| No. of GLT1 appositions | 21.34 | 0.66 | 67 | 19.67 | 0.66 | 70 | 0.075 |
| Mean discrete GLT1 apposition length (μm) | 0.93 | 0.04 | 67 | 0.86 | 0.03 | 70 | 0.197 |
| GLT1 apposition (% somatic perimeter) | 35.06 | 1.44 | 67 | 31.81 | 1.35 | 70 | 0.103 |
| MCH neurons | |||||||
| Somatic perimeter length (μm) | 50.52 | 0.86 | 62 | 48.59 | 0.73 | 82 | 0.088 |
| No. of GLT1 appositions | 17.44 | 0.66 | 62 | 15.94 | 0.50 | 82 | 0.068 |
| Mean discrete GLT1 apposition length (μm) | 0.73 | 0.03 | 62 | 0.75 | 0.03 | 82 | 0.586 |
| GLT1 apposition (% somatic perimeter) | 25.34 | 1.44 | 62 | 24.98 | 1.25 | 82 | 0.850 |
aNeurons from 6 rats per behavioral group are included for each neuronal population.
These data demonstrate that 6 h of SD induces opposite and reversible changes in the extent of GLT1 surrounding the somata of ORX versus MCH neurons via shortening or lengthening of individual GLT1 appositions. As glutamatergic terminals make abundant contacts with the somata of ORX neurons (Horvath and Gao, 2005), the observed changes in perisomatic GLT1 distribution are highly likely to impact excitatory transmission, particularly in ORX neurons.
GLT1 facilitates excitatory transmission to ORX neurons by preventing activation of presynaptic Group III metabotropic glutamate receptors (mGluRs)
To determine the physiological consequences of SD-dependent GLT1 apposition dynamics in the LH neurons, we conducted patch-clamp recordings. First, to investigate the role of GLT1 in glutamatergic transmission to ORX neurons, we tested the effects of the GLT1-specific inhibitor DHK in hypothalamic slices obtained from undisturbed rats (Rest). DHK (100 μm) reduced the amplitude of evoked EPSCs by 46% (n = 8, paired t test, t(7) = 5.54, p = 0.0009; Fig. 5A,E) while increasing PPR (n = 8, paired t test, t(7) = 9.12, p < 0.0001; Fig. 5A,F), indicating a presynaptic inhibition. It had no effect, however, on the decay rate of EPSCs (Fig. 5B). A decrease in glutamate clearance could result in activation of extrasynaptic receptors, such as inhibitory Group III mGluRs known to be expressed by glutamatergic afferents to ORX neurons (Acuna-Goycolea et al., 2004). We therefore examined whether these mGluRs mediate the observed presynaptic inhibition. Indeed, pretreatment with the Group III mGluR antagonist CPPG (200 μm) prevented the effects of DHK on both EPSC amplitude (n = 5, paired t test, t(4) = 2.47, p = 0.069; Fig. 5C,E) and PPR (n = 5, paired t test, t(4) = 1.69, p = 0.166; Fig. 5F). Furthermore, the Group III mGluR agonist l-AP4 (50 μm) mimicked and occluded the effects of DHK on EPSC amplitude (n = 7, one-way repeated-measures ANOVA, post hoc baseline vs l-AP4, t(6) = 6.34, p = 0.001; post hoc l-AP4 vs l-AP4 + DHK, t(6) = 1.01, p = 0.353; Fig. 5D,E) and PPR (n = 7, one-way repeated-measures ANOVA, post hoc baseline vs l-AP4, t(6) = 3.52, p = 0.037; post hoc l-AP4 vs l-AP4 + DHK, t(6) = 0.08, p = 0.937; Fig. 5F).
Figure 5.
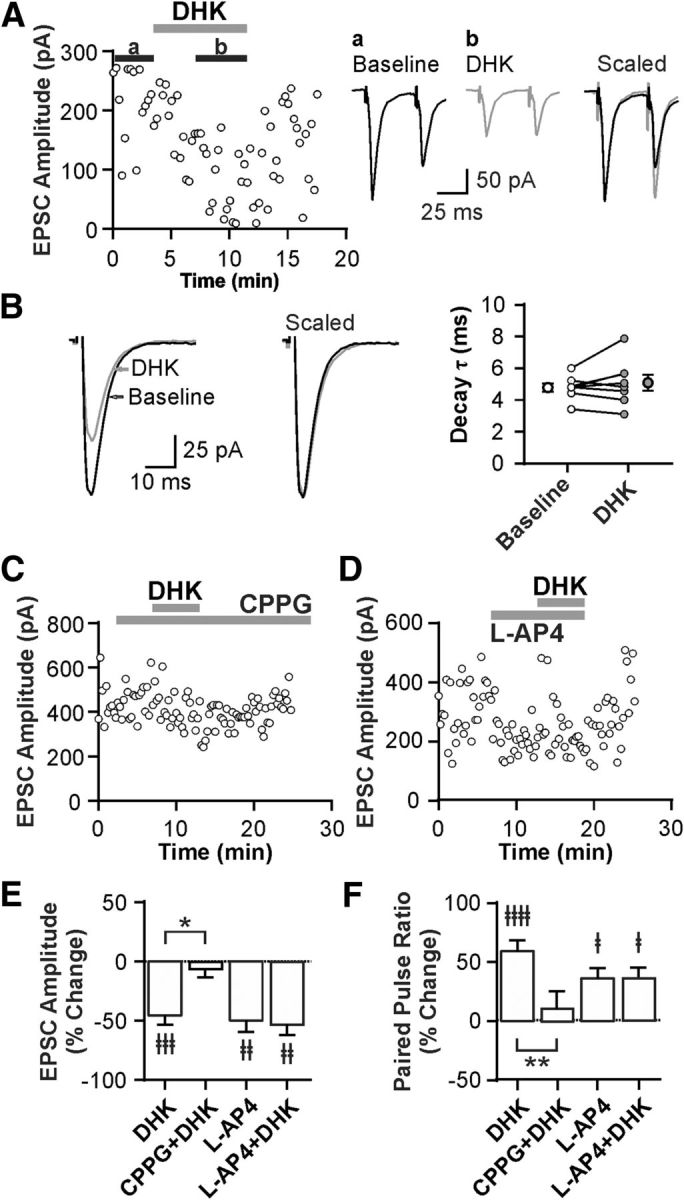
GLT1 prevents the activation of inhibitory presynaptic Group III mGluRs in glutamatergic synapses to ORX neurons in the Rest condition. A, Left, Representative time-effect plot showing the inhibitory effect of the GLT1 blocker DHK (100 μm) on EPSCs in an ORX neuron following Rest. Right, Averaged EPSC traces at baseline (a) and during DHK (b). Scaled and superimposed traces show that DHK changes PPR. Stimulus artifacts were truncated. B, DHK has no effect on the decay rate of EPSCs. Left, Representative EPSC recordings at baseline and during DHK. Right, Decay time constant τ. Open symbols connected with lines represent paired data from individual cells. Symbols with error bars indicate the mean and SEM of the group. C, Representative time-effect plot demonstrating that the Group III mGluR antagonist CPPG (200 μm) prevents the effect of DHK in an ORX neuron. D, Representative time-effect plot showing that the Group III mGluR agonist l-AP4 (50 μm) mimics and occludes the DHK effect in an ORX neuron. E, F, Summary bar graphs illustrating the changes in EPSC amplitude (E) and PPR (F) after different drug applications. ‡p < 0.05, compared with their respective baseline. ‡‡p < 0.01, compared with their respective baseline. ‡‡‡p < 0.001, compared with their respective baseline. ‡‡‡‡p < 0.0001, compared with their respective baseline. *p < 0.05, compared between groups. **p < 0.01, compared between groups.
Collectively, these data show that blocking GLT1 results in the activation of inhibitory presynaptic Group III mGluRs, indicating that GLT1 normally prevents the activation of these receptors and consequently facilitates glutamatergic synaptic transmission to ORX neurons.
SD induces presynaptic inhibition at glutamatergic synapses to ORX neurons
We next investigated the effect of SD on excitatory transmission using hypothalamic slices from rats that either underwent 6 h of SD or were left undisturbed (Rest). We found that SD increased PPR relative to the Rest condition (n = 43 cells for Rest, and n = 31 cells for SD; unpaired t test, t(72) = 2.80, p = 0.007; Fig. 6A), suggesting that SD decreases the release probability of glutamatergic synapses to ORX neurons. This tonic presynaptic inhibition appears to be due to the activation of Group III mGluRs, as CPPG alone increased EPSC amplitude (n = 11, paired t test, t(10) = 2.28, p = 0.046, paired t test; Fig. 6B,D) and decreased PPR in SD (n = 11, paired t test, t(10) = 3.21, p = 0.009; Fig. 6C,D), while CPPG had no effect in Rest (n = 8, EPSC amplitude, t(7) = 0.77, p = 0.465; PPR, t(7) = 0.03, p = 0.979, paired t tests; Fig 6B,C,E). In SD slices, the GLT1 blocker DHK reduced EPSC amplitude in ORX neurons (n = 7, paired t test, t(6) = 3.21, p = 0.019; Fig. 6B) again via Group III mGluRs, as it was prevented by pretreatment with CPPG (n = 6, 228.2 ± 33.4 pA for CPPG, and 211.6 ± 41.0 pA for CPPG + DHK; paired t test, t(5) = 1.95, p = 0.108). On the other hand, the DHK effects on EPSC amplitude and PPR were significantly attenuated by SD (n = 8 cells for Rest, and n = 7 cells for SD; EPSC amplitude, t(13) = 2.68, p = 0.019; PPR, t(13) = 5.90, p > 0.0001, unpaired t tests; Fig. 6B,C), which may be due to an occlusion by tonic endogenous activation of mGluRs. There was no effect of DHK on the decay rate of EPSCs under SD (n = 7, 3.35 ± 0.30 ms for baseline, and 3.73 ± 0.51 ms for DHK; paired t test, t(6) = 1.61, p = 0.158, paired t test).
Figure 6.

SD induces presynaptic inhibition at glutamatergic synapses to ORX neurons through GLT1 and Group III mGluRs. A, PPR in Rest and SD demonstrating that SD decreases release probability. Each symbol represents a cell. Symbols with error bars indicate the mean and SEM of the group. B, C, Effects of DHK and CPPG on EPSC amplitude (B) and PPR (C) by sleep condition. The effect of DHK on EPSC amplitude and PPR is attenuated or abolished in SD compared with Rest. In contrast, CPPG has no effect in Rest but increases EPSC amplitude while decreasing PPR in SD, indicating tonic presynaptic inhibition via Group III mGluRs specifically in SD. D, Left, Representative time-effect plot of EPSC amplitude of an ORX neuron after SD. Right, Averaged traces from baseline (a), in the presence of CPPG (b), and in the presence of CPPG plus DHK (c). Stimulus artifacts were truncated. Dashed lines starting at the first peak indicate the change in PPR. E, Left, Representative time-effect plot showing the lack of effect of CPPG on EPSCs in an ORX neuron in Rest. Right, Averaged traces from baseline (a) and with CPPG (b). Dashed lines starting at the first peak indicate no change in PPR. ‡p < 0.05, compared with their respective baseline. ‡‡p < 0.01, compared with their respective baseline. ‡‡‡p < 0.001, compared with their respective baseline. ‡‡‡‡p < 0.0001, compared with their respective baseline. *p < 0.05, Rest versus SD. **p < 0.01, Rest versus SD. ****p < 0.0001, Rest versus SD.
Together, these data indicate that SD reduces the release probability of excitatory synapses to ORX neurons. This is due to reduced efficacy of GLT1 in preventing tonic activation of the inhibitory Group III mGluRs, which is consistent with our immunohistochemical result showing a reduction in GLT1 apposition with ORX neurons under the SD condition.
SD attenuates synaptic depression of fast glutamatergic transmission to ORX neurons: GLT1-dependent metaplasticity
It is possible that the SD-induced reduction in glutamate clearance is more pronounced during intense synaptic activation, as a greater amount of glutamate will be released and accumulate at the synapse. To test this possibility, we used a train-stimulation protocol (20 pulses at 50 Hz) under both Rest and SD conditions. In the Rest condition, train stimulation induced strong short-term synaptic depression in ORX neurons, which was significantly attenuated after SD (n = 12 cells for Rest, and n = 13 cells for SD; mixed-model ANOVA, F(1,23) = 15.64, p = 0.0006 for sleep history; Figs. 7A, 8J). This metaplasticity involves the same mechanism affecting PPR, namely, an inhibition of GLT1 activity and activation of Group III mGluRs, because this SD effect was reversed by CPPG (n = 5 cells; two-way repeated-measures ANOVA, F(19,76) = 2.29, p = 0.006 for drug × time interaction; Fig. 7B) while mimicked by DHK (10 μm) in the Rest condition (n = 5 cells; two-way repeated-measures ANOVA, F(1,4) = 67.18, p = 0.001 for drug effect; Fig. 7C).
Figure 7.
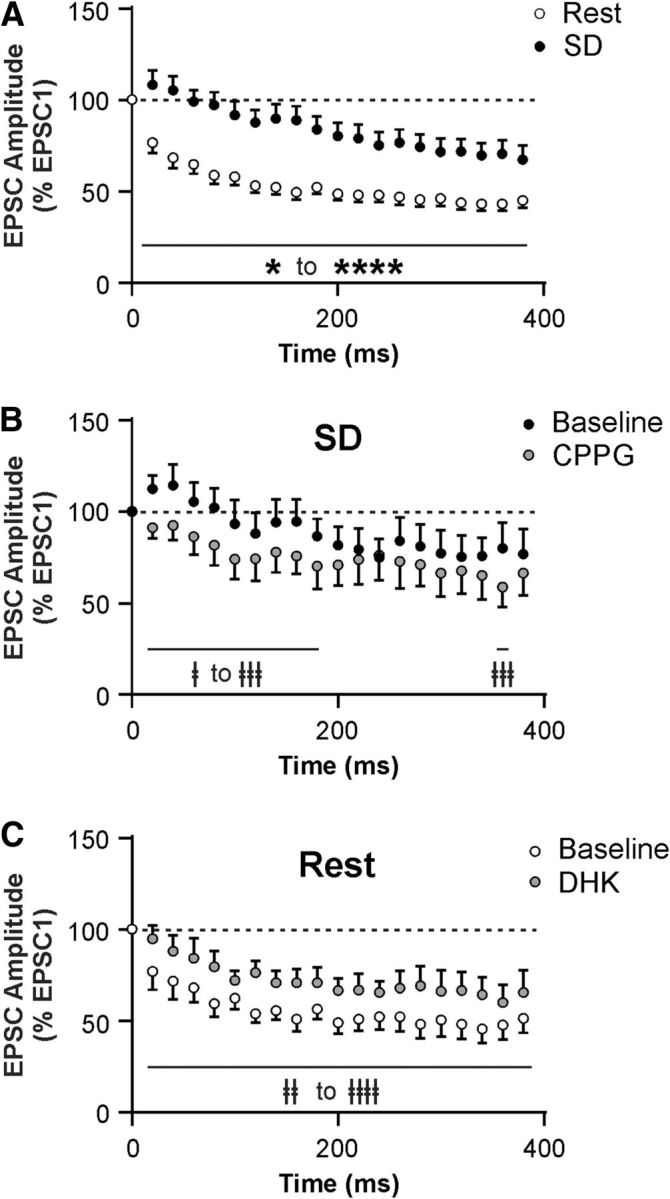
SD attenuates short-term synaptic depression in ORX neurons via GLT1 and Group III mGluRs. A, EPSC amplitude during a train stimulation (20 pulses at 50 Hz), normalized to the amplitude of the first EPSC (represented by the dashed line at 100%) after Rest or SD. Notice the attenuation in short-term synaptic depression following SD compared with Rest. B, CPPG (200 μm) partially reverses the attenuated synaptic depression induced by SD. C, DHK (10 μm) mimics the SD effect in ORX neurons after Rest. ‡p < 0.05, compared with their respective baseline. ‡‡p < 0.01, compared with their respective baseline. ‡‡‡p < 0.001, compared with their respective baseline. ‡‡‡‡p < 0.0001, compared with their respective baseline. *p < 0.05, Rest versus SD. ****p < 0.0001, Rest versus SD.
Figure 8.
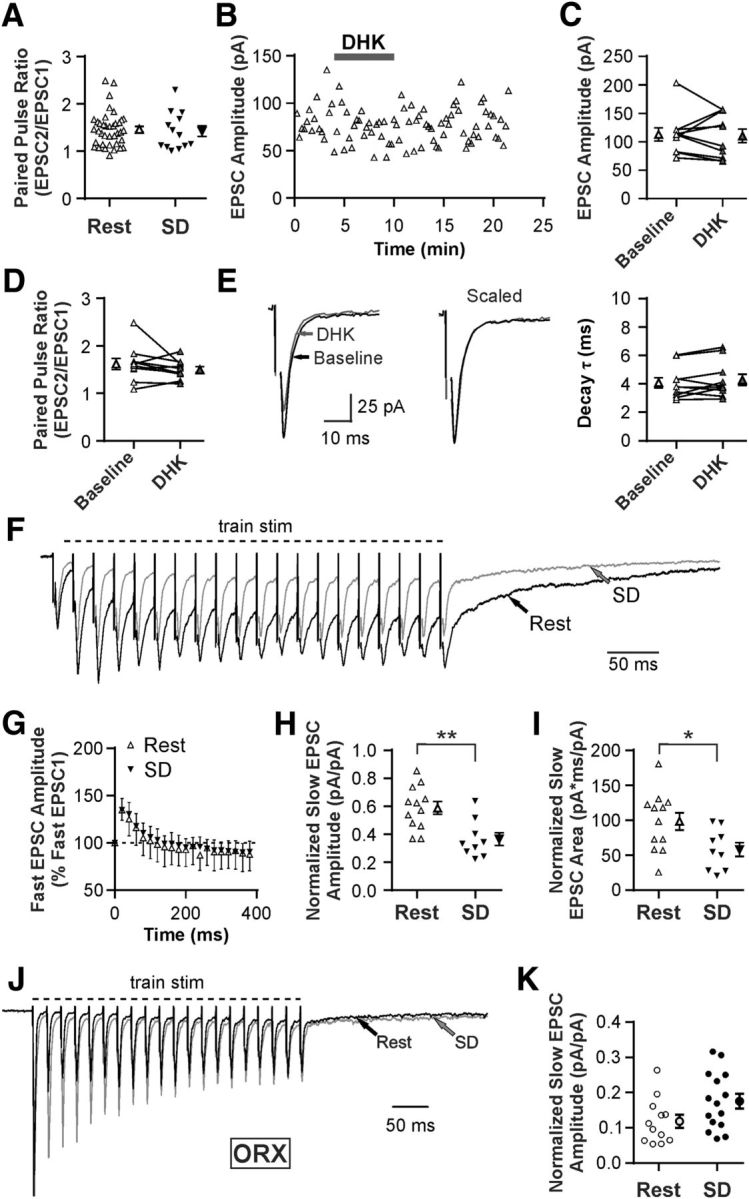
SD inhibits slow EPSC in MCH neurons independent of presynaptic mechanisms. A, PPR at excitatory synapses in MCH neurons by sleep state, demonstrating that SD has no effect on release probability. Each symbol represents a cell. Symbols with error bars indicate the mean and SEM for the group. B, C, Representative time-effect plot (B) and summary graph (C) showing lack of DHK effect (100 μm) on fast EPSC amplitude in MCH neurons in Rest. D, E, DHK has no effect on PPR (D) or the decay rate of EPSCs (E) in MCH neurons in Rest. Stimulus artifacts were truncated. F, Representative averaged traces from MCH neurons after Rest and SD (scaled to the first EPSC) showing fast EPSCs following each stimulus and a slow EPSC that persists after the end of train stimulation (20 pulses at 50 Hz). G, SD has no effect on fast EPSC amplitude. Responses are normalized to the amplitude of the first fast EPSC (represented by the dashed line at 100%). H, I, SD reduces the amplitude (H) and area (I) of the slow EPSC following train stimulation. Responses are normalized to the amplitude of the first fast EPSC to control for stimulus intensity across experiments. J, Representative averaged traces from ORX neurons after Rest and SD (scaled to the first EPSC) showing a slow EPSC that persists after the end of train stimulation (20 pulses at 50 Hz). K, SD has no effect on slow EPSC amplitude in ORX neurons. Responses normalized to the amplitude of the first fast EPSC. *p < 0.05. **p < 0.01.
These data demonstrate that SD results in attenuation of activity-dependent short-term synaptic depression in ORX neurons relative to the Rest condition. This metaplasticity involves GLT1 and presynaptic Group III mGluRs.
SD reduces a slow EPSC in MCH neurons
Our quantitative immunohistochemical study indicated that GLT1 apposition with MCH neurons was reduced by SD, a change in the opposite direction compared with ORX neurons (Fig. 2G,H). We therefore speculated that SD also had the opposite effect on fast excitatory transmission to MCH neurons. However, unlike ORX neurons, MCH neurons showed no change in baseline PPR after SD (n = 38 for Rest, and n = 13 for SD; unpaired t test, t(49) = 0.34, p = 0.739; Fig. 8A). Furthermore, under Rest conditions, DHK failed to alter the amplitude (n = 10, paired t test, t(9) = 0.27, p = 0.792; Fig. 8B,C), PPR (n = 10, paired t test; t(9) = 1.25, p = 0.242; Fig. 8D), or the decay constant of fast EPSCs (n = 10, paired t test; t(9) = 1.31, p = 0.222; Fig. 8E).
During a train stimulation (20 pulses at 50 Hz), it was apparent that EPSCs consisted of a fast and a slow component in MCH neurons (Fig. 8F). Fast EPSCs immediately followed each stimulation with fast decay, whereas a slower inward current accumulated with repeated stimuli and persisted up to 500 ms beyond the train stimulation (Fig. 8F), consistent with a previous report (Huang and van den Pol, 2007). The amplitude of fast EPSCs displayed a transient synaptic facilitation, which was not affected by SD (n = 5 for Rest, and n = 5 for SD; mixed-model ANOVA, F(1,8) = 0.02, p = 0.902 for sleep history; Fig. 8G). In contrast, the slow EPSC was decreased by SD in both amplitude (n = 12 for Rest, and n = 9 for SD; unpaired t test, t(19) = 3.44, p = 0.003; Fig. 8H) and area (n = 12 for Rest, and n = 9 for SD; unpaired t test, t(19) = 2.43, p = 0.025; Fig. 8I). The slow EPSC component was present but much smaller in ORX neurons under the Rest condition (Fig. 8J), and there was no significant change after SD (n = 12 for Rest, and n = 15 for SD; unpaired t test, t(25) = 1.99, p = 0.058; Fig. 8K).
These results indicate that the altered GLT1 apposition with MCH neurons may affect the postsynaptic response without involving presynaptic mechanisms. Thus, the opposite changes in GLT1 apposition with ORX and MCH neurons do not translate to opposite modulation of the same synaptic mechanisms.
Discussion
The present study demonstrates that acute (6 h) SD induces reversible and cell-type-specific changes in GLT1 apposition with peptide-containing sleep/wake-regulatory neurons in the LH, resulting in distinct functional plasticity of excitatory synapses to these neurons (Fig. 9). Structurally, perisomatic GLT1 apposition decreased in ORX neurons and increased in MCH neurons following SD. These changes were reversed by a subsequent brief (3 h) period of sleep opportunity, demonstrating that GLT1 remodeling is rapid and dynamic, occurring on the order of hours. The bidirectional changes in GLT1 apposition in ORX and MCH neurons after SD are somewhat surprising as these neurons have overlapping perikaryal distributions within the LH (Hahn, 2010) and receive monosynaptic inputs from similar neuronal groups within the brain (González et al., 2016). No SD-dependent changes in GLT1 apposition occurred in wake/REM sleep-active cholinergic and PV-containing GABAergic neurons in the BF (Duque et al., 2000; Gritti et al., 2003; Hassani et al., 2009a; Kim et al., 2015), indicating that the SD-induced GLT1 plasticity is cell-type- and/or region-specific. It is possible that the increased activity of these BF neurons not only during wake but also during REM sleep may have obscured any changes in GLT1 apposition with these neurons after SD.
Figure 9.

Sleep history-dependent changes in GLT1 apposition with LH neurons have cell-type-specific consequences for glutamatergic transmission. Left, Following Rest, a period of neuronal inactivity for ORX neurons, GLT1 apposition with these neurons is high, limiting glutamate diffusion and activation of presynaptic Group III mGluRs. When these Group III mGluRs are activated, glutamate release is inhibited. GLT1 therefore facilitates excitatory transmission to ORX neurons under Rest, perhaps to expedite transitions to wake. Following SD, a period of neuronal activity for these neurons, there is reduced GLT1 apposition. Under these conditions, glutamate can diffuse further and activate presynaptic Group III mGluRs on excitatory terminals, suppressing glutamate release. This results in a diminished excitatory drive to ORX neurons, which may represent a synaptic correlate of sleepiness or an increase in homeostatic drive for sleep. Right, Following Rest, a period of neuronal activity for MCH neurons, GLT1 apposition with MCH neurons is low, resulting in greater glutamate diffusion and activation of postsynaptic Group I mGluRs mediating slow EPSCs. This is diminished following SD, a period of neuronal inactivity for MCH neurons, because of increased GLT1 apposition limiting the glutamate buildup in the synapse. Therefore, in the SD condition, excitatory drive to MCH neurons is weaker than in the Rest condition, likely permitting wake state maintenance and accumulation of sleep pressure.
Although the presence of neuronal GLT1 cannot be excluded, we speculate that most of the observed immunopositive GLT1 is astrocytic, given that the majority (∼80%) of GLT1 has been associated with astrocyte cell membranes whereas only ∼5% is in the cell membranes of presynaptic terminals (Furness et al., 2008). Thus, the dynamic sleep history-dependent changes in GLT1 apposition may mainly represent redistribution of GLT1 within astrocytic processes at synaptic sites, which could be driven by synaptic glutamate release (Murphy-Royal et al., 2015). Alternatively, and possibly additionally, GLT1 apposition dynamics could be secondary to structural changes in astrocytic processes relative to the synaptic cleft (e.g., protrusion and withdrawal) (Pannasch et al., 2014; Perez-Alvarez et al., 2014). This may involve actin remodeling downstream of astrocyte Ca2+ transients (Haber et al., 2006; Molotkov et al., 2013), triggered by neuromodulators with changing tones across sleep and wake. For example, noradrenaline, which is released during wake but not during sleep (Aston-Jones and Bloom, 1981; Léger et al., 2009), can induce Ca2+ waves in astrocytes in awake mice (Ding et al., 2013). Furthermore, activation of β2 adrenoceptors rapidly induces morphological changes in astrocytes in vitro (Hatton et al., 1991; Vardjan et al., 2014). Noradrenaline release during wake may increase astrocyte network “gain,” making astrocytes more responsive to local neuronal activity (Paukert et al., 2014), which is different for ORX and MCH neurons across sleep and wake states. In light of well-documented state-dependent activity profiles of ORX and MCH neurons (Lee et al., 2005; Modirrousta et al., 2005; Hassani et al., 2009b), our results indicate that, in both neuronal populations, a decrease in GLT1 apposition occurs after a period of increased neuronal activity (i.e., SD for ORX neurons, and Rest for MCH neurons). It is then possible that reciprocity of perisynaptic astrocyte remodeling could be triggered by a combination of sleep–wake-related neuromodulators and local factors derived from ORX and MCH neurons according to their distinct activity patterns.
GLT1 activity can shorten the glutamate transient at the synapse and thereby curtail the activation of synaptic and extrasynaptic glutamate receptors (Rusakov and Kullmann, 1998; Oliet et al., 2001; Zheng et al., 2008). However, we found that blocking GLT1 with DHK had no effect on the decay kinetics or amplitude of fast EPSCs in ORX or MCH neurons in the absence of presynaptic modulation. This apparent lack of effect on synaptic receptor activation is similar to that in the hippocampal CA1 region, where glutamate transporters, such as GLT1, act mainly to limit glutamate spillover (Isaacson and Nicoll, 1993; Rusakov and Kullmann, 1998) and maintain low tonic levels of extracellular glutamate (Isaacson and Nicoll, 1993; Tanaka et al., 1997). Indeed, our data show that Group III mGluRs presynaptic to ORX neurons are activated when GLT1 action is diminished by the GLT1 blocker or following SD. In MCH neurons, we found that the SD-induced increase in GLT1 apposition was accompanied by the inhibition of a slow EPSC, a current previously identified as being mediated by postsynaptic Group I mGluRs and sensitive to changes in glutamate transport (Huang and van den Pol, 2007). Therefore, one key role of GLT1 for both ORX and MCH neurons is to regulate the activity of extrasynaptic glutamate receptors.
One consequence of unmasking presynaptic inhibition in SD for ORX neurons is modulation of short-term synaptic plasticity. In the Rest condition, glutamatergic transmission to ORX neurons was most effective at low frequency, essentially acting as a low-pass filter. This type of synapse could potentially activate ORX neurons through relatively low activity levels, thereby facilitating transitions from sleep to wakefulness should even sparse arousal-promoting signals arrive from other brain regions (Sakurai et al., 2005; Yoshida et al., 2006; González et al., 2016) or from local neurons (Li et al., 2002; Acuna-Goycolea et al., 2004), including ORX neurons, which are known to corelease glutamate (Yamanaka et al., 2010). However, following SD, release probability at this synapse decreases due to unmasking of Group III mGluR-mediated presynaptic inhibition, making it less prone to synaptic fatigue during high-frequency activity while sparse signals are selectively suppressed. This may be a synaptic correlate of sleepiness, or an increase in homeostatic drive for transition to sleep, where stronger (high-frequency) wake-promoting signals to ORX neurons are necessary for these neurons to maintain and stabilize the wake state via further reinforcement of other wake-promoting systems (Hagan et al., 1999; Saper et al., 2010).
Unlike ORX neurons, the sleep history-dependent synaptic modulation in MCH neurons does not appear to involve presynaptic mechanisms. The magnitude of slow EPSCs induced by train stimulation decreased following SD, likely a direct result of reduced glutamate spillover onto postsynaptic Group I mGluRs, because GLT1 apposition with MCH neurons increased in this condition. Intriguingly, these changes are in keeping with maintenance of the wake state during SD, as less excitatory signal to MCH neurons would hinder sleep, permitting homeostatic sleep pressure to accumulate during SD.
In conclusion, our study demonstrates a novel mechanism by which GLT1 can regulate the activity of wake- and sleep-promoting LH neurons in a cell-type-specific and reversible manner in response to acute sleep loss. In ORX neurons, SD reduced GLT1 apposition and the efficacy of glutamate clearance via GLT1, resulting in presynaptic inhibition and metaplasticity at glutamatergic synapses via activation of Group III mGluRs. These changes are consistent with a role for GLT1 and Group III mGluRs in the homeostatic regulation of sleep–wake states. In contrast, in MCH neurons, SD increased GLT1 apposition and inhibited a slow EPSC. Thus, MCH neurons receive strong excitatory signals during sleep and less during wake, which may permit wake maintenance during SD for sleep pressure to accumulate. These consequences of SD are consistent with a role for GLT1 in the homeostatic regulation of sleep and wake states. As spontaneous wake and short-term SD are regulated similarly (e.g., Cirelli et al., 2004), the GLT1-mediated plasticity in LH neurons reported here may also be involved in the regulation of spontaneous sleep–wake cycles.
Footnotes
This work was supported by Canadian Institutes of Health Research RNL-132870 and Research & Development Corporation Newfoundland and Labrador 5404.1171.102 to M.H., and Canadian Institutes of Health Research MOP-93673 and Natural Sciences and Engineering Research Council RGPIN 2015-05571 to K.S. C.B. was supported by the Nova Scotia Health Research Foundation (Doctoral Scotia Scholarship). We thank Samuel Deurveilher for helpful discussions; Joan Burns, Christian Alberto, Stephen Whitefield, Elizabeth Seary, Alex Madore, Erik Wibowo, and Maxine Profitt for technical assistance; Shannon Hall for help with analysis of quantitative immunohistochemistry; and Kenneth Baimbridge for a gift of parvalbumin antibody.
The authors declare no competing financial interests.
References
- Acuna-Goycolea C, Li Y, Van den Pol AN (2004) Group III metabotropic glutamate receptors maintain tonic inhibition of excitatory synaptic input to hypocretin/orexin neurons. J Neurosci 24:3013–3022. 10.1523/JNEUROSCI.5416-03.2004 [DOI] [PMC free article] [PubMed] [Google Scholar]
- Adamantidis AR, Zhang F, Aravanis AM, Deisseroth K, de Lecea L (2007) Neural substrates of awakening probed with optogenetic control of hypocretin neurons. Nature 450:420–424. 10.1038/nature06310 [DOI] [PMC free article] [PubMed] [Google Scholar]
- Alberto CO, Trask RB, Hirasawa M (2011) Dopamine acts as a partial agonist for α2A adrenoceptor in melanin-concentrating hormone neurons. J Neurosci 31:10671–10676. 10.1523/JNEUROSCI.6245-10.2011 [DOI] [PMC free article] [PubMed] [Google Scholar]
- Anaclet C, Pedersen NP, Ferrari LL, Venner A, Bass CE, Arrigoni E, Fuller PM (2015) Basal forebrain control of wakefulness and cortical rhythms. Nat Commun 6:8744. 10.1038/ncomms9744 [DOI] [PMC free article] [PubMed] [Google Scholar]
- Araque A, Carmignoto G, Haydon PG, Oliet SH, Robitaille R, Volterra A (2014) Gliotransmitters travel in time and space. Neuron 81:728–739. 10.1016/j.neuron.2014.02.007 [DOI] [PMC free article] [PubMed] [Google Scholar]
- Arrigoni E, Chamberlin NL, Saper CB, McCarley RW (2006) Adenosine inhibits basal forebrain cholinergic and noncholinergic neurons in vitro. Neuroscience 140:403–413. 10.1016/j.neuroscience.2006.02.010 [DOI] [PubMed] [Google Scholar]
- Arriza JL, Fairman WA, Wadiche JI, Murdoch GH, Kavanaugh MP, Amara SG (1994) Functional comparisons of three glutamate transporter subtypes cloned from human motor cortex. J Neurosci 14:5559–5569. [DOI] [PMC free article] [PubMed] [Google Scholar]
- Aston-Jones G, Bloom FE (1981) Activity of norepinephrine-containing locus coeruleus neurons in behaving rats anticipates fluctuations in the sleep-waking cycle. J Neurosci 1:876–886. [DOI] [PMC free article] [PubMed] [Google Scholar]
- Bittencourt JC, Presse F, Arias C, Peto C, Vaughan J, Nahon JL, Vale W, Sawchenko PE (1992) The melanin-concentrating hormone system of the rat brain: an immuno- and hybridization histochemical characterization. J Comp Neurol 319:218–245. 10.1002/cne.903190204 [DOI] [PubMed] [Google Scholar]
- Bjorness TE, Dale N, Mettlach G, Sonneborn A, Sahin B, Fienberg AA, Yanagisawa M, Bibb JA, Greene RW (2016) An adenosine-mediated glial-neuronal circuit for homeostatic sleep. J Neurosci 36:3709–3721. 10.1523/JNEUROSCI.3906-15.2016 [DOI] [PMC free article] [PubMed] [Google Scholar]
- Blanco-Centurion C, Liu M, Konadhode RP, Zhang X, Pelluru D, van den Pol AN, Shiromani PJ (2016) Optogenetic activation of melanin-concentrating hormone neurons increases non-rapid eye movement and rapid eye movement sleep during the night in rats. Eur J Neurosci 44:2846–2857. 10.1111/ejn.13410 [DOI] [PMC free article] [PubMed] [Google Scholar]
- Bruce G, Wainer BH, Hersh LB (1985) Immunoaffinity purification of human choline acetyltransferase: comparison of the brain and placental enzymes. J Neurochem 45:611–620. 10.1111/j.1471-4159.1985.tb04030.x [DOI] [PubMed] [Google Scholar]
- Chung EK, Chen LW, Chan YS, Yung KK (2008) Downregulation of glial glutamate transporters after dopamine denervation in the striatum of 6-hydroxydopamine-lesioned rats. J Comp Neurol 511:421–437. 10.1002/cne.21852 [DOI] [PubMed] [Google Scholar]
- Cirelli C, Gutierrez CM, Tononi G (2004) Extensive and divergent effects of sleep and wakefulness on brain gene expression. Neuron 41:35–43. 10.1016/S0896-6273(03)00814-6 [DOI] [PubMed] [Google Scholar]
- Corcoran JP, So PL, Maden M (2004) Disruption of the retinoid signalling pathway causes a deposition of amyloid beta in the adult rat brain. Eur J Neurosci 20:896–902. 10.1111/j.1460-9568.2004.03563.x [DOI] [PubMed] [Google Scholar]
- Cronk J, Derecki N, Kipnis J (2012) Measurement of neuron soma size by fluorescent Nissl stain. Protoc Exch. Advance online publication 10.1038/protex.2012.022 [DOI] [Google Scholar]
- Derecki NC, Cronk JC, Lu Z, Xu E, Abbott SB, Guyenet PG, Kipnis J (2012) Wild-type microglia arrest pathology in a mouse model of Rett syndrome. Nature 484:105–109. 10.1038/nature10907 [DOI] [PMC free article] [PubMed] [Google Scholar]
- Deurveilher S, Rusak B, Semba K (2009) Estradiol and progesterone modulate spontaneous sleep patterns and recovery from sleep deprivation in ovariectomized rats. Sleep 32:865–877. [PMC free article] [PubMed] [Google Scholar]
- Ding F, O'Donnell J, Thrane AS, Zeppenfeld D, Kang H, Xie L, Wang F, Nedergaard M (2013) α1-Adrenergic receptors mediate coordinated Ca2+ signaling of cortical astrocytes in awake, behaving mice. Cell Calcium 54:387–394. 10.1016/j.ceca.2013.09.001 [DOI] [PMC free article] [PubMed] [Google Scholar]
- Doucet J, Lenihan N, May B (2009) Commissural Neurons in the Rat Ventral Cochlear Nucleus. J Assoc Res Otolaryngol 10:269–280. 10.1007/s10162-008-0155-6 [DOI] [PMC free article] [PubMed] [Google Scholar]
- Duque A, Balatoni B, Detari L, Zaborszky L (2000) EEG correlation of the discharge properties of identified neurons in the basal forebrain. J Neurophysiol 84:1627–1635. 10.1152/jn.2000.84.3.1627 [DOI] [PubMed] [Google Scholar]
- Eggermann E, Bayer L, Serafin M, Saint-Mleux B, Bernheim L, Machard D, Jones BE, Mühlethaler M (2003) The wake-promoting hypocretin-orexin neurons are in an intrinsic state of membrane depolarization. J Neurosci 23:1557–1562. [DOI] [PMC free article] [PubMed] [Google Scholar]
- Furness DN, Dehnes Y, Akhtar AQ, Rossi DJ, Hamann M, Grutle NJ, Gundersen V, Holmseth S, Lehre KP, Ullensvang K, Wojewodzic M, Zhou Y, Attwell D, Danbolt NC (2008) A quantitative assessment of glutamate uptake into hippocampal synaptic terminals and astrocytes: new insights into a neuronal role for excitatory amino acid transporter 2 (EAAT2). Neuroscience 157:80–94. 10.1016/j.neuroscience.2008.08.043 [DOI] [PMC free article] [PubMed] [Google Scholar]
- Gaykema RP, Zaborszky L (1997) Parvalbumin-containing neurons in the basal forebrain receive direct input from the substantia nigra-ventral tegmental area. Brain Res 747:173–179. 10.1016/S0006-8993(96)01309-1 [DOI] [PubMed] [Google Scholar]
- Genoud C, Quairiaux C, Steiner P, Hirling H, Welker E, Knott GW (2006) Plasticity of astrocytic coverage and glutamate transporter expression in adult mouse cortex. PLoS Biol 4:e343. 10.1371/journal.pbio.0040343 [DOI] [PMC free article] [PubMed] [Google Scholar]
- Glavas MM, Grayson BE, Allen SE, Copp DR, Smith MS, Cowley MA, Grove KL (2008) Characterization of brainstem peptide YY (PYY) neurons. J Comp Neurol 506:194–210. 10.1002/cne.21543 [DOI] [PubMed] [Google Scholar]
- González JA, Iordanidou P, Strom M, Adamantidis A, Burdakov D (2016) Awake dynamics and brain-wide direct inputs of hypothalamic MCH and orexin networks. Nat Commun 7:11395. 10.1038/ncomms11395 [DOI] [PMC free article] [PubMed] [Google Scholar]
- Gritti I, Manns ID, Mainville L, Jones BE (2003) Parvalbumin, calbindin, or calretinin in cortically projecting and GABAergic, cholinergic, or glutamatergic basal forebrain neurons of the rat. J Comp Neurol 458:11–31. 10.1002/cne.10505 [DOI] [PubMed] [Google Scholar]
- Gundersen V, Storm-Mathisen J, Bergersen LH (2015) Neuroglial transmission. Physiol Rev 95:695–726. 10.1152/physrev.00024.2014 [DOI] [PubMed] [Google Scholar]
- Haber M, Zhou L, Murai KK (2006) Cooperative astrocyte and dendritic spine dynamics at hippocampal excitatory synapses. J Neurosci 26:8881–8891. 10.1523/JNEUROSCI.1302-06.2006 [DOI] [PMC free article] [PubMed] [Google Scholar]
- Hackney CM, Mahendrasingam S, Penn A, Fettiplace R (2005) The concentrations of calcium buffering proteins in mammalian cochlear hair cells. J Neurosci 25:7867–7875. 10.1523/JNEUROSCI.1196-05.2005 [DOI] [PMC free article] [PubMed] [Google Scholar]
- Hagan J, Leslie RA, Patel S, Evans ML, Wattam TA, Holmes S, Benham CD, Taylor SG, Routledge C, Hemmati P, Munton RP, Ashmeade TE, Shah AS, Hatcher JP, Hatcher PD, Jones DN, Smith MI, Piper DC, Hunter AJ, Porter RA, et al. (1999) Orexin A activates locus coeruleus cell firing and increases arousal in the rat. Proc Natl Acad Sci U S A 96:10911–10916. 10.1073/pnas.96.19.10911 [DOI] [PMC free article] [PubMed] [Google Scholar]
- Hahn JD. (2010) Comparison of melanin-concentrating hormone and hypocretin/orexin peptide expression patterns in a current parceling scheme of the lateral hypothalamic zone. Neurosci Lett 468:12–17. 10.1016/j.neulet.2009.10.047 [DOI] [PMC free article] [PubMed] [Google Scholar]
- Halassa MM, Florian C, Fellin T, Munoz JR, Lee SY, Abel T, Haydon PG, Frank MG (2009) Astrocytic modulation of sleep homeostasis and cognitive consequences of sleep loss. Neuron 61:213–219. 10.1016/j.neuron.2008.11.024 [DOI] [PMC free article] [PubMed] [Google Scholar]
- Harris GC, Aston-Jones G (2006) Arousal and reward: a dichotomy in orexin function. Trends Neurosci 29:571–577. 10.1016/j.tins.2006.08.002 [DOI] [PubMed] [Google Scholar]
- Hassani OK, Lee MG, Henny P, Jones BE (2009a) Discharge profiles of identified GABAergic in comparison to cholinergic and putative glutamatergic basal forebrain neurons across the sleep–wake cycle. J Neurosci 29:11828–11840. 10.1523/JNEUROSCI.1259-09.2009 [DOI] [PMC free article] [PubMed] [Google Scholar]
- Hassani OK, Lee MG, Jones BE (2009b) Melanin-concentrating hormone neurons discharge in a reciprocal manner to orexin neurons across the sleep–wake cycle. Proc Natl Acad Sci U S A 106:2418–2422. 10.1073/pnas.0811400106 [DOI] [PMC free article] [PubMed] [Google Scholar]
- Hatton GI, Luckman SM, Bicknell RJ (1991) Adrenalin activation of beta 2-adrenoceptors stimulates morphological changes in astrocytes (pituicytes) cultured from adult rat neurohypophyses. Brain Res Bull 26:765–769. 10.1016/0361-9230(91)90173-H [DOI] [PubMed] [Google Scholar]
- Henny P, Jones BE (2006) Innervation of orexin/hypocretin neurons by GABAergic, glutamatergic or cholinergic basal forebrain terminals evidenced by immunostaining for presynaptic vesicular transporter and postsynaptic scaffolding proteins. J Comp Neurol 499:645–661. 10.1002/cne.21131 [DOI] [PMC free article] [PubMed] [Google Scholar]
- Horvath T, Gao X-B (2005) Input organization and plasticity of hypocretin neurons Possible clues to obesity's association with insomnia. Cell Metab 1:279–286. 10.1016/j.cmet.2005.03.003 [DOI] [PubMed] [Google Scholar]
- Huang H, van den Pol AN (2007) Rapid direct excitation and long-lasting enhancement of NMDA response by group I metabotropic glutamate receptor activation of hypothalamic melanin-concentrating hormone neurons. J Neurosci 27:11560–11572. 10.1523/JNEUROSCI.2147-07.2007 [DOI] [PMC free article] [PubMed] [Google Scholar]
- Huang YH, Sinha SR, Tanaka K, Rothstein JD, Bergles DE (2004) Astrocyte glutamate transporters regulate metabotropic glutamate receptor-mediated excitation of hippocampal interneurons. J Neurosci 24:4551–4559. 10.1523/JNEUROSCI.5217-03.2004 [DOI] [PMC free article] [PubMed] [Google Scholar]
- Isaacson JS, Nicoll RA (1993) The uptake inhibitor l-trans-PDC enhances responses to glutamate but fails to alter the kinetics of excitatory synaptic currents in the hippocampus. J Neurophysiol 70:2187–2191. 10.1152/jn.1993.70.5.2187 [DOI] [PubMed] [Google Scholar]
- Jancsik V, Bene R, Sótonyi P, Zachar G (2018) Sub-cellular organization of the melanin-concentrating hormone neurons in the hypothalamus. Peptides 99:56–60. 10.1016/j.peptides.2017.11.002 [DOI] [PubMed] [Google Scholar]
- Jego S, Glasgow SD, Herrera CG, Ekstrand M, Reed SJ, Boyce R, Friedman J, Burdakov D, Adamantidis AR (2013) Optogenetic identification of a rapid eye movement sleep modulatory circuit in the hypothalamus. Nat Neurosci 16:1637–1643. 10.1038/nn.3522 [DOI] [PMC free article] [PubMed] [Google Scholar]
- Kim T, Thankachan S, McKenna JT, McNally JM, Yang C, Choi JH, Chen L, Kocsis B, Deisseroth K, Strecker RE, Basheer R, Brown RE, McCarley RW (2015) Cortically projecting basal forebrain parvalbumin neurons regulate cortical gamma band oscillations. Proc Natl Acad Sci U S A 112:3535–3540. 10.1073/pnas.1413625112 [DOI] [PMC free article] [PubMed] [Google Scholar]
- Konadhode RR, Pelluru D, Blanco-Centurion C, Zayachkivsky A, Liu M, Uhde T, Glen WB Jr, van den Pol AN, Mulholland PJ, Shiromani PJ (2013) Optogenetic stimulation of MCH neurons increases sleep. J Neurosci 33:10257–10263. 10.1523/JNEUROSCI.1225-13.2013 [DOI] [PMC free article] [PubMed] [Google Scholar]
- Lee MG, Hassani OK, Jones BE (2005) Discharge of identified orexin/hypocretin neurons across the sleep-waking cycle. J Neurosci 25:6716–6720. 10.1523/JNEUROSCI.1887-05.2005 [DOI] [PMC free article] [PubMed] [Google Scholar]
- Lee M, Cheng MM, Lin CY, Louis ED, Faust PL, Kuo SH (2014) Decreased EAAT2 protein expression in the essential tremor cerebellar cortex. Acta Neuropathol Commun 2:157. 10.1186/s40478-014-0157-z [DOI] [PMC free article] [PubMed] [Google Scholar]
- Léger L, Goutagny R, Sapin E, Salvert D, Fort P, Luppi PH (2009) Noradrenergic neurons expressing fos during waking and paradoxical sleep deprivation in the rat. J Chem Neuroanat 37:149–157. 10.1016/j.jchemneu.2008.12.008 [DOI] [PubMed] [Google Scholar]
- Leung TC, Lui CN, Chen LW, Yung WH, Chan YS, Yung KK (2012) Ceftriaxone ameliorates motor deficits and protects dopaminergic neurons in 6-hydroxydopamine-lesioned rats. ACS Chem Neurosci 3:22–30. 10.1021/cn200072h [DOI] [PMC free article] [PubMed] [Google Scholar]
- Li Y, Gao XB, Sakurai T, van den Pol AN (2002) Hypocretin/Orexin excites hypocretin neurons via a local glutamate neuron-A potential mechanism for orchestrating the hypothalamic arousal system. Neuron 36:1169–1181. 10.1016/S0896-6273(02)01132-7 [DOI] [PubMed] [Google Scholar]
- Linehan V, Trask RB, Briggs C, Rowe TM, Hirasawa M (2015) Concentration-dependent activation of dopamine receptors differentially modulates GABA release onto orexin neurons. Eur J Neurosci 42:1976–1983. 10.1111/ejn.12967 [DOI] [PMC free article] [PubMed] [Google Scholar]
- Llewellyn-Smith IJ, Martin CL, Fenwick NM, Dicarlo SE, Lujan HL, Schreihofer AM (2007) VGLUT1 and VGLUT2 innervation in autonomic regions of intact and transected rat spinal cord. J Comp Neurol 503:741–767. 10.1002/cne.21414 [DOI] [PubMed] [Google Scholar]
- Longair MH, Baker DA, Armstrong JD (2011) Simple neurite tracer: open source software for reconstruction, visualization and analysis of neuronal processes. Bioinformatics 27:2453–2454. 10.1093/bioinformatics/btr390 [DOI] [PubMed] [Google Scholar]
- Luisier F, Blu T, Unser M (2007) A new SURE approach to image denoising: interscale orthonormal wavelet thresholding. IEEE Trans Image Process 16:593–606. 10.1109/TIP.2007.891064 [DOI] [PubMed] [Google Scholar]
- Luisier F, Blu T, Unser M (2011) Image denoising in mixed Poisson-Gaussian noise. IEEE Trans Image Process 20:696–708. 10.1109/TIP.2010.2073477 [DOI] [PubMed] [Google Scholar]
- Manns ID, Alonso A, Jones BE (2000) Discharge properties of juxtacellularly labeled and immunohistochemically identified cholinergic basal forebrain neurons recorded in association with the electroencephalogram in anesthetized rats. J Neurosci 20:1505–1518. [DOI] [PMC free article] [PubMed] [Google Scholar]
- Marcaggi P, Billups D, Attwell D (2003) The role of glial glutamate transporters in maintaining the independent operation of juvenile mouse cerebellar parallel fibre synapses. J Physiol 552:89–107. 10.1113/jphysiol.2003.044263 [DOI] [PMC free article] [PubMed] [Google Scholar]
- Márquez-Ruiz J, Morcuende S, Navarro-López Jde D, Escudero M (2007) Anatomical and pharmacological relationship between acetylcholine and nitric oxide in the prepositus hypoglossi nucleus of the cat: functional implications for eye-movement control. J Comp Neurol 503:407–420. 10.1002/cne.21397 [DOI] [PubMed] [Google Scholar]
- Mars T, Yu KJ, Tang XM, Miranda AF, Grubic Z, Cambi F, King MP (2001) Differentiation of glial cells and motor neurons during the formation of neuromuscular junctions in cocultures of rat spinal cord explant and human muscle. J Comp Neurol 438:239–251. 10.1002/cne.1312 [DOI] [PubMed] [Google Scholar]
- Martinez-Murillo R, Villalba RM, Rodrigo J (1990) Immunocytochemical localization of cholinergic terminals in the region of the nucleus basalis magnocellularis of the rat: a correlated light and electron microscopic study. Neuroscience 36:361–376. 10.1016/0306-4522(90)90432-4 [DOI] [PubMed] [Google Scholar]
- Modirrousta M, Mainville L, Jones BE (2005) Orexin and MCH neurons express c-fos differently after sleep deprivation vs recovery and bear different adrenergic receptors. Eur J Neurosci 21:2807–2816. 10.1111/j.1460-9568.2005.04104.x [DOI] [PubMed] [Google Scholar]
- Molotkov D, Zobova S, Arcas JM, Khiroug L (2013) Calcium-induced outgrowth of astrocytic peripheral processes requires actin binding by profilin-1. Cell Calcium 53:338–348. 10.1016/j.ceca.2013.03.001 [DOI] [PubMed] [Google Scholar]
- Morcuende S, Matarredona ER, Benítez-Temiño B, Muñoz-Hernández R, Pastor AM, de la Cruz RR (2011) Differential regulation of the expression of neurotrophin receptors in rat extraocular motoneurons after lesion. J Comp Neurol 519:2335–2352. 10.1002/cne.22630 [DOI] [PubMed] [Google Scholar]
- Murphy-Royal C, Dupuis JP, Varela JA, Panatier A, Pinson B, Baufreton J, Groc L, Oliet SH (2015) Surface diffusion of astrocytic glutamate transporters shapes synaptic transmission. Nat Neurosci 18:219–226. 10.1038/nn.3901 [DOI] [PubMed] [Google Scholar]
- Nickerson Poulin A, Guerci A, El Mestikawy S, Semba K (2006) Vesicular glutamate transporter 3 immunoreactivity is present in cholinergic basal forebrain neurons projecting to the basolateral amygdala in rat. J Comp Neurol 498:690–711. 10.1002/cne.21081 [DOI] [PubMed] [Google Scholar]
- Oliet SH, Piet R, Poulain DA (2001) Control of glutamate clearance and synaptic efficacy by glial coverage of neurons. Science 292:923–926. 10.1126/science.1059162 [DOI] [PubMed] [Google Scholar]
- Omrani A, Melone M, Bellesi M, Safiulina V, Aida T, Tanaka K, Cherubini E, Conti F (2009) Up-regulation of GLT-1 severely impairs LTD at mossy fibre-CA3 synapses. J Physiol 587:4575–4588. 10.1113/jphysiol.2009.177881 [DOI] [PMC free article] [PubMed] [Google Scholar]
- Pannasch U, Freche D, Dallérac G, Ghézali G, Escartin C, Ezan P, Cohen-Salmon M, Benchenane K, Abudara V, Dufour A, Lübke JH, Déglon N, Knott G, Holcman D, Rouach N (2014) Connexin 30 sets synaptic strength by controlling astroglial synapse invasion. Nat Neurosci 17:549–558. 10.1038/nn.3662 [DOI] [PubMed] [Google Scholar]
- Parsons MP, Burt J, Cranford A, Alberto C, Zipperlen K, Hirasawa M (2012) Nociceptin induces hypophagia in the perifornical and lateral hypothalamic area. PLoS One 7:e45350. 10.1371/journal.pone.0045350 [DOI] [PMC free article] [PubMed] [Google Scholar]
- Pascual O, Casper KB, Kubera C, Zhang J, Revilla-Sanchez R, Sul JY, Takano H, Moss SJ, McCarthy K, Haydon PG (2005) Astrocytic purinergic signaling coordinates synaptic networks. Science 310:113–116. 10.1126/science.1116916 [DOI] [PubMed] [Google Scholar]
- Paukert M, Agarwal A, Cha J, Doze VA, Kang JU, Bergles DE (2014) Norepinephrine controls astroglial responsiveness to local circuit activity. Neuron 82:1263–1270. 10.1016/j.neuron.2014.04.038 [DOI] [PMC free article] [PubMed] [Google Scholar]
- Perez-Alvarez A, Navarrete M, Covelo A, Martin ED, Araque A (2014) Structural and functional plasticity of astrocyte processes and dendritic spine interactions. J Neurosci 34:12738–12744. 10.1523/JNEUROSCI.2401-14.2014 [DOI] [PMC free article] [PubMed] [Google Scholar]
- Peyron C, Tighe DK, van den Pol AN, de Lecea L, Heller HC, Sutcliffe JG, Kilduff TS (1998) Neurons containing hypocretin (orexin) project to multiple neuronal systems. J Neurosci 18:9996–10015. [DOI] [PMC free article] [PubMed] [Google Scholar]
- Porkka-Heiskanen T, Strecker RE, Thakkar M, Bjorkum AA, Greene RW, McCarley RW (1997) Adenosine: a mediator of the sleep-inducing effects of prolonged wakefulness. Science 276:1265–1268. 10.1126/science.276.5316.1265 [DOI] [PMC free article] [PubMed] [Google Scholar]
- Poskanzer KE, Yuste R (2016) Astrocytes regulate cortical state switching in vivo. Proc Natl Acad Sci U S A 113:E2675–E2684. 10.1073/pnas.1520759113 [DOI] [PMC free article] [PubMed] [Google Scholar]
- Redecker P, Pabst H (2000) Immunohistochemical study of the glutamate transporter proteins GLT-1 and GLAST in rat and gerbil pineal gland. J Pineal Res 28:179–184. 10.1034/j.1600-079X.2001.280308.x [DOI] [PubMed] [Google Scholar]
- Roberts RC, Roche JK, McCullumsmith RE (2014) Localization of excitatory amino acid transporters EAAT1 and EAAT2 in human postmortem cortex: a light and electron microscopic study. Neuroscience 277:522–540. 10.1016/j.neuroscience.2014.07.019 [DOI] [PMC free article] [PubMed] [Google Scholar]
- Rusakov DA, Kullmann DM (1998) Extrasynaptic glutamate diffusion in the hippocampus: ultrastructural constraints, uptake, and receptor activation. J Neurosci 18:3158–3170. [DOI] [PMC free article] [PubMed] [Google Scholar]
- Sakurai T, Nagata R, Yamanaka A, Kawamura H, Tsujino N, Muraki Y, Kageyama H, Kunita S, Takahashi S, Goto K, Koyama Y, Shioda S, Yanagisawa M (2005) Input of orexin/hypocretin neurons revealed by a genetically encoded tracer in mice. Neuron 46:297–308. 10.1016/j.neuron.2005.03.010 [DOI] [PubMed] [Google Scholar]
- Saper CB, Fuller PM, Pedersen NP, Lu J, Scammell TE (2010) Sleep state switching. Neuron 68:1023–1042. 10.1016/j.neuron.2010.11.032 [DOI] [PMC free article] [PubMed] [Google Scholar]
- Schreiner AE, Berlinger E, Langer J, Kafitz KW, Rose CR (2013) Lesion-induced alterations in astrocyte glutamate transporter expression and function in the hippocampus. ISRN Neurol 2013:893605. 10.1155/2013/893605 [DOI] [PMC free article] [PubMed] [Google Scholar]
- Schreiner AE, Durry S, Aida T, Stock MC, Rüther U, Tanaka K, Rose CR, Kafitz KW (2014) Laminar and subcellular heterogeneity of GLAST and GLT-1 immunoreactivity in the developing postnatal mouse hippocampus. J Comp Neurol 522:204–224. 10.1002/cne.23450 [DOI] [PubMed] [Google Scholar]
- Sloviter RS. (1989) Calcium-binding protein (calbindin-D28k) and parvalbumin immunocytochemistry: localization in the rat hippocampus with specific reference to the selective vulnerability of hippocampal neurons to seizure activity. J Comp Neurol 280:183–196. 10.1002/cne.902800203 [DOI] [PubMed] [Google Scholar]
- Tanaka K, Watase K, Manabe T, Yamada K, Watanabe M, Takahashi K, Iwama H, Nishikawa T, Ichihara N, Kikuchi T, Okuyama S, Kawashima N, Hori S, Takimoto M, Wada K (1997) Epilepsy and exacerbation of brain injury in mice lacking the glutamate transporter GLT-1. Science 276:1699–1702. 10.1126/science.276.5319.1699 [DOI] [PubMed] [Google Scholar]
- Tsunematsu T, Ueno T, Tabuchi S, Inutsuka A, Tanaka KF, Hasuwa H, Kilduff TS, Terao A, Yamanaka A (2014) Optogenetic manipulation of activity and temporally controlled cell-specific ablation reveal a role for MCH neurons in sleep–wake regulation. J Neurosci 34:6896–6909. 10.1523/JNEUROSCI.5344-13.2014 [DOI] [PMC free article] [PubMed] [Google Scholar]
- Umbriaco D, Watkins KC, Descarries L, Cozzari C, Hartman BK (1994) Ultrastructural and morphometric features of the acetylcholine innervation in adult rat parietal cortex: an electron microscopic study in serial sections. J Comp Neurol 348:351–373. 10.1002/cne.903480304 [DOI] [PubMed] [Google Scholar]
- Vardjan N, Kreft M, Zorec R (2014) Dynamics of β-adrenergic/cAMP signaling and morphological changes in cultured astrocytes. Glia 62:566–579. 10.1002/glia.22626 [DOI] [PubMed] [Google Scholar]
- Vetrivelan R, Kong D, Ferrari LL, Arrigoni E, Madara JC, Bandaru SS, Lowell BB, Lu J, Saper CB (2016) Melanin-concentrating hormone neurons specifically promote rapid eye movement sleep in mice. Neuroscience 336:102–113. 10.1016/j.neuroscience.2016.08.046 [DOI] [PMC free article] [PubMed] [Google Scholar]
- Weber F, Dan Y (2016) Circuit-based interrogation of sleep control. Nature 538:51–59. 10.1038/nature19773 [DOI] [PubMed] [Google Scholar]
- Yamanaka A, Tabuchi S, Tsunematsu T, Fukazawa Y, Tominaga M (2010) Orexin directly excites orexin neurons through orexin 2 receptor. J Neurosci 30:12642–12652. 10.1523/JNEUROSCI.2120-10.2010 [DOI] [PMC free article] [PubMed] [Google Scholar]
- Yang C, Franciosi S, Brown RE (2013) Adenosine inhibits the excitatory synaptic inputs to basal forebrain cholinergic, GABAergic, and parvalbumin neurons in mice. Front Neurol 4:77. 10.3389/fneur.2013.00077 [DOI] [PMC free article] [PubMed] [Google Scholar]
- Yang C, Thankachan S, McCarley RW, Brown RE (2017) The menagerie of the basal forebrain: how many (neural) species are there, what do they look like, how do they behave and who talks to whom? Curr Opin Neurobiol 44:159–166. 10.1016/j.conb.2017.05.004 [DOI] [PMC free article] [PubMed] [Google Scholar]
- Yoshida K, McCormack S, España RA, Crocker A, Scammell TE (2006) Afferents to the orexin neurons of the rat brain. J Comp Neurol 494:845–861. 10.1002/cne.20859 [DOI] [PMC free article] [PubMed] [Google Scholar]
- Zheng K, Scimemi A, Rusakov DA (2008) Receptor actions of synaptically released glutamate: the role of transporters on the scale from nanometers to microns. Biophys J 95:4584–4596. 10.1529/biophysj.108.129874 [DOI] [PMC free article] [PubMed] [Google Scholar]