

Abstract
Acute administration of N-methyl-D-aspartate receptor (NMDAR) antagonists in healthy humans and animals produces working memory deficits similar to those observed in schizophrenia. However, it is unclear whether they also lead to altered low-frequency (≤60 Hz) neural oscillatory activities similar to those associated with schizophrenia during working memory processes. Here, we recorded local field potentials (LFPs) and single-unit activity from the lateral prefrontal cortex (LPFC) of three male rhesus macaque monkeys while they performed a rule-based prosaccade and antisaccade working memory task both before and after systemic injections of a subanesthetic dose (≤0.7 mg/kg) of ketamine. Accompanying working-memory impairment, ketamine enhanced the low-gamma-band (30–60 Hz) and dampened the beta-band (13–30 Hz) oscillatory activities in the LPFC during both delay periods and intertrial intervals. It also increased task-related alpha-band activities, likely reflecting compromised attention. Beta-band oscillations may be especially relevant to working memory processes because stronger beta power weakly but significantly predicted shorter saccadic reaction time. Also in beta band, ketamine reduced the performance-related oscillation as well as the rule information encoded in the spectral power. Ketamine also reduced rule information in the spike field phase consistency in almost all frequencies up to 60 Hz. Our findings support NMDAR antagonists in nonhuman primates as a meaningful model for altered neural oscillations and synchrony, which reflect a disorganized network underlying the working memory deficits in schizophrenia.
SIGNIFICANCE STATEMENT Low doses of ketamine, an NMDAR blocker, produce working memory deficits similar to those observed in schizophrenia. In the lateral prefrontal cortex, a key brain region for working memory, we found that ketamine altered neural oscillatory activities in similar ways that differentiate schizophrenic patients and healthy subjects during both task and nontask periods. Ketamine induced stronger gamma (30–60 Hz) and weaker beta (13–30 Hz) oscillations, reflecting local hyperactivity and reduced long-range communications. Furthermore, ketamine reduced performance-related oscillatory activities, as well as the rule information encoded in the oscillations and in the synchrony between single-cell activities and oscillations. The ketamine model helps link the molecular and cellular basis of neural oscillatory changes to the working memory deficit in schizophrenia.
Keywords: alpha band, beta band, gamma band, lateral prefrontal cortex, local field potential, NMDA antagonist
Introduction
Although the positive symptoms of schizophrenia can be controlled effectively with medication, cognitive deficits such as working memory impairment remain a challenge in daily life (Green, 1996; Elvevåg and Goldberg, 2000; Goldman-Rakic et al., 2004; van Os and Kapur, 2009; Lett et al., 2014). To understand the aberrant processes underlying such deficits, it is necessary to examine the neural communication within and beyond the lateral prefrontal cortex (LPFC). The reasons for this are twofold. First, working memory engages LPFC as one critical node in a large network (Rawley and Constantinidis, 2009; Benchenane et al., 2011; Lara and Wallis, 2015). Second, schizophrenia appears to be a syndrome of network disconnection (Friston, 1998; Phillips and Silverstein, 2003; Stephan et al., 2006).
In the LPFC, the N-methyl-D-aspartate receptor (NMDAR) plays an important role in working memory (Wang, 1999; Durstewitz et al., 2000). Acute blockade of NMDAR using ketamine or MK-801 produces working memory deficits in both healthy humans (Honey et al., 2004; Morgan et al., 2004) and animals (Homayoun et al., 2004; Condy et al., 2005; Enomoto and Floresco, 2009; Skoblenick and Everling, 2012; Blackman et al., 2013; Gil-da-Costa et al., 2013) resembling those seen in patients. In healthy subjects, acute treatment with ketamine produces the full range of positive, negative, and cognitive symptoms (Driesen et al., 2013).
During working memory tasks, functional imaging has revealed that the LPFC in patients with schizophrenia displayed both hyperactivity (Whitfield-Gabrieli et al., 2009) and hypoconnectivity with parietal cortices compared with healthy controls (Grillon et al., 2013). It may be reasoned that their working memory suffered due to both excessive, non-task-specific activities and diminished frontoparietal communication. Interestingly, acute treatment with ketamine generates LPFC hypoconnectivity similar to that observed in schizophrenia (Driesen et al., 2013; Muthukumaraswamy et al., 2015).
Compared with functional imaging, electrophysiological recordings open a more direct window into neural communication (Salinas and Sejnowski, 2000, 2001; Womelsdorf et al., 2014). It has been suggested that gamma-band oscillations orchestrate local processing whereas beta activities reflect communication across a larger cortical network (Donner and Siegel, 2011; Hipp et al., 2011; Bastos et al., 2015; Fries, 2015). Both gamma and beta oscillations have been implicated in working memory processes (Pesaran et al., 2002; Kopell et al., 2011). Patients with schizophrenia displayed weaker beta-band oscillation and stronger gamma-band oscillation compared with controls during working memory tasks (Barr et al., 2010). NMDAR antagonists induced similar effects in healthy participants (Hong et al., 2010; de la Salle et al., 2016).
Less well studied is the mechanism of alpha-band oscillations. In patients with schizophrenia, but not other disorders with psychosis, an increase in alpha activity in the EEG is correlated with a decreased LPFC volume among other regions (Soh et al., 2015). In nonhuman primates, an increase in alpha oscillatory power was associated with a reduction in information encoded in the LPFC (Puig and Miller, 2015). However, one intracranial recording study in human patients found LPFC theta-alpha (4–12 Hz) activities positively correlated with performance on a mental arithmetic task (Halgren et al., 2002). Increased alpha phase synchronization between frontal and posterior regions is also implicated in working memory (Daume et al., 2017). Therefore, the exact role of alpha activities in the LPFC during working memory tasks remains unclear.
In the rule-based working memory task that we have used, ketamine treatment results in performance deficits in macaque monkeys (Skoblenick and Everling, 2012; Ma et al., 2015) similar to those seen in schizophrenia patients (McDowell and Clementz, 2001; Myles et al., 2017). Here, we report that subanesthetic ketamine injection resulted in a decrease in LFP power in the beta band and an increase in low-gamma power during both task and nontask periods. Ketamine also increased task-related alpha-band oscillations. Stronger delay period task-related oscillatory power in the beta band was predictive of shorter subsequent saccadic reaction time and ketamine reduced the performance-related activities in this frequency range. In addition, ketamine reduced the amount of information encoded in beta-band oscillatory power and in spike field phase consistency across multiple frequency ranges during delay periods. Our findings demonstrate that the NMDAR hypofunction model in nonhuman primates can simulate changes in neural communication observed in schizophrenia and contribute to the understanding of the effects of ketamine administration in both research and clinical practice.
Materials and Methods
Animals.
Three male rhesus monkeys (Macaca mulatta) weighing 7 kg (Monkey O), 5 kg (Monkey T), and 8 kg (Monkey A) were used in the study. As described previously (Johnston and Everling, 2006), animals were implanted with a plastic head restraint and trained to perform the task. Once trained, they were implanted with a recording chamber located above their LPFC. The monkeys received postsurgical treatments including analgesics and antibiotics to minimize pain or discomfort under the oversight of a university veterinarian. All procedures performed were approved by the Animal Care Committee of the University of Western Ontario Council on Animal Care and in accordance with the Canadian Council of Animal Care policy on laboratory animal use.
Behavioral task.
The task has been described in detail previously (Skoblenick and Everling, 2012, 2014). On each trial, animals were required to fixate a small white spot at the center of the monitor display. After a minimum of 100 ms of fixation, a color cue replaced the white fixation spot and lasted for 200 ms, followed by a variable delay of 700–1000 ms (see Fig. 1A). For Monkeys T and A, a red cue indicated that a prosaccade was required for the subsequent postdelay peripheral stimulus and a green cue indicated an antisaccade. For Monkey O, this contingency was reversed. The peripheral stimulus appeared 8° to either the left or right of the fixation spot at its offset. If the saccade landed within a window of 4° centered on the target location, the animal received a liquid reward. Trials involving prosaccades to the left and right and those involving antisaccades to the left and right were interleaved randomly. The animals' eye positions were recorded and digitized at 120 Hz using an ISCAN infrared pupillary tracking system for Monkey O and at 1000 Hz using an Eyelink 1000 infrared pupillary tracking system for Monkeys T and A (SR Research).
Figure 1.
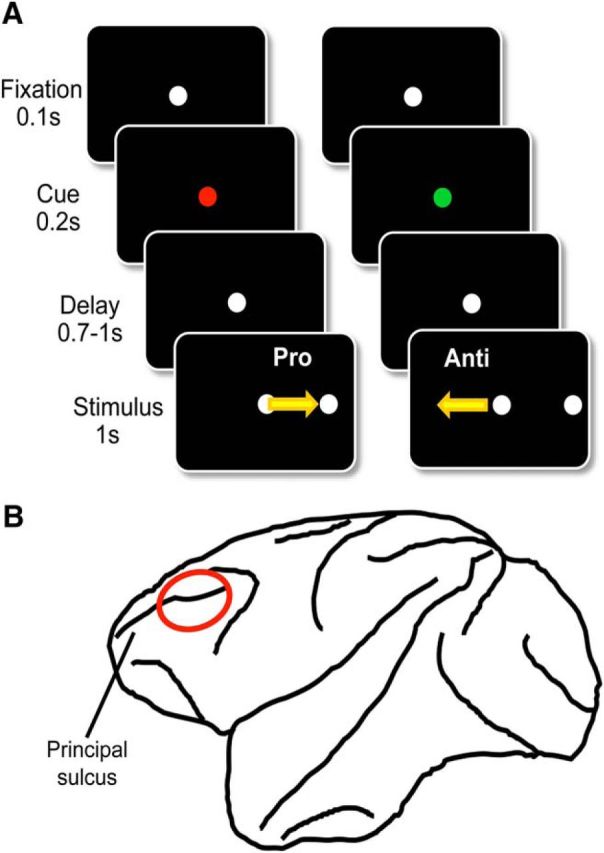
Schematic illustrations of methods and materials. A, Experimental paradigm. Each trial started with a white fixation dot that lasted for 100 ms before turning green or red, signaling a prosaccade or antisaccade trial, respectively. Then, 200 ms later, the central spot turned back to white, which initiated the delay period lasting from 700 -1000 ms and ending upon the onset of the peripheral stimulus. Animals were rewarded for a saccade toward (prosaccade) or in the opposite direction of (antisaccade) the peripheral stimulus depending upon the current task rule. B, Recording location. All electrodes were placed within the bilateral lateral prefrontal cortex. The locations were confirmed with MRI.
Recording.
Multielectrode arrays were used either semichronically or acutely. In the semichronic preparation, on the day before the experiment, a multielectrode grid (Neuronitek) was installed and 32 tungsten recording electrodes (FHC) plus four reference electrodes were lowered through a silicone membrane into the cortex until background activities were registered (Skoblenick et al., 2016). The array remained in place for 2 weeks before its removal for the cleaning and sterilization of the chamber. In the acute preparation, 4–6 tungsten recording electrodes were inserted through a grid 1–1.5 h before the recording session and removed afterward, with the chamber sterilized both before and after the installation of the array. In either technique, the locations of the electrodes were adjusted manually via microdrives and optimized for spiking activities within each session. The last adjustment to any of the electrode took place at least 20 min before the onset of the recording session. Neural activities, including LFP and spike trains, as well as eye-tracking data, were recorded using either a multi-acquisition processor system or an omniplex system (Plexon). Spiking activities were sorted manually using Offline Sorter (Plexon). Findings from the single-unit activities of two of the three animals (Monkeys O and T) have been reported previously (Skoblenick and Everling, 2014; Ma et al., 2015).
Drug administration.
Each experimental session began with a preinjection baseline period lasting at least 10 min. The animals received a single intramuscular injection of either 0.4 ml of ketamine (0.4 mg/kg for drug-naive subjects diluted in sterile saline) or 0.4 ml of sterile saline. Ketamine at this dosage elicited cognitive deficits with minimal anesthetic effects in rhesus monkeys (Condy et al., 2005; Stoet and Snyder, 2006; Shen et al., 2010; Blackman et al., 2013). Monkeys O and T consistently received 0.4 mg/kg. For Monkey A, which developed tolerance to ketamine, we analyzed the data after every session to confirm that significant change had been induced by ketamine in performance from 5–30 min postinjection compared with baseline. If this was not the case, the session was discarded and the dose was increased by 0.1 mg/kg for the next session; the maximum dose was 0.7 mg/kg. After the injections, the monkeys continued with the behavioral session for at least another 30 min. Ketamine treatments were spaced by at least 72 h to slow any development of tolerance.
Preprocessing.
From the three animals, a total of 230 channels had single-unit activities and thus were included in the LFP analyses (Monkey O: n = 41, Monkey T: n = 112, Monkey A: n = 77). Because the behavioral effects of ketamine took no more than 5 min to develop and returned to baseline 30 min after injection, we compared the period from 5 min to 30 min after injection to the 10–15 min baseline preceding the injection. LFP data were analyzed in MATLAB (The MathWorks; RRID:SCR_001622) using the FieldTrip toolbox (http://fieldtrip.fcdonders.nl/; RRID:SCR_001622) developed at the Donders Institute for Brain, Cognition and Behaviour (Oostenveld et al., 2011). The continuous signal was divided into discrete trials based on event time stamps. Trials in which delay period LFP power exceeded 10 SDs from the average were excluded from the analysis. The data were low-pass filtered at 100 Hz and line noise was removed at 60 Hz using a discrete Fourier transform. For the time–frequency presentation of LFP power, the data were tapered with a Hanning window with a size equivalent to four cycles of a given frequency before fast Fourier transform was performed. To compare LFP between channels and animals and to reduce variability, we used decibel normalization for each channel at each frequency (Herrmann et al., 2014):
where PRaw and PBaseline may refer to power after and before injections, respectively, in which case PNorm is the normalized change resulting from the treatment (see Fig. 2B,C). Alternatively, they may denote power from delay periods versus intertrial intervals (ITIs), where PNorm is the normalized task-related oscillatory power (see Fig. 3A).
Figure 2.
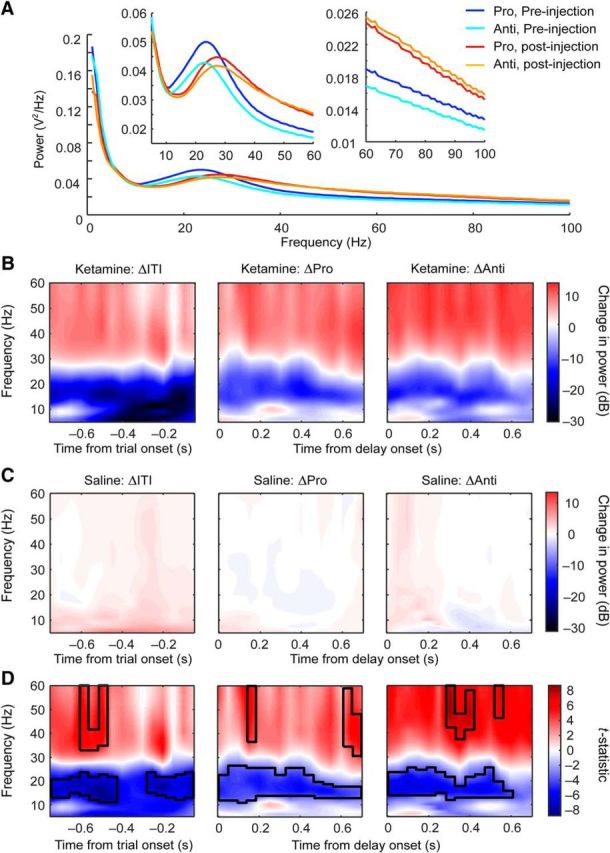
Effects of ketamine on intertrial and delay period LFP powers. A, Averaged LFP powers during prosaccade (dark blue) and antisaccade trials (light blue) before and after ketamine injections (prosaccades: red; antisaccades: orange). Left inset shows an enlarged view of the segments between 5 and 60 Hz; right inset shows an enlarged view of the segments between 60 and 100 Hz. B, Ketamine-induced changes in time-resolved power spectra during intertrial intervals (left), delay periods in prosaccade (middle), and in antisaccade trials (right). Colors indicate changes in LFP power in decibels. C, Saline-induced changes in spectrograms during the same nontask and task epochs and plotted on the same scale as in B. D, t statistic between the changes in LFP powers from ketamine (B) and saline (C) sessions in the same epochs. The black contours mark the frequencies and time bins where ketamine had a significant effect by permutation test.
Figure 3.
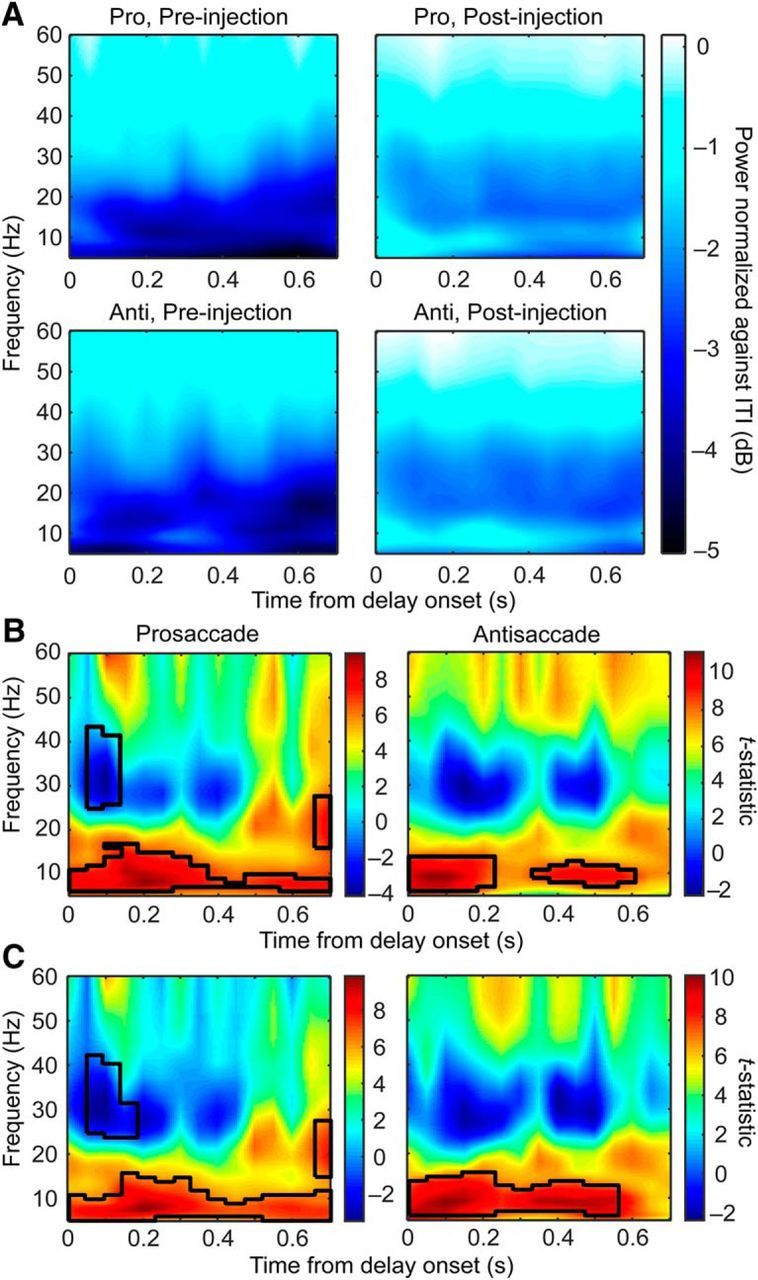
Effects of ketamine on delay period oscillatory power normalized against ITI. A, Delay period LFP power plotted as a decibel change from the power during ITI, respectively, for prosaccade (first row) and antisaccade (second row) trials before (left column) and after (right column) ketamine injections. White reflects a lack of change and, the darker the blue, the greater the reduction in power from the ITIs. B, Paired t statistics between LFP powers before and after ketamine injections for prosaccade (left) and antisaccade (right) trials. The black contours mark the frequencies and time bins where ketamine had a significant effect by permutation test. C, Similar to B but with correct trials only. The black contours mark the frequencies and time bins where ketamine had a significant effect.
Experimental design and statistical analysis.
To quantify the drug effect accurately, we used a within-subject design, in which the animals' neural activities as well as behavioral performance with ketamine on board were compared with the preinjection baseline period within the same recording session. For power spectral density data, we used repeated-measures ANOVA, with drug and rule both as within-subject factors. The following subsections provide the details to each statistical analysis that we performed.
Rule selectivity index (RSI).
To understand the effect of ketamine specifically on working memory and to avoid motor and reward artifacts, we limited our analysis to the delay period. To quantify the rule information contained in the activities, we calculated the RSI as follows:
 |
Where A may represent any aspect of neural activity. Using this equation, we calculated the RSI for LFP power and spike field consistency (see below).
Permutation test.
Statistical analyses on the time–frequency map of any variable, including the change in LFP power and in the RSI of power, were conducted using a nonparametric cluster-based method. Specifically, a map of t statistics was calculated between the two conditions. The significance level was then determined from a distribution of t statistics generated by 5000 iterations of pooling and random splitting of the data. Original t statistics that were >99.9% of the generated distribution were considered significant. Significant t statistics were then clustered using the clusterdata function in MATLAB.
Correlation between saccadic reaction time (SRT) and LFP power.
We calculated the correlation coefficients between SRT and single-trial delay period LFP power in 5 frequency bands (theta: 4–8 Hz, alpha: 9–12 Hz, low beta: 13–20 Hz, high beta: 21 to 30 Hz, low gamma: 31–60 Hz) normalized against the power during ITIs. Because these distributions were not strictly normal, we used Spearman's correlation. In addition, the sample size must be controlled because it affects the correlation coefficients: the smaller the sample size, the more likely it is to obtain a large value in rho. To make correlation coefficients comparable across rules, drug conditions, channels, and animals, we found the smallest number of correct trials (Kmin = 16) completed across all conditions and sessions. Then, for each channel and each condition, we randomly selected Kmin trials 1000 times. The resulting 1000 sets of SRTs were averaged, as were the sets of LFP powers, before the correlation was calculated for the channel in the given condition.
Waveform analysis for separation of broad-spiking neurons (BSNs) and narrow-spiking neurons (NSNs).
We defined putative pyramidal and interneurons based on the averaged peak-to-trough latency in their spike waveforms. This was done by reading the recorded extracellular waveforms into MATLAB from .nex files using codes provided by NeuroExplorer (Nex Technologies) and then computing the averaged temporal difference in the minimum and the maximum in the waveforms. Based on the bimodal distribution of the peak-to-trough latencies of the neuronal population recorded in this (see Fig. 6B), we defined neurons with peak-to-trough latencies shorter than 270 μs as NSNs and those with latencies longer than 270 μs as BSNs. This empirically determined criterion is also identical to that used in our previous studies using the same techniques (Johnston et al., 2009; Skoblenick and Everling, 2014; Ma et al., 2015).
Figure 6.

Effects of ketamine on delay period spike field phase consistency and the rule information it represents. A, Averaged MRL across all single units in preinjection prosaccade (dark blue) and antisaccade (light blue) trials were not significantly different from the MRLs in postinjection prosaccade (red) and antisaccade (orange) trials. B, Distribution of the peak-to-trough latency in the waveforms of single units did not differ across the three animals. Single units with peak-to-trough latencies <270 μs (dashed line) were putative interneurons labeled as NSNs; those with a peak-to-trough latency >270 μs were putative pyramidal neurons and labeled as BSNs. C, Ketamine injections reduced the RSI calculated based on the MRLs among putative pyramidal neurons. D, Ketamine injections also reduced the RSIs in putative interneurons. Shaded area indicates SEM.
Spike field phase consistency.
We used the mean resultant length (MRL) to quantify the spike field phase consistency (Sigurdsson et al., 2010). In each neuron, each spike is fired at a unique phase with the LFP oscillation at each frequency. This phase can be represented by a unit vector with length equal to one. The MRL for a given frequency is defined as the vector sum of these unit vectors representing the phases when the spikes occurred, divided by the number of spikes or number of unit vectors included in the calculation, resulting in a number between 0 and 1. Therefore, the MRL is independent of LFP power and is larger when these phases are similar than when they are dissimilar from spike to spike. However, the MRL is negatively correlated with the sample size of spikes: the more spikes a neuron fired, the greater the variance in the spike-associated oscillatory phases tends to be, resulting in a smaller vector sum and smaller MRLs. We controlled for the sample size bias by bootstrapping: for each neuron, eight spikes were selected randomly to calculate a single MRL, the process was repeated 1000 times, and the results were averaged to obtain the final result.
Results
Previously, we have characterized the effects of ketamine on behavior, LPFC single-unit activity, and ensemble activities in the memory-guided antisaccade task (Skoblenick and Everling, 2012, 2014; Ma et al., 2015). The current study focuses on the effects of ketamine on oscillatory activities during the delay period of this task. The subanesthetic dose of ketamine used in our paradigm successfully induces a working memory deficit in macaque monkeys that manifests within 5 min after injection and lasts for ∼25 min (Skoblenick and Everling, 2014; Ma et al., 2015). We therefore compared the neural activity in this window with those during the 10–15 min baseline activity to reveal the effects of ketamine. Within each trial, we used data collected during the first 0.7 s of each delay period when the monkeys had to maintain the rule information but had not yet received the directional information of the trial (Fig. 1A). The 0.7 s ITI before fixation was used as a baseline. All trials with a completed delay period and a saccadic response to the peripheral stimulus were included in the analyses.
Ketamine has opposite effects on beta and low-gamma activities and increased task-related alpha oscillations
Electrode arrays were implanted in the LPFC anterior to the arcuate sulcus, covering both the dorsal and the ventral banks of the principal sulcus (Fig. 1B). To ensure the quality of the LFP data, we only included the 230 channels (Monkey O: n = 41, Monkey T: n = 112, Monkey A: n = 77) on which well isolated single units were detected (Monkey O: n = 94, Monkey T: n = 232, Monkey A: n = 145) in the analyses. The averaged delay period LFP powers are shown in Figure 2A. Activity from 5–60 Hz is shown in the left inset, which reflect the strongest effects of the rule and interaction between it and ketamine, whereas activity from 60–100 Hz (Fig. 2A, right inset) simply shows a diminishing trend of the same effects already manifested between 40 and 60 Hz (Fig. 2A, left inset). We therefore focused all our subsequent analyses on the frequencies between 5 and 60 Hz.
To compare the effect of ketamine with saline control during both task and ITI, we decibel normalized the postinjection LFP power spectra by the preinjection LFP power [i.e., 10 × log10 (PPost/PPre); Fig. 2B,C]. This calculation also normalized the power spectra and allowed for valid averaging across channels and animals. In Figure 2B–D, red indicates an increase in power from before the injection, blue indicates a decrease, and white corresponds to a lack of change. Ketamine injections increased activities in the low-gamma band while decreasing activities in the beta band (Fig. 2B). However, this effect was not specific to the delay period of either prosaccade or antisaccade trials (Fig. 2B, middle and right); it was also observed during the ITIs (Fig. 2B, left). When plotted on the same scale, saline injections resulted in near-zero changes in LFP activities in both ITIs (Fig. 2C, left) and the delay periods of both trial types (Fig. 2C, middle and right). Both during the ITIs (Fig. 2D, left) and the delay periods (Fig. 2D, middle and right), ketamine increased low-gamma and decreased beta oscillations compared with the effect of saline by cluster-based permutation test using t statistics (p < 0.001, black contours delineate significant areas).
Given the similarity of the effects of ketamine during the ITI, we investigated whether ketamine-induced changes were correlated between ITI and delay periods; that is, whether the ketamine-induced change in LFP power during delay periods is somewhat predictable from the change in ITI on a given channel and vice versa. In prosaccade trials, we found that the changes in LFP power during ITI and delay periods were correlated from 6–60 Hz, with Spearman's correlation ranging from 0.21–0.66 (all with p ≤ 0.0015) with an average of 0.49 and an SD of 0.15. At 5 Hz, the changes in power were not correlated (r = 0.052, p = 0.42). In antisaccade trials, from 5–60 Hz, the correlation coefficients ranged from 0.51–0.75 (all with p < 4.9 × 10−324), with an average of 0.65. Therefore, when all trials in each condition were considered, the ketamine-induced change in power during the delay periods from a given channel is predictable from the change in power during the ITIs and vice versa.
To find the task-specific effect of ketamine, we normalized delay period activity against the activity during the ITIs (Fig. 3A). In Figure 3A, white indicates the same level of LFP activities as during the ITIs. Before ketamine injection, the delay period was associated with a maintained level of low-gamma activity and reduced level of oscillations in the beta and alpha bands (Fig. 3A, left). While maintaining the relative contrast between low-gamma and beta-band activities (Fig. 3A, right), ketamine appeared to weaken such task-related reduction in activity, especially in the alpha-frequency band. This is reflected as a relative increase in task-related alpha activity throughout the delay periods in both prosaccade and antisaccade trials (Fig. 3B, black contours signify significant areas by permutation test, p < 0.001). In the prosaccade trials, a decrease in the high-beta/low-gamma activity early in the delay period and an increase in beta toward the end also reached significance (Fig. 3B, left), although the same was not found in antisaccade trials (Fig. 3B, right). In short, ketamine interacted with the effect of the task by attenuating the task-related decrease in alpha-band activities.
The analyses described above were performed on all trials, correct or error, provided that the delay period was completed. To determine to what extent the greater number of error trials after ketamine injection contributed to the task-related decrease in alpha activities, we repeated the analysis with data from correct trials only. Similar to results obtained from the all-trial analysis (Fig. 3B), ketamine also weakened the task-related alpha desynchronization throughout the delay periods in correct trials (Fig. 3C, black contours signify significant areas by permutation test, p < 0.001). This observation indicates that correct saccadic direction after ketamine injections may be decided via altered cognitive processes; for example, based on weaker confidence or random choices. In addition, it shows that the reduction in alpha desynchronization was not correlated with the behavioral impairment caused by ketamine injections. It remains possible that the change in alpha oscillations was associated with altered cognitive processing, such as a weakening in sustained attention without affecting the working memory content, which is supported by an increase in the reaction time in the correct trials (see below). To detect any relationship between LFP power and task performance and the effect of ketamine on such a relationship, we next examined the drug-induced change in performance, the difference between correct and error trial LFP power, and the correlation between LFP and reaction time.
LFP power in relation to behavior and the effects of ketamine
Before investigating whether LFP power is related to behavior, we first summarize the change in behavior from the preinjection to the postinjection periods. Ketamine significantly reduced the mean percentage of correct response from 95.0% to 87.1% in prosaccade trials and from 88.2% to 78.6% in antisaccade trials (Fig. 4A; 2-way ANOVA, effect of drug: F(1,128) = 20.4, p = 1.4 × 10⁻⁵, effect of rule: F(1,128) = 15.5, p = 1.4 × 10⁻⁴, no interaction: F(1,128) = 0.207, p = 0.65; post hoc Tukey's test: p = 0.021 for prosaccades, p = 0.0025 for antisaccades). The direction errors, which were included in the delay period LFP analyses, were also increased by ketamine (F(1,128) = 26.8, p = 8.5 × 10⁻⁷). This type of error was committed more often on the antisaccade trials (F(1,128) = 10.6, p = 0.0014), but ketamine did not increase these errors more among these trials (no interaction: F(1,128) = 0.28, p = 0.60). Ketamine also significantly increased the mean SRT from 155.2 to 224.9 ms in prosaccade trials and from 211.2 to 264.7 ms in antisaccade trials (Fig. 4B; 2-way ANOVA, effect of drug: F(1,128) = 89.5, p = 2.0 × 10⁻¹⁶, effect of rule: F(1,128) = 54.1, p = 2.0 × 10⁻¹¹, no interaction: F(1,128) = 1.53, p = 0.22; post hoc Tukey's test: prosaccades: p = 3.8 × 10⁻⁹, antisaccades: p = 3.9 × 10⁻⁸). This increase was comparable in correct trials and in error trials (mean SRT from 184.7 to 247.4 ms and from 180.6 to 239.1 ms, respectively; 2-way ANOVA, effect of drug: F(1,128) = 44.1, p = 8.5 × 10⁻¹⁰, no effect of performance: F(1,128) = 0.458, p = 0.50, no interaction: F(1,128) = 0.0557, p = 0.81; post hoc Tukey's test: correct: p = 5.0 × 10⁻⁶; error: p = 4.5 × 10⁻⁵), so the increased erroneous saccades could not be explained by weakened inhibitory control, which would result in errors with shorter SRTs.
Figure 4.
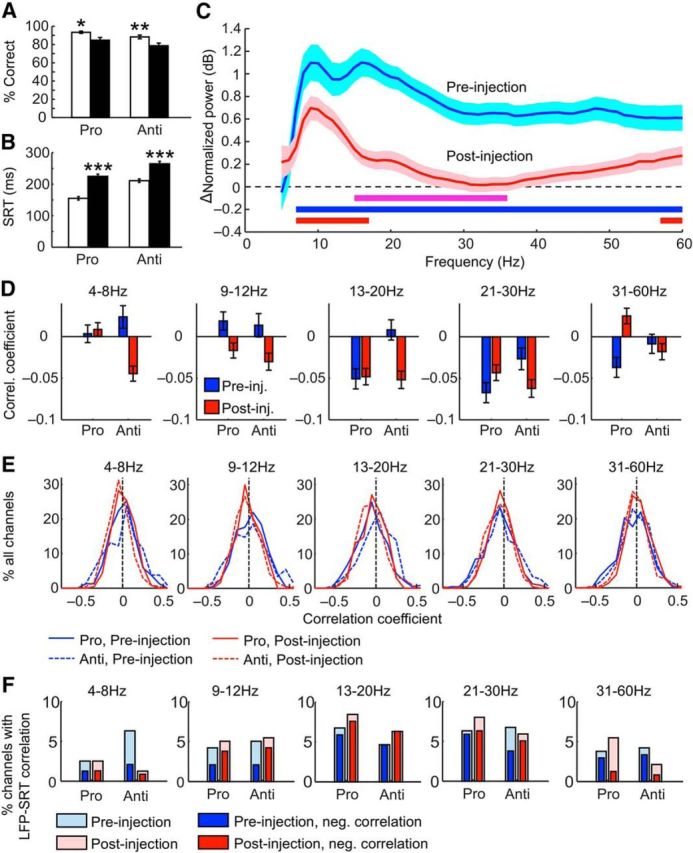
Effects of ketamine on behavior and on the relationship between oscillatory activities and behavior. A, Percentage of correct trials of all trials performed before (empty bars) and after (filled bars) ketamine injections. This percentage decreased in both prosaccade and antisaccade trials. B, SRT of all trials in which a saccade was completed before (empty bars) and after (filled bars) ketamine injections. The SRTs were significantly longer after ketamine injections for both trial types. C, Difference in normalized LFP power during delay periods between correct and error trials before (blue curve) and after (red curve) ketamine injection. Before the injections, the difference was significant throughout alpha, beta, and low-gamma frequencies (blue horizontal bar) and this range narrowed to alpha and low-beta plus the upper low-gamma ranges (red bar). The effect of the drug reached significance at beta frequencies (purple bar). The shaded envelope surrounding each curve indicates SEM. D, Averaged correlation coefficients (Spearman's ρ) of correlations from each channel between single-trial delay period LFP power and the subsequent SRTs before (blue bars) and after (red bars) ketamine injections. From left to right, the five panels display the correlations using oscillatory power in the theta (4–8 Hz), alpha (9–12 Hz), low-beta (13–20 Hz), high-beta (21–30 Hz), and low-gamma (31–60 Hz) bands, respectively. E, Distribution of LFP–SRT correlation coefficients of all channels before (blue lines) and after (red lines) ketamine injection in prosaccade (solid lines) and antisaccade (dashed lines) trials in each of the five frequency bands as defined in D. F, Percentage of channels with significant single-trial LFP–SRT correlation before (light blue bars) and after (light red bars) ketamine injections in each of the five frequency bands as defined in D. The deep red and blue bars within each bar indicate the percentage of channels with significant negative LFP–SRT correlations. *p < 0.05, **p < 0.005, ***p < 5 × 10⁻⁸.
If delay period LFP power contains task-related information, then it is expected to differ on correct and error trials and this difference may be affected by ketamine. For these analyses, we used antisaccade trials only because many sessions had no errors on prosaccade trials before ketamine injection. Although more errors were made on antisaccades, in half of all sessions, preinjection antisaccade trials still contained fewer than three direction errors, which did not provide enough samples for time-resolved spectrograms. We therefore calculated the averaged ITI-normalized LFP power across the entire delay period and then computed the difference between correct and error trials during the preinjection (Fig. 4C, blue curve) and postinjection (Fig. 4C, red curve) periods. The difference between correct and error trials was significant throughout all frequencies from 7–60 Hz (paired t tests, FDR-adjusted p = 4.9 × 10−324 to 0.00039; Fig. 4C, blue horizontal bar) during baseline and this range was narrowed to 7–17 Hz and 57–60 Hz (FDR-adjusted p = 1.1 × 10⁻⁷ to 0.0497; Fig. 4C, red horizontal bar) under the influence of ketamine. The drug reduced the difference between correct and error trials in LFP power (repeated-measures ANOVA, effect of drug: F(1,438) = 26.0, p = 5.1 × 10⁻⁷; Fig. 4C, purple horizontal bar) and this effect was significant from 15–36 Hz (post hoc Tukey's test, p = 5.8 × 10⁻⁵ to 0.037), which corresponds approximately to the beta band.
We then investigated whether delay period LFP power predicts the subsequent SRT on a trial-to-trial basis in 5 frequency bands: theta (4–8 Hz), alpha (9–12 Hz), low-beta (13–20 Hz), high-beta (21–30 Hz), and low-gamma (31–60 Hz). For each channel in each condition, we obtained a correlation coefficient (Spearman's ρ) from single-trial ITI-normalized delay period LFP power and the corresponding SRT across all correct trials. To compare across conditions in which different numbers of correct trials were completed, we used a bootstrapping method to control for the effect of sample size on correlation coefficients (see Materials and Methods). Across all channels, before the injections, a negative correlation between delay period power and SRT was observed in both beta and low-gamma bands (one-sample t test, low beta: t(229) = −4.03, FDR-corrected p = 0.0001, high-beta: t(229) = −5.21, FDR-corrected p = 8.4 × 10⁻⁷, low-gamma: t(229) = −3.08, FDR-corrected p = 0.0092), but not theta (t(229) = 0.393, FDR-corrected p = 0.69) and alpha bands (t(229) = 1.82, FDR-corrected p = 0.095) for prosaccade trials (Fig. 4D, blue bars to the left). For antisaccade trials, negative correlation was only found in high-beta band (right blue bars; t(229) = −1.98, FDR-corrected p = 0.049). After the injections, the correlations remained significantly below zero in low- and high-beta bands for prosaccade trials (one-sample t test, low-beta: t(229) = −4.74, FDR-corrected p = 7.6 × 10⁻⁶, high-beta: t(229) = −4.44, FDR-corrected p = 1.9 × 10⁻⁵). For antisaccade trials, negative correlation was now observed in theta (t(229) = −4.33, FDR-corrected p = 8.8 × 10⁻⁵), marginally in alpha (t(229) = −2.49, FDR-corrected p = 0.053) and low-beta (t(229) = −5.04, FDR-corrected p = 3.8 × 10⁻⁶) band in addition to the high-beta band (t(229) = −5.56, FDR-corrected p = 3.0 × 10⁻⁷). These results were not biased by a minority of channels because the distribution of correlation coefficients from all channels peaked below zero under all conditions in the high-beta range (Fig. 4E). In other frequency bands, the distributions were consistent with the findings from the t tests. Overall, high-beta band power is weakly but significantly predictive of the subsequent SRT for both rules before or after injections. Consistent with this finding, the percentage of channels having LFP power correlate significantly with the SRT peaked in the beta range (Fig. 4F, light red and blue bars), where most of these correlations were negative (dark red and blue bars). Overall, delay period LFP powers, especially in the beta range, had a detectable relationship with the subsequent SRT. The weakness of this relationship was not unexpected given the numerous factors contributing to both behavior and neural oscillatory activities.
We observed a main effect of ketamine on the LFP–SRT correlations in theta, alpha, low-beta, and low-gamma bands (repeated-measures ANOVA, F(1,229) = 8.81, 10.2, 6.97, and 6.34, p = 0.0033, 0.0016, 0.0089, and 0.013, respectively). In theta, alpha, and low-beta bands, this was due to a negative shift in the correlations after ketamine injections (Fig. 4D). This may reflect an increase in cognitive resources focusing on the task to meet the challenge of ketamine. It should be noted that changes in the LFP–SRT correlation is independent of any effect of ketamine on the overall LFP power because the correlation was calculated across trials within each condition. Together with changes in performance-related oscillatory activities (Fig. 4C), these findings support that ketamine altered the relationship between LFP and behavioral performance.
Ketamine reduces rule information encoded in oscillatory power
So far, we have established that ketamine causes profound changes in the oscillatory activities in the LPFC. It remains unclear whether ketamine specifically affects the representation of rule information in these activities. First, to visualize the difference between the rules, we calculated the rule preference for each channel by subtracting the delay period LFP power in antisaccade trials from the power in prosaccade trials and then divided by the sum of the two. The rationale is that, if the delay period activity recorded from a given channel is greater for one rule over the other, then the magnitude of the activity on each individual trial provides downstream neurons with this rule information, which may then contribute to behavioral performance. Positive values for the rule preference indicate stronger activity during the prosaccade trials, whereas negative values indicate stronger activity on the antisaccade trials. This was calculated separately for the preinjection and postinjection periods (Fig. 5A, left and right). We then performed a permutation test to find the frequencies and time bins at which the values were significantly above or below zero (p < 0.001; Fig. 5A, left, black contours). We found that prosaccade trials had stronger beta activities during mid-delay and late delay periods (red areas in black contours), whereas antisaccade trials had stronger theta/alpha activity (5–12 Hz) in mid-delay periods (Fig. 5A, left, blue area in black contour). The antisaccade-associated activities started earlier but did not last until the end of the delay periods. By the same permutation test, no significant area was detected after ketamine injections (Fig. 5A, right), indicating a reduction in the difference in oscillatory activities associated with the two rules.
Figure 5.
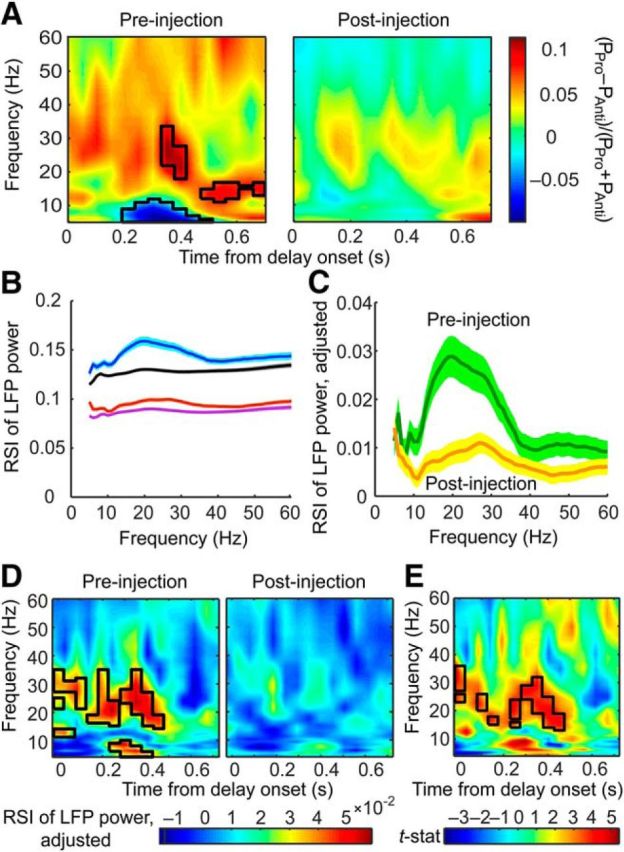
Rule representation in the delay period LFP powers was weakened by ketamine. A, Left, Rule preference calculated by dividing the difference between LFP power during prosaccade and antisaccade trials (PPro − PAnti) by the sum of the two. Stronger beta activities were found in prosaccade trials (red areas in black contour) by a permutation test over one-sample t statistic, whereas stronger theta/alpha activities were found in antisaccade trials (blue areas in black contour). Right, Postinjection rule preference. No value significantly above or below zero was found by the same permutation test as for the preinjection ratio. B, RSIs between prosaccade and antisaccade trials before (blue curve) and after (red curve) injections. Also plotted are the pseudo-SIs between random groups of trials before (black curve) and after (purple curve) injections. The shaded areas above and below each curve indicate the SEM. C, Adjusted RSI, calculated as the original RSI minus the background pseudo-SI, before (green curve) and after (orange curve) ketamine injections. D, Adjusted RSI calculated from time-resolved power spectra before (left) and after (right) injections. The black contour indicates frequencies and time bins in which the RSI values were significantly above zero. Such frequencies and time bins were only found before, not after, the injections. E, Paired t statistics between the RSIs before and after injections from all channels calculated for each frequency and time bin. The black contours mark the frequencies and time bins in which ketamine had a significant effect by permutation test.
In this analysis, whereas it appears that each rule is associated with a distinct frequency band, this pattern was an average across all channels in which positive and negative values of the rule preference canceled each other out, obscuring rule-related activities that varied by recording site. In addition, it was conflated by overall reductions in the power and possibly the dynamic range of oscillations at beta and lower frequencies (Fig. 2B,D) after ketamine treatment. To control for this confound and to quantify rule representation accurately, we calculated the RSI by taking the absolute value of the rule preference described above (Fig. 5B, before injection: blue curve, after injection: red curve; Womelsdorf et al., 2010). This additional step not only prevented the selectivity of different channels canceling each other out, it also allowed the calculation of the pseudoselectivity index (pseudo-SI) between randomly assigned groups of trials, which is the background noise of RSI and is correlated with LFP power. Given the change in beta and gamma power, it would be important to determine whether the actual RSI changed by a greater magnitude than such a background effect of ketamine. We therefore calculated the pseudo-SI between 1000 pairs of groups containing randomly assigned prosaccade and antisaccade trials (Fig. 5B, before injection: black curve, after injection: purple curve) and compared these values with the actual RSIs. Indeed, ketamine reduced both the RSIs and the pseudo-SIs from shuffled trial groups (repeated-measures ANOVA, F(1,458) = 782, p < 4.9 × 10−324, post hoc Tukey's test, ketamine effect for RSIs: p = 7.7 × 10⁻⁶, for pseudo-SIs: p = 7.7 × 10⁻⁶). To account for this background change, we subtracted the pseudo-SI obtained for each frequency and each channel from the actual RSI from both before (Fig. 5C, green curve) and after (orange curve) ketamine injections. The adjusted RSIs were still significantly reduced by ketamine (repeated-measures ANOVA, F(1,229) = 13.5, p = 0.0003), demonstrating the specific effect of the drug on rule information. Post hoc analysis revealed a significant reduction in the beta band (13–31 Hz, p < 0.05 at each frequency).
Our analyses so far used the RSI calculated from the entire delay period. Time-resolved graphs of the RSI, adjusted by subtracting pseudo-SIs, show that this effect is not uniform throughout this epoch: the RSIs significantly above zero appeared in the beta and theta/alpha band in early and mid-delay time bins (permutation test on one-sample t statistic, p < 0.001; Fig. 5D, left, black contours). By the same test, such significant RSIs were not found after ketamine injections (Fig. 5D, right). This difference is clearly visible in the t statistic map between the two conditions (permutation test on paired t statistic, p < 0.001, Fig. 5E), in which the black contours highlight the frequency bands and time bins where the RSI decreased significantly.
Ketamine reduces rule information encoded in spike field phase consistency
The phase coupling between spikes from individual neurons and the local oscillations is a measurement of neural synchronization and thus is likely to be affected in a disconnection syndrome. Before analyzing the spike field relationship, we first examined the effect of ketamine on spiking activities. We recorded a total 452 well isolated single units. Of these, we included 369 units that had more than eight spikes in the delay periods of all trials in each rule-by-treatment condition. Consistent with our previous reports (Skoblenick and Everling, 2012; Ma et al., 2015), ketamine resulted in a significant increase in averaged firing rates across all prefrontal neurons (paired t test, t(368) = −8.64, p = 2.2 × 10⁻¹⁶), from 5.14 ± 0.31 Hz to 6.36 ± 0.34 Hz (mean ± SEM).
We then quantified the spike field consistency using the MRL and analyzed the effect of ketamine. Because the MRL is affected by spike counts, to be able to compare across neurons and to remove the confounding effect of ketamine on firing rates, we used a bootstrapping method. This was done by taking a random sample of eight spikes for each MRL calculation, repeating the process 1000 times, and then averaging all of the results for the final MRL for each neuron at a given frequency. The task rule had a significant effect on MRL (repeated-measures ANOVA, F(1,368) = 31.4, p = 4.2 × 10⁻⁸), meaning that individual neurons tended to have greater MRL values for one rule over the other. However, ketamine did not have any effect on the MRL (F(1,368) = 1.42, p = 0.23) nor did it have any interactive effect with the rule (F(1,368) = 1.17, p = 0.28, Fig. 6A).
Similar to previous reports (Johnston et al., 2009; Ma et al., 2015), we found that the peak-to-trough latencies in the spike waveforms of our recorded neuronal population followed a bimodal distribution, which was true for each of the three monkeys (Fig. 6B). Therefore, units with peak-to-trough latencies >270 μs were categorized as BSNs or putative pyramidal neurons, whereas those with shorter latencies were grouped as the NSNs or putative interneurons.
Although ketamine did not affect the spike phase consistency per se, it may still affect the rule information it contains. Therefore, for each neuronal group, we calculated the RSI in the MRL values based on the same equation as used for the RSI in LFP power. We found that ketamine decreased the SI significantly (repeated-measures ANOVA, F(1,366) = 121.5, p < 4.9 × 10−324) in both the BSNs (post hoc Tukey's test: p = 7.7 × 10⁻⁶; Fig. 6C) and the NSNs (p = 7.7 × 10⁻⁶; Fig. 6D). We conclude that ketamine has a deleterious effect on the rule information encoded in the spike field consistency of both putative pyramidal and interneurons.
Discussion
Using an NMDAR antagonist, we replicated in nonhuman primates the frequency-dependent changes in oscillatory activities associated with schizophrenia (de la Salle et al., 2016). Similar to EEG studies with patients and with healthy volunteers receiving NMDAR antagonists, we observed an enhancement in the gamma rhythm (Plourde et al., 1997; Basar-Eroglu et al., 2007; Barr et al., 2010; Hong et al., 2010; Sun et al., 2011) accompanied by a decrease in beta-band activities (Krishnan et al., 2005; Uhlhaas et al., 2006; Hirano et al., 2008; Ghorashi and Spencer, 2015; Liddle et al., 2016) during the task. A similar pattern of changes in neural oscillations was also observed during ITIs, which is consistent with findings in resting-state EEG (Kikuchi et al., 2011; de la Salle et al., 2016; Ramyead et al., 2016) and MEG (Rivolta et al., 2015) studies with patients.
Neural oscillations may be a mechanism whereby neurons are recruited dynamically to serve different functions in different tasks, thus achieving enormous flexibility in information coding (Akam and Kullmann, 2010). Given the versatility of neurons in the PFC (Jung et al., 1998; Rigotti et al., 2013; Ma et al., 2016) and the region's role in behavioral flexibility (Stuss and Benson, 1984; Duncan, 2001; Miller and Cohen, 2001), oscillatory activity is likely to be functionally relevant. Because gamma-band oscillations may reflect local, bottom-up processes (Engel et al., 1992; Senkowski et al., 2008; Fries, 2009; Lundqvist et al., 2016), ketamine-induced increase in gamma activities is consistent with the LPFC hyperactivity in patients with schizophrenia (Whitfield-Gabrieli et al., 2009). Beta activities may reflect a top-down control mechanism traveling from the frontal cortex to posterior cortices (Buschman and Miller, 2009; Engel and Fries, 2010; Oswal et al., 2012), so the decrease in beta power that we observed corresponds well with the LPFC hypoconnectivity in patients (Grillon et al., 2013).
At the cellular level, both cortical pyramidal neurons and interneurons likely played critical roles in these changes in oscillatory power. Because cortical pyramidal neurons receive cortical input through their apical dendrites, which have a high density of NMDARs (Monaghan and Cotman, 1985; Rosier et al., 1993), NMDAR blockade has been suggested to liberate the local gamma oscillators from long-range communications (Uhlhaas and Singer, 2012). This may lead to the simultaneous dampening in beta activity and augmentation in gamma oscillations. In addition, these effects may be mediated by the fast-spiking parvalbumin-positive (PV+) interneurons (Goldman-Rakic et al., 2004; Jackson et al., 2004; Homayoun and Moghaddam, 2007), which are critical for the generation of gamma-range activities (Lodge et al., 2009; Sohal et al., 2009; Takada et al., 2014) and also contribute to beta rhythms in the neocortex through GABAergic transmission (Yamawaki et al., 2008). In patients with schizophrenia, PV+ neurons lose excitatory synapses with the progression of the disease (Chung et al., 2016). This may explain the reduction in gamma activities (Cho et al., 2006; Haenschel et al., 2009), but does not explain why its enhancement is correlated with the manifestation of cognitive symptoms such as disorganization and reality distortion (Lee et al., 2003). In rodents, the gamma-enhancing effect of ketamine can be replicated by blocking NMDARs containing the GluN2A subunit, but not the ones with GluN2B–D (Kocsis, 2012). Because most GluN2A-containing receptors are found on the PV+ interneurons (Kinney et al., 2006), they may appear to be the main mediator of the effects of ketamine. One type of ketamine metabolite, (2S,6S;2R,6R)-hydroxynorketamine, stimulates AMPA receptors (AMPARs) (Zanos et al., 2016). Because activating PV+ interneurons is sufficient to drive gamma oscillation (Sohal et al., 2009), the direct activation of AMPARs by (2S,6S;2R,6R)-hydroxynorketamine on PV+ interneurons is also likely to contribute to the increase in gamma activities. Because NMDARs and AMPARs mediate currents with very different time constants, future theoretical work may help to elucidate how this shifted balance in NMDAR/AMPAR activity changes the PV+ interneurons' ability to generate gamma oscillations or its involvement in the beta rhythms.
Although beta and gamma oscillations play important roles in working memory processes (Pesaran et al., 2002; Kopell et al., 2011), alpha-band activities in the frontoparietal network are known to correlate negatively with attentional processes in humans (Laufs et al., 2003; Mantini et al., 2007). Although we observed some reduction in 20–40 Hz oscillatory power, it did not reach significance beyond a brief 200 ms period in prosaccade trials (Fig. 3B). Instead, we found a lasting increase in the task–ITI power difference in alpha band in both trial type due to a task-related alpha desynchronization during preinjection delay periods (Fig. 3A, left column) and a relative lack of this change after the treatment (Fig. 3A, right column). Because a similar change in alpha desynchronization were included in the analysis (Fig. 3C), this effect of ketamine was not directly related to the deterioration in task performance. Instead, it indicates that the animals may have used alternative strategies such as choosing randomly when not confident of the current rule due to weakened attention, even when they ended up making the correct choices. This speculation is supported by the fact that the correct trials after injection had longer SRTs than their preinjection counterparts (Fig. 4B) and is consistent with the view that alpha activities are associated with inattention (Paneri and Gregoriou, 2017).
We were able to quantify the task rule information encoded in neural oscillation and spike field phase consistency through the RSI and demonstrated the effect of ketamine on both measurements. On average, we observed stronger beta activities for prosaccade trials and stronger theta/alpha activities for the antisaccade rule across all channels (Fig. 5A). Alpha-band synchrony during a nondominant rule was suggested to help suppress the irrelevant prepotent rule (Buschman et al., 2012), the prosaccade rule in our task. For an agent capable of the antisaccade task, Lo and Wang (2016) suggested two computational components: one for inhibition of the prepotent response and the other for selecting the correct choice based on the information in working memory. It may be speculated that, whereas alpha activities contribute to the necessary inhibition, beta activities may be a manifestation of the rule-response mapping process, especially given that beta power correlates with SRT at the single trial level. Given that postinjection error trials had longer rather than shorter SRTs, it appears that ketamine's impact on memory-guided action selection was greater than any influence it may have on the inhibition of prepotent response. Somewhat inconsistent with the role of alpha activities is that it was not correlated with the SRTs on antisaccade trials (Fig. 4D), although alpha activity did differ between correct and error trials when data were combined across trials (Fig. 4C). Therefore, it is possible that any direct influence of alpha activities on reaction time was obscured by trial-by-trial variability in both neural oscillations and behavior. A better understanding of the role of alpha activities in rule representation and decision making will require future investigation.
In the beta band, we found distinct rule-related activity in the delay periods, which was abolished by ketamine (Fig. 5C–E). Given that beta activities may reflect a top-down control mechanism traveling from the frontal cortex to more posterior cortices where sensorimotor or cognitive states are maintained (Buschman and Miller, 2009; Engel and Fries, 2010; Oswal et al., 2012), this finding may reflect diminished corticocortical communication (Donner and Siegel, 2011; Hipp et al., 2011; Bastos et al., 2015; Fries, 2015) regarding the task rule.
Consistent with a critical role of beta activities in rule representation, we found a diminished difference between correct and error trials mainly in the beta band (Fig. 4C). In addition, we found that beta activities were predictive of subsequent SRTs and this correlation persisted and strengthened especially on antisaccade trials after ketamine injections (Fig. 4D–F). Because only correct trials were included in this analysis, this strengthened correlation may reflect a compensatory mechanism when beta power was weakened by ketamine. These findings strongly support the functional relevance of beta oscillations and are consistent with its involvement in the inhibition of competing movements (Pfurtscheller, 1981; Swann et al., 2009) and the correlation between beta synchrony and working memory load (Babiloni et al., 2004; Axmacher et al., 2008). Previous studies of the frontal cortex have also identified a connection between anticipatory rule-selective beta synchrony with the animal's reaction time (Buschman et al., 2012), between prestimulus beta power and synchrony and sensory response time (Liang et al., 2002; Zhang et al., 2008), and between long-range beta synchrony and performance (Gross et al., 2006).
As a form of neural synchrony, the spike field phase consistency may be a mechanism whereby neurons flexibly form and reform task-relevant ensembles depending on the task at hand (Womelsdorf et al., 2007). Too little coupling between neuronal activities and oscillations was suggested to result in disorganized spike timing (Voytek and Knight, 2015), which in turn may decrease the impact of neural ensemble activity on function (Fries, 2015). Therefore, our finding that ketamine reduced the rule selectivity in spike field phase consistency is congruent with the impaired coordination within and beyond the LPFC. Future studies recording from more than one region of the working memory network will hopefully shed light on the altered cortical communication after NMDAR antagonist administration. Given how closely our results on oscillatory changes resembles those from EEG studies involving patients or healthy people given NMDAR antagonists (Krishnan et al., 2005; Uhlhaas et al., 2006; Hirano et al., 2008; Ghorashi and Spencer, 2015; Liddle et al., 2016), it is possible that similar changes in rule encoding in oscillatory activities occur in humans as well.
In summary, our study characterized a range of effects of ketamine on low-frequency oscillatory activities and supported their functional relevance. These effects simulated the oscillatory changes observed in human patients with schizophrenia (Uhlhaas and Singer, 2010, 2013) and demonstrated the effectiveness of the ketamine model in the study of working memory impairment in a syndrome of disconnection. Our findings can be used to elucidate the cellular- and molecular-level abnormalities in schizophrenia through theoretical analyses as delineated by MacDonald et al. (2015), thereby further our understanding of this complex syndrome.
Footnotes
This research was supported by the Canadian Institutes of Health Research (Foundation Grant FRN 148365 to S.E. and a postdoctoral fellowship to L.M.).
The authors declare no competing financial interests.
References
- Akam T, Kullmann DM (2010) Oscillations and filtering networks support flexible routing of information. Neuron 67:308–320. 10.1016/j.neuron.2010.06.019 [DOI] [PMC free article] [PubMed] [Google Scholar]
- Axmacher N, Schmitz DP, Wagner T, Elger CE, Fell J (2008) Interactions between medial temporal lobe, prefrontal cortex, and inferior temporal regions during visual working memory: a combined intracranial EEG and functional magnetic resonance imaging study. J Neurosci 28:7304–7312. 10.1523/JNEUROSCI.1778-08.2008 [DOI] [PMC free article] [PubMed] [Google Scholar]
- Babiloni C, Brancucci A, Arendt-Nielsen L, Babiloni F, Capotosto P, Carducci F, Cincotti F, Del Percio C, Petrini L, Rossini PM, Chen AC (2004) Attentional processes and cognitive performance during expectancy of painful galvanic stimulations: a high-resolution EEG study. Behav Brain Res 152:137–147. 10.1016/j.bbr.2003.10.004 [DOI] [PubMed] [Google Scholar]
- Barr MS, Farzan F, Tran LC, Chen R, Fitzgerald PB, Daskalakis ZJ (2010) Evidence for excessive frontal evoked gamma oscillatory activity in schizophrenia during working memory. Schizophr Res 121:146–152. 10.1016/j.schres.2010.05.023 [DOI] [PubMed] [Google Scholar]
- Basar-Eroglu C, Brand A, Hildebrandt H, Karolina Kedzior K, Mathes B, Schmiedt C (2007) Working memory related gamma oscillations in schizophrenia patients. Int J Psychophysiol 64:39–45. 10.1016/j.ijpsycho.2006.07.007 [DOI] [PubMed] [Google Scholar]
- Bastos AM, Vezoli J, Bosman CA, Schoffelen JM, Oostenveld R, Dowdall JR, De Weerd P, Kennedy H, Fries P (2015) Visual areas exert feedforward and feedback influences through distinct frequency channels. Neuron 85:390–401. 10.1016/j.neuron.2014.12.018 [DOI] [PubMed] [Google Scholar]
- Benchenane K, Tiesinga PH, Battaglia FP (2011) Oscillations in the prefrontal cortex: a gateway to memory and attention. Curr Opin Neurobiol 21:475–485. 10.1016/j.conb.2011.01.004 [DOI] [PubMed] [Google Scholar]
- Blackman RK, Macdonald AW 3rd, Chafee MV (2013) Effects of ketamine on context-processing performance in monkeys: a new animal model of cognitive deficits in schizophrenia. Neuropsychopharmacology 38:2090–2100. 10.1038/npp.2013.118 [DOI] [PMC free article] [PubMed] [Google Scholar]
- Buschman TJ, Miller EK (2009) Serial, covert shifts of attention during visual search are reflected by the frontal eye fields and correlated with population oscillations. Neuron 63:386–396. 10.1016/j.neuron.2009.06.020 [DOI] [PMC free article] [PubMed] [Google Scholar]
- Buschman TJ, Denovellis EL, Diogo C, Bullock D, Miller EK (2012) Synchronous oscillatory neural ensembles for rules in the prefrontal cortex. Neuron 76:838–846. 10.1016/j.neuron.2012.09.029 [DOI] [PMC free article] [PubMed] [Google Scholar]
- Cho RY, Konecky RO, Carter CS (2006) Impairments in frontal cortical gamma synchrony and cognitive control in schizophrenia. Proc Natl Acad Sci U S A 103:19878–19883. 10.1073/pnas.0609440103 [DOI] [PMC free article] [PubMed] [Google Scholar]
- Chung DW, Fish KN, Lewis DA (2016) Pathological basis for deficient excitatory drive to cortical parvalbumin interneurons in schizophrenia. Am J Psychiatry 173:1131–1139. 10.1176/appi.ajp.2016.16010025 [DOI] [PMC free article] [PubMed] [Google Scholar]
- Condy C, Wattiez N, Rivaud-Péchoux S, Gaymard B (2005) Ketamine-induced distractibility: an oculomotor study in monkeys. Biol Psychiatry 57:366–372. 10.1016/j.biopsych.2004.10.036 [DOI] [PubMed] [Google Scholar]
- Daume J, Gruber T, Engel AK, Friese U (2017) Phase-amplitude coupling and long-range phase synchronization reveal frontotemporal interactions during visual working memory. J Neurosci 37:313–322. 10.1523/JNEUROSCI.2130-16.2016 [DOI] [PMC free article] [PubMed] [Google Scholar]
- de la Salle S, Choueiry J, Shah D, Bowers H, McIntosh J, Ilivitsky V, Knott V (2016) Effects of ketamine on resting-state EEG activity and their relationship to Perceptual/Dissociative symptoms in healthy humans. Front Pharmacol 7:348. 10.3389/fphar.2016.00348 [DOI] [PMC free article] [PubMed] [Google Scholar]
- Donner TH, Siegel M (2011) A framework for local cortical oscillation patterns. Trends Cogn Sci 15:191–199. 10.1016/j.tics.2011.03.007 [DOI] [PubMed] [Google Scholar]
- Driesen NR, McCarthy G, Bhagwagar Z, Bloch MH, Calhoun VD, D'Souza DC, Gueorguieva R, He G, Leung HC, Ramani R, Anticevic A, Suckow RF, Morgan PT, Krystal JH (2013) The impact of NMDA receptor blockade on human working memory-related prefrontal function and connectivity. Neuropsychopharmacology 38:2613–2622. 10.1038/npp.2013.170 [DOI] [PMC free article] [PubMed] [Google Scholar]
- Duncan J. (2001) An adaptive coding model of neural function in prefrontal cortex. Nat Rev Neurosci 2:820–829. 10.1038/35097575 [DOI] [PubMed] [Google Scholar]
- Durstewitz D, Seamans JK, Sejnowski TJ (2000) Neurocomputational models of working memory. Nat Neurosci 3:1184–1191. 10.1038/81460 [DOI] [PubMed] [Google Scholar]
- Elvevåg B, Goldberg TE (2000) Cognitive impairment in schizophrenia is the core of the disorder. Crit Rev Neurobiol 14:1–21. [PubMed] [Google Scholar]
- Engel AK, Fries P (2010) Beta-band oscillations–signalling the status quo? Curr Opin Neurobiol 20:156–165. 10.1016/j.conb.2010.02.015 [DOI] [PubMed] [Google Scholar]
- Engel AK, König P, Schillen TB (1992) Why does the cortex oscillate? Curr Biol 2:332–334. 10.1016/0960-9822(92)90898-K [DOI] [PubMed] [Google Scholar]
- Enomoto T, Floresco SB (2009) Disruptions in spatial working memory, but not short-term memory, induced by repeated ketamine exposure. Prog Neuropsychopharmacol Biol Psychiatry 33:668–675. 10.1016/j.pnpbp.2009.03.013 [DOI] [PubMed] [Google Scholar]
- Fries P. (2009) The model- and the data-gamma. Neuron 64:601–602. 10.1016/j.neuron.2009.11.024 [DOI] [PubMed] [Google Scholar]
- Fries P. (2015) Rhythms for cognition: communication through coherence. Neuron 88:220–235. 10.1016/j.neuron.2015.09.034 [DOI] [PMC free article] [PubMed] [Google Scholar]
- Friston KJ. (1998) The disconnection hypothesis. Schizophr Res 30:115–125. 10.1016/S0920-9964(97)00140-0 [DOI] [PubMed] [Google Scholar]
- Ghorashi S, Spencer KM (2015) Attentional load effects on beta oscillations in healthy and schizophrenic individuals. Front Psychiatry 6:149. 10.3389/fpsyt.2015.00149 [DOI] [PMC free article] [PubMed] [Google Scholar]
- Gil-da-Costa R, Stoner GR, Fung R, Albright TD (2013) Nonhuman primate model of schizophrenia using a noninvasive EEG method. Proc Natl Acad Sci U S A 110:15425–15430. 10.1073/pnas.1312264110 [DOI] [PMC free article] [PubMed] [Google Scholar]
- Goldman-Rakic PS, Castner SA, Svensson TH, Siever LJ, Williams GV (2004) Targeting the dopamine D1 receptor in schizophrenia: insights for cognitive dysfunction. Psychopharmacology (Berl) 174:3–16. 10.1007/s00213-004-1793-y [DOI] [PubMed] [Google Scholar]
- Green MF. (1996) What are the functional consequences of neurocognitive deficits in schizophrenia? Am J Psychiatry 153:321–330. 10.1176/ajp.153.3.321 [DOI] [PubMed] [Google Scholar]
- Grillon ML, Oppenheim C, Varoquaux G, Charbonneau F, Devauchelle AD, Krebs MO, Baylé F, Thirion B, Huron C (2013) Hyperfrontality and hypoconnectivity during refreshing in schizophrenia. Psychiatry Res 211:226–233. 10.1016/j.pscychresns.2012.09.001 [DOI] [PubMed] [Google Scholar]
- Gross A, Joutsiniemi SL, Rimon R, Appelberg B (2006) Correlation of symptom clusters of schizophrenia with absolute powers of main frequency bands in quantitative EEG. Behav Brain Funct 2:23. 10.1186/1744-9081-2-23 [DOI] [PMC free article] [PubMed] [Google Scholar]
- Haenschel C, Bittner RA, Waltz J, Haertling F, Wibral M, Singer W, Linden DE, Rodriguez E (2009) Cortical oscillatory activity is critical for working memory as revealed by deficits in early-onset schizophrenia. J Neurosci 29:9481–9489. 10.1523/JNEUROSCI.1428-09.2009 [DOI] [PMC free article] [PubMed] [Google Scholar]
- Halgren E, Boujon C, Clarke J, Wang C, Chauvel P (2002) Rapid distributed fronto-parieto-occipital processing stages during working memory in humans. Cereb Cortex 12:710–728. 10.1093/cercor/12.7.710 [DOI] [PubMed] [Google Scholar]
- Herrmann B, Schlichting N, Obleser J (2014) Dynamic range adaptation to spectral stimulus statistics in human auditory cortex. J Neurosci 34:327–331. 10.1523/JNEUROSCI.3974-13.2014 [DOI] [PMC free article] [PubMed] [Google Scholar]
- Hipp JF, Engel AK, Siegel M (2011) Oscillatory synchronization in large-scale cortical networks predicts perception. Neuron 69:387–396. 10.1016/j.neuron.2010.12.027 [DOI] [PubMed] [Google Scholar]
- Hirano S, Hirano Y, Maekawa T, Obayashi C, Oribe N, Kuroki T, Kanba S, Onitsuka T (2008) Abnormal neural oscillatory activity to speech sounds in schizophrenia: a magnetoencephalography study. J Neurosci 28:4897–4903. 10.1523/JNEUROSCI.5031-07.2008 [DOI] [PMC free article] [PubMed] [Google Scholar]
- Homayoun H, Moghaddam B (2007) NMDA receptor hypofunction produces opposite effects on prefrontal cortex interneurons and pyramidal neurons. J Neurosci 27:11496–11500. 10.1523/JNEUROSCI.2213-07.2007 [DOI] [PMC free article] [PubMed] [Google Scholar]
- Homayoun H, Stefani MR, Adams BW, Tamagan GD, Moghaddam B (2004) Functional interaction between NMDA and mGlu5 receptors: effects on working memory, Instrumental Learning, Motor Behaviors, and Dopamine Release. Neuropsychopharmacology 29:1259–1269. 10.1038/sj.npp.1300417 [DOI] [PubMed] [Google Scholar]
- Honey RA, Honey GD, O'Loughlin C, Sharar SR, Kumaran D, Bullmore ET, Menon DK, Donovan T, Lupson VC, Bisbrown-Chippendale R, Fletcher PC (2004) Acute ketamine administration alters the brain responses to executive demands in a verbal working memory task: an FMRI study. Neuropsychopharmacology 29:1203–1214. 10.1038/sj.npp.1300438 [DOI] [PMC free article] [PubMed] [Google Scholar]
- Hong LE, Summerfelt A, Buchanan RW, O'Donnell P, Thaker GK, Weiler MA, Lahti AC (2010) Gamma and delta neural oscillations and association with clinical symptoms under subanesthetic ketamine. Neuropsychopharmacology 35:632–640. 10.1038/npp.2009.168 [DOI] [PMC free article] [PubMed] [Google Scholar]
- Jackson ME, Homayoun H, Moghaddam B (2004) NMDA receptor hypofunction produces concomitant firing rate potentiation and burst activity reduction in the prefrontal cortex. Proc Natl Acad Sci U S A 101:8467–8472. 10.1073/pnas.0308455101 [DOI] [PMC free article] [PubMed] [Google Scholar]
- Johnston K, Everling S (2006) Neural activity in monkey prefrontal cortex is modulated by task context and behavioral instruction during delayed-match-to-sample and conditional prosaccade-antisaccade tasks. J Cogn Neurosci 18:749–765. 10.1162/jocn.2006.18.5.749 [DOI] [PubMed] [Google Scholar]
- Johnston K, DeSouza JF, Everling S (2009) Monkey prefrontal cortical pyramidal and putative interneurons exhibit differential patterns of activity between prosaccade and antisaccade tasks. J Neurosci 29:5516–5524. 10.1523/JNEUROSCI.5953-08.2009 [DOI] [PMC free article] [PubMed] [Google Scholar]
- Jung MW, Qin Y, McNaughton BL, Barnes CA (1998) Firing characteristics of deep layer neurons in prefrontal cortex in rats performing spatial working memory tasks. Cereb Cortex 8:437–450. 10.1093/cercor/8.5.437 [DOI] [PubMed] [Google Scholar]
- Kikuchi M, Hashimoto T, Nagasawa T, Hirosawa T, Minabe Y, Yoshimura M, Strik W, Dierks T, Koenig T (2011) Frontal areas contribute to reduced global coordination of resting-state gamma activities in drug-naive patients with schizophrenia. Schizophr Res 130:187–194. 10.1016/j.schres.2011.06.003 [DOI] [PubMed] [Google Scholar]
- Kinney JW, Davis CN, Tabarean I, Conti B, Bartfai T, Behrens MM (2006) A specific role for NR2A-containing NMDA receptors in the maintenance of parvalbumin and GAD67 immunoreactivity in cultured interneurons. J Neurosci 26:1604–1615. 10.1523/JNEUROSCI.4722-05.2006 [DOI] [PMC free article] [PubMed] [Google Scholar]
- Kocsis B. (2012) Differential role of NR2A and NR2B subunits in N-methyl-D-aspartate receptor antagonist-induced aberrant cortical gamma oscillations. Biol Psychiatry 71:987–995. 10.1016/j.biopsych.2011.10.002 [DOI] [PMC free article] [PubMed] [Google Scholar]
- Kopell N, Whittington MA, Kramer MA (2011) Neuronal assembly dynamics in the beta1 frequency range permits short-term memory. Proc Natl Acad Sci U S A 108:3779–3784. 10.1073/pnas.1019676108 [DOI] [PMC free article] [PubMed] [Google Scholar]
- Krishnan GP, Vohs JL, Hetrick WP, Carroll CA, Shekhar A, Bockbrader MA, O'Donnell BF (2005) Steady state visual evoked potential abnormalities in schizophrenia. Clin Neurophysiol 116:614–624. 10.1016/j.clinph.2004.09.016 [DOI] [PubMed] [Google Scholar]
- Lara AH, Wallis JD (2015) The role of prefrontal cortex in working memory: a mini review. Front Syst Neurosci 9:173. 10.3389/fnsys.2015.00173 [DOI] [PMC free article] [PubMed] [Google Scholar]
- Laufs H, Krakow K, Sterzer P, Eger E, Beyerle A, Salek-Haddadi A, Kleinschmidt A (2003) Electroencephalographic signatures of attentional and cognitive default modes in spontaneous brain activity fluctuations at rest. Proc Natl Acad Sci U S A 100:11053–11058. 10.1073/pnas.1831638100 [DOI] [PMC free article] [PubMed] [Google Scholar]
- Lee KH, Williams LM, Haig A, Gordon E (2003) “Gamma (40 Hz) phase synchronicity” and symptom dimensions in schizophrenia. Cogn Neuropsychiatry 8:57–71. 10.1080/713752240 [DOI] [PubMed] [Google Scholar]
- Lett TA, Voineskos AN, Kennedy JL, Levine B, Daskalakis ZJ (2014) Treating working memory deficits in schizophrenia: a review of the neurobiology. Biol Psychiatry 75:361–370. 10.1016/j.biopsych.2013.07.026 [DOI] [PubMed] [Google Scholar]
- Liang H, Bressler SL, Ding M, Truccolo WA, Nakamura R (2002) Synchronized activity in prefrontal cortex during anticipation of visuomotor processing. Neuroreport 13:2011–2015. 10.1097/00001756-200211150-00004 [DOI] [PubMed] [Google Scholar]
- Liddle EB, Price D, Palaniyappan L, Brookes MJ, Robson SE, Hall EL, Morris PG, Liddle PF (2016) Abnormal salience signaling in schizophrenia: the role of integrative beta oscillations. Hum Brain Mapp 37:1361–1374. 10.1002/hbm.23107 [DOI] [PMC free article] [PubMed] [Google Scholar]
- Lo CC, Wang XJ (2016) Conflict Resolution as Near-Threshold Decision-Making: A Spiking Neural Circuit Model with Two-Stage Competition for Antisaccadic Task. PLoS Comput Biol 12:e1005081. 10.1371/journal.pcbi.1005081 [DOI] [PMC free article] [PubMed] [Google Scholar]
- Lodge DJ, Behrens MM, Grace AA (2009) A loss of parvalbumin-containing interneurons is associated with diminished oscillatory activity in an animal model of schizophrenia. J Neurosci 29:2344–2354. 10.1523/JNEUROSCI.5419-08.2009 [DOI] [PMC free article] [PubMed] [Google Scholar]
- Lundqvist M, Rose J, Herman P, Brincat SL, Buschman TJ, Miller EK (2016) Gamma and beta bursts underlie working memory. Neuron 90:152–164. 10.1016/j.neuron.2016.02.028 [DOI] [PMC free article] [PubMed] [Google Scholar]
- Ma L, Skoblenick K, Seamans JK, Everling S (2015) Ketamine-induced changes in the signal and noise of rule representation in working memory by lateral prefrontal neurons. J Neurosci 35:11612–11622. 10.1523/JNEUROSCI.1839-15.2015 [DOI] [PMC free article] [PubMed] [Google Scholar]
- Ma L, Hyman JM, Durstewitz D, Phillips AG, Seamans JK (2016) A quantitative analysis of context-dependent remapping of medial frontal cortex neurons and ensembles. J Neurosci 36:8258–8272. 10.1523/JNEUROSCI.3176-15.2016 [DOI] [PMC free article] [PubMed] [Google Scholar]
- MacDonald Iii AW, Zick JL, Chafee MV, Netoff TI (2015) Integrating insults: using fault tree analysis to guide schizophrenia research across levels of analysis. Front Hum Neurosci 9:698. 10.3389/fnhum.2015.00698 [DOI] [PMC free article] [PubMed] [Google Scholar]
- Mantini D, Perrucci MG, Del Gratta C, Romani GL, Corbetta M (2007) Electrophysiological signatures of resting state networks in the human brain. Proc Natl Acad Sci U S A 104:13170–13175. 10.1073/pnas.0700668104 [DOI] [PMC free article] [PubMed] [Google Scholar]
- McDowell JE, Clementz BA (2001) Behavioral and brain imaging studies of saccadic performance in schizophrenia. Biol Psychol 57:5–22. 10.1016/S0301-0511(01)00087-4 [DOI] [PubMed] [Google Scholar]
- Miller EK, Cohen JD (2001) An integrative theory of prefrontal cortex function. Annu Rev Neurosci 24:167–202. 10.1146/annurev.neuro.24.1.167 [DOI] [PubMed] [Google Scholar]
- Monaghan DT, Cotman CW (1985) Distribution of N-methyl-D-aspartate-sensitive L-[3H]glutamate-binding sites in rat brain. J Neurosci 5:2909–2919. [DOI] [PMC free article] [PubMed] [Google Scholar]
- Morgan CJ, Mofeez A, Brandner B, Bromley L, Curran HV (2004) Acute effects of ketamine on memory systems and psychotic symptoms in healthy volunteers. Neuropsychopharmacology 29:208–218. 10.1038/sj.npp.1300342 [DOI] [PubMed] [Google Scholar]
- Muthukumaraswamy SD, Shaw AD, Jackson LE, Hall J, Moran R, Saxena N (2015) Evidence that subanesthetic doses of ketamine cause sustained disruptions of NMDA and AMPA-mediated frontoparietal connectivity in humans. J Neurosci 35:11694–11706. 10.1523/JNEUROSCI.0903-15.2015 [DOI] [PMC free article] [PubMed] [Google Scholar]
- Myles JB, Rossell SL, Phillipou A, Thomas E, Gurvich C (2017) Insights to the schizophrenia continuum: a systematic review of saccadic eye movements in schizotypy and biological relatives of schizophrenia patients. Neurosci Biobehav Rev 72:278–300. 10.1016/j.neubiorev.2016.10.034 [DOI] [PubMed] [Google Scholar]
- Oostenveld R, Fries P, Maris E, Schoffelen JM (2011) FieldTrip: open source software for advanced analysis of MEG, EEG, and invasive electrophysiological data. Comput Intell Neurosci 2011:156869. 10.1155/2011/156869 [DOI] [PMC free article] [PubMed] [Google Scholar]
- Oswal A, Litvak V, Sauleau P, Brown P (2012) Beta reactivity, prospective facilitation of executive processing, and its dependence on dopaminergic therapy in Parkinson's disease. J Neurosci 32:9909–9916. 10.1523/JNEUROSCI.0275-12.2012 [DOI] [PMC free article] [PubMed] [Google Scholar]
- Paneri S, Gregoriou GG (2017) Top-down control of visual attention by the prefrontal cortex. functional specialization and long-range interactions. Front Neurosci 11:545. 10.3389/fnhum.2017.00545 [DOI] [PMC free article] [PubMed] [Google Scholar]
- Pesaran B, Pezaris JS, Sahani M, Mitra PP, Andersen RA (2002) Temporal structure in neuronal activity during working memory in macaque parietal cortex. Nat Neurosci 5:805–811. 10.1038/nn890 [DOI] [PubMed] [Google Scholar]
- Pfurtscheller G. (1981) Central beta rhythm during sensorimotor activities in man. Electroencephalogr Clin Neurophysiol 51:253–264. 10.1016/0013-4694(81)90139-5 [DOI] [PubMed] [Google Scholar]
- Phillips WA, Silverstein SM (2003) Convergence of biological and psychological perspectives on cognitive coordination in schizophrenia. Behav Brain Sci 26:65–82; discussion 82–137. [DOI] [PubMed] [Google Scholar]
- Plourde G, Baribeau J, Bonhomme V (1997) Ketamine increases the amplitude of the 40-hz auditory steady-state response in humans. Br J Anaesth 78:524–529. 10.1093/bja/78.5.524 [DOI] [PubMed] [Google Scholar]
- Puig MV, Miller EK (2015) Neural substrates of dopamine D2 receptor modulated executive functions in the monkey prefrontal cortex. Cereb Cortex 25:2980–2987. 10.1093/cercor/bhu096 [DOI] [PMC free article] [PubMed] [Google Scholar]
- Ramyead A, Studerus E, Kometer M, Uttinger M, Gschwandtner U, Fuhr P, Riecher-Rössler A (2016) Prediction of psychosis using neural oscillations and machine learning in neuroleptic-naive at-risk patients. World J Biol Psychiatry 17:285–295. 10.3109/15622975.2015.1083614 [DOI] [PubMed] [Google Scholar]
- Rawley JB, Constantinidis C (2009) Neural correlates of learning and working memory in the primate posterior parietal cortex. Neurobiol Learn Mem 91:129–138. 10.1016/j.nlm.2008.12.006 [DOI] [PMC free article] [PubMed] [Google Scholar]
- Rigotti M, Barak O, Warden MR, Wang XJ, Daw ND, Miller EK, Fusi S (2013) The importance of mixed selectivity in complex cognitive tasks. Nature 497:585–590. 10.1038/nature12160 [DOI] [PMC free article] [PubMed] [Google Scholar]
- Rivolta D, Heidegger T, Scheller B, Sauer A, Schaum M, Birkner K, Singer W, Wibral M, Uhlhaas PJ (2015) Ketamine dysregulates the amplitude and connectivity of high-frequency oscillations in cortical-subcortical networks in humans: evidence from resting-state magnetoencephalography-recordings. Schizophr Bull 41:1105–1114. 10.1093/schbul/sbv051 [DOI] [PMC free article] [PubMed] [Google Scholar]
- Rosier A, Arckens L, Orban GA, Vandesande F (1993) Immunocytochemical detection of astrocyte GABAA receptors in cat visual cortex. J Histochem Cytochem 41:685–692. 10.1177/41.5.8385682 [DOI] [PubMed] [Google Scholar]
- Salinas E, Sejnowski TJ (2000) Impact of correlated synaptic input on output firing rate and variability in simple neuronal models. J Neurosci 20:6193–6209. [DOI] [PMC free article] [PubMed] [Google Scholar]
- Salinas E, Sejnowski TJ (2001) Correlated neuronal activity and the flow of neural information. Nat Rev Neurosci 2:539–550. 10.1038/35086012 [DOI] [PMC free article] [PubMed] [Google Scholar]
- Senkowski D, Schneider TR, Foxe JJ, Engel AK (2008) Crossmodal binding through neural coherence: implications for multisensory processing. Trends Neurosci 31:401–409. 10.1016/j.tins.2008.05.002 [DOI] [PubMed] [Google Scholar]
- Shen K, Kalwarowsky S, Clarence W, Brunamonti E, Paré M (2010) Beneficial effects of the NMDA antagonist ketamine on decision processes in visual search. J Neurosci 30:9947–9953. 10.1523/JNEUROSCI.6317-09.2010 [DOI] [PMC free article] [PubMed] [Google Scholar]
- Sigurdsson T, Stark KL, Karayiorgou M, Gogos JA, Gordon JA (2010) Impaired hippocampal-prefrontal synchrony in a genetic mouse model of schizophrenia. Nature 464:763–767. 10.1038/nature08855 [DOI] [PMC free article] [PubMed] [Google Scholar]
- Skoblenick K, Everling S (2012) NMDA antagonist ketamine reduces task selectivity in macaque dorsolateral prefrontal neurons and impairs performance of randomly interleaved prosaccades and antisaccades. J Neurosci 32:12018–12027. 10.1523/JNEUROSCI.1510-12.2012 [DOI] [PMC free article] [PubMed] [Google Scholar]
- Skoblenick K, Everling S (2014) N-methyl-d-aspartate receptor antagonist ketamine impairs action-monitoring activity in the prefrontal cortex. J Cogn Neurosci 26:577–592. 10.1162/jocn_a_00519 [DOI] [PubMed] [Google Scholar]
- Skoblenick KJ, Womelsdorf T, Everling S (2016) Ketamine alters outcome-related local field potentials in monkey prefrontal cortex. Cereb Cortex 26:2743–2752. 10.1093/cercor/bhv128 [DOI] [PMC free article] [PubMed] [Google Scholar]
- Sohal VS, Zhang F, Yizhar O, Deisseroth K (2009) Parvalbumin neurons and gamma rhythms enhance cortical circuit performance. Nature 459:698–702. 10.1038/nature07991 [DOI] [PMC free article] [PubMed] [Google Scholar]
- Soh P, Narayanan B, Khadka S, Calhoun VD, Keshavan MS, Tamminga CA, Sweeney JA, Clementz BA, Pearlson GD (2015) Joint coupling of awake EEG frequency activity and MRI gray matter volumes in the psychosis dimension: a BSNIP study. Front Psychiatry 6:162. 10.3389/fpsyt.2015.00162 [DOI] [PMC free article] [PubMed] [Google Scholar]
- Stephan KE, Baldeweg T, Friston KJ (2006) Synaptic plasticity and dysconnection in schizophrenia. Biol Psychiatry 59:929–939. 10.1016/j.biopsych.2005.10.005 [DOI] [PubMed] [Google Scholar]
- Stoet G, Snyder LH (2006) Effects of the NMDA antagonist ketamine on task-switching performance: evidence for specific impairments of executive control. Neuropsychopharmacology 31:1675–1681. 10.1038/sj.npp.1300930 [DOI] [PubMed] [Google Scholar]
- Stuss DT, Benson DF (1984) Neuropsychological studies of the frontal lobes. Psychol Bull 95:3–28. 10.1037/0033-2909.95.1.3 [DOI] [PubMed] [Google Scholar]
- Sun Y, Farzan F, Barr MS, Kirihara K, Fitzgerald PB, Light GA, Daskalakis ZJ (2011) gamma oscillations in schizophrenia: mechanisms and clinical significance. Brain Res 1413:98–114. 10.1016/j.brainres.2011.06.065 [DOI] [PubMed] [Google Scholar]
- Swann N, Tandon N, Canolty R, Ellmore TM, McEvoy LK, Dreyer S, DiSano M, Aron AR (2009) Intracranial EEG reveals a time- and frequency-specific role for the right inferior frontal gyrus and primary motor cortex in stopping initiated responses. J Neurosci 29:12675–12685. 10.1523/JNEUROSCI.3359-09.2009 [DOI] [PMC free article] [PubMed] [Google Scholar]
- Takada N, Pi HJ, Sousa VH, Waters J, Fishell G, Kepecs A, Osten P (2014) A developmental cell-type switch in cortical interneurons leads to a selective defect in cortical oscillations. Nat Commun 5:5333. 10.1038/ncomms6333 [DOI] [PMC free article] [PubMed] [Google Scholar]
- Uhlhaas PJ, Singer W (2010) Abnormal neural oscillations and synchrony in schizophrenia. Nat Rev Neurosci 11:100–113. 10.1038/nrn2774 [DOI] [PubMed] [Google Scholar]
- Uhlhaas PJ, Singer W (2012) Neuronal dynamics and neuropsychiatric disorders: toward a translational paradigm for dysfunctional large-scale networks. Neuron 75:963–980. 10.1016/j.neuron.2012.09.004 [DOI] [PubMed] [Google Scholar]
- Uhlhaas PJ, Singer W (2013) High-frequency oscillations and the neurobiology of schizophrenia. Dialogues Clin Neurosci 15:301–313. [DOI] [PMC free article] [PubMed] [Google Scholar]
- Uhlhaas PJ, Linden DE, Singer W, Haenschel C, Lindner M, Maurer K, Rodriguez E (2006) Dysfunctional long-range coordination of neural activity during gestalt perception in schizophrenia. J Neurosci 26:8168–8175. 10.1523/JNEUROSCI.2002-06.2006 [DOI] [PMC free article] [PubMed] [Google Scholar]
- van Os J, Kapur S (2009) Schizophrenia. Lancet 374:635–645. 10.1016/S0140-6736(09)60995-8 [DOI] [PubMed] [Google Scholar]
- Voytek B, Knight RT (2015) Dynamic network communication as a unifying neural basis for cognition, development, aging, and disease. Biol Psychiatry 77:1089–1097. 10.1016/j.biopsych.2015.04.016 [DOI] [PMC free article] [PubMed] [Google Scholar]
- Wang XJ. (1999) Synaptic basis of cortical persistent activity: the importance of NMDA receptors to working memory. J Neurosci 19:9587–9603. [DOI] [PMC free article] [PubMed] [Google Scholar]
- Whitfield-Gabrieli S, Thermenos HW, Milanovic S, Tsuang MT, Faraone SV, McCarley RW, Shenton ME, Green AI, Nieto-Castanon A, LaViolette P, Wojcik J, Gabrieli JD, Seidman LJ (2009) Hyperactivity and hyperconnectivity of the default network in schizophrenia and in first-degree relatives of persons with schizophrenia. Proc Natl Acad Sci U S A 106:1279–1284. 10.1073/pnas.0809141106 [DOI] [PMC free article] [PubMed] [Google Scholar]
- Womelsdorf T, Schoffelen JM, Oostenveld R, Singer W, Desimone R, Engel AK, Fries P (2007) Modulation of neuronal interactions through neuronal synchronization. Science 316:1609–1612. 10.1126/science.1139597 [DOI] [PubMed] [Google Scholar]
- Womelsdorf T, Johnston K, Vinck M, Everling S (2010) Theta-activity in anterior cingulate cortex predicts task rules and their adjustments following errors. Proc Natl Acad Sci U S A 107:5248–5253. 10.1073/pnas.0906194107 [DOI] [PMC free article] [PubMed] [Google Scholar]
- Womelsdorf T, Valiante TA, Sahin NT, Miller KJ, Tiesinga P (2014) Dynamic circuit motifs underlying rhythmic gain control, gating and integration. Nat Neurosci 17:1031–1039. 10.1038/nn.3764 [DOI] [PubMed] [Google Scholar]
- Yamawaki N, Stanford IM, Hall SD, Woodhall GL (2008) Pharmacologically induced and stimulus evoked rhythmic neuronal oscillatory activity in the primary motor cortex in vitro. Neuroscience 151:386–395. 10.1016/j.neuroscience.2007.10.021 [DOI] [PubMed] [Google Scholar]
- Zanos P, Moaddel R, Morris PJ, Georgiou P, Fischell J, Elmer GI, Alkondon M, Yuan P, Pribut HJ, Singh NS, Dossou KS, Fang Y, Huang XP, Mayo CL, Wainer IW, Albuquerque EX, Thompson SM, Thomas CJ, Zarate CA Jr, Gould TD (2016) NMDAR inhibition-independent antidepressant actions of ketamine metabolites. Nature 533:481–486. 10.1038/nature17998 [DOI] [PMC free article] [PubMed] [Google Scholar]
- Zhang Y, Wang X, Bressler SL, Chen Y, Ding M (2008) Prestimulus cortical activity is correlated with speed of visuomotor processing. J Cogn Neurosci 20:1915–1925. 10.1162/jocn.2008.20132 [DOI] [PubMed] [Google Scholar]