

Abstract
In the hemaphroditic sea snail, Aplysia californica, reproduction is initiated when the bag cell neurons secrete egg-laying hormone during a protracted afterdischarge. A source of depolarization for the afterdischarge is a voltage-gated, nonselective cation channel, similar to transient receptor potential (TRP) channels. Once the afterdischarge is triggered, phospholipase C (PLC) is activated to hydrolyze phosphatidylinositol-4,5-bisphosphate (PIP2) into diacylglycerol (DAG) and inositol trisphosphate (IP3). We previously reported that a DAG analog, 1-oleoyl-2-acetyl-sn-glycerol (OAG), activates a prominent, inward whole-cell cationic current that is enhanced by IP3. To examine the underlying mechanism, we investigated the effect of exogenous OAG and IP3, as well as PLC activation, on cation channel activity and voltage dependence in excised, inside-out patches from cultured bag cell neurons. OAG transiently elevated channel open probability (PO) when applied to excised patches; however, coapplication of IP3 prolonged the OAG-induced response. In patches exposed to OAG and IP3, channel voltage dependence was left-shifted; this was also observed with OAG, but not to the same extent. Introducing the PLC activator, m-3M3FBS, to patches increased channel PO, suggesting PLC may be physically linked to the channels. Accordingly, blocking PLC with U-73122 ablated the m-3M3FBS-induced elevation in PO. Treatment with m-3M3FBS left-shifted cation channel voltage dependence to a greater extent than exogenous OAG and IP3. Finally, OAG and IP3 potentiated the stimulatory effect of PKC, which is also associated with the channel. Thus, the PLC-PKC signaling system is physically localized such that PIP2 breakdown products liberated during the afterdischarge modulate the cation channel and temporally influence neuronal activity.
SIGNIFICANCE STATEMENT Using excised patches from Aplysia bag cell neurons, we present the first evidence of a nonselective cation channel physically associating with phospholipase C (PLC) at the single-channel level. PLC-mediated breakdown of phospholipids generates diacylglycerol and inositol trisphosphate, which activate the cation channel. This is mimicked by exogenous lipids; furthermore, these second messengers left-shift channel voltage dependence and enhance the response of the channel to protein kinase C. PLC-mediated lipid signaling controls single-channel currents to ensure depolarization is maintained for an extended period of firing, termed the afterdischarge, when the bag cell neurons secrete egg-laying hormone to trigger reproduction.
Keywords: afterdischarge, diacylglycerol, inositol trisphosphate, mollusk, neuroendocrine cell, voltage dependence
Introduction
Phospholipids are key regulators of ion channel function and are implicated in both cardiovascular and neuronal signaling, with the latter including sight, pain, sensory processing, and neuroendocrine function (Wen et al., 2012; Hansen, 2015; Hille et al., 2015; Hilgemann et al., 2018). Of the phosphoinositides, phosphatidylinositol-4,5-bisphosphate (PIP2) is the most prominent in terms of signaling. Despite being only a minor component of the plasma membrane (∼1%) (McLaughlin and Murray, 2005), PIP2 exerts many effects on different ion channels and transporters, likely from PIP2-rich lipid rafts where signaling is concentrated (Allen et al., 2007; Gamper and Shapiro, 2007; Hilgemann, 2007). Moreover, phospholipase C (PLC) breaks down PIP2 into its constituents, inositol trisphosphate (IP3) and diacylglycerol (DAG), which serve as second messengers in many cell types, including neurons (Kockskämper et al., 2008; Berridge, 2009). IP3 mobilizes intracellular Ca2+ from the endoplasmic reticulum, whereas DAG activates protein kinase C (PKC) (Nishizuka, 1984; Newton, 1997; Decrock et al., 2013). Collectively, this pathway is involved with all aspects of cellular function of animals, including Aplysia (Sossin and Abrams, 2009; Hansen, 2015).
Ongoing research indicates that DAG and IP3 also directly gate or modulate various ion channels, including gap junctions and inwardly rectifying K+ channels, as well as native and transient receptor potential (TRP) nonselective cation channels (Albert and Large, 2003; Gamper and Shapiro, 2007; Decrock et al., 2013). TRP channels are a diverse cation channel superfamily, some of which are voltage-dependent, permeable to both monovalent and divalent cations, sensitive to intracellular Ca2+, and play a role in a myriad of cellular processes (Clapham, 2003; Montell, 2005; Hardie, 2007). Both PIP2 and DAG directly gate TRP channels, either by modulation of the lipid microenvironment surrounding the channels or via classic agonist-like binding to the channel (Hofmann et al., 1999; Hansen, 2015; Hille et al., 2015). Recent high-resolution structures indicate possible direct lipid interaction sites on TRP channels (Gao et al., 2016; Guo et al., 2017).
The present study examines the effect of DAG and IP3 on a Ca2+-activated, voltage-dependent, nonselective cation channel from the bag cell neurons of the marine mollusk, Aplysia californica. This channel provides depolarizing drive to maintain the afterdischarge, a prolonged period of enhanced excitability and action potential firing that results in the bag cell neurons secreting egg-laying hormone to initiate reproduction (Kupfermann and Kandel, 1970; Pinsker and Dudek, 1977; Conn and Kaczmarek, 1989; Magoski, 2017). The afterdischarge is triggered by cholinergic synaptic input and characterized by ∼30 min of synchronized spiking during which intracellular Ca2+ levels rise, PIP2 is broken down by PLC into IP3 and DAG, and PKC is activated (Kaczmarek et al., 1978; Fink et al., 1988; Fisher et al., 1994; Wayne et al., 1999; Michel and Wayne, 2002; White and Magoski, 2012).
Gardam and Magoski (2009) discovered that IP3 can suppress the Ca2+ dependence of the Aplysia cation channel, whereas Sturgeon and Magoski (2016) revealed that DAG activates a separate, voltage-independent cationic current at the whole-cell level. We now demonstrate that an analog of DAG activates the cation channel at the single-channel level, in part due to modulation of voltage dependence. Moreover, there is a synergy between DAG and IP3 in terms of enhancing channel activity and voltage dependence. Remarkably, PLC itself appears to be closely associated with the cation channel in excised patches. Thus, PIP2 metabolite-mediated regulation is in place to maintain the afterdischarge by activating the channel, ultimately ensuring the prolonged secretion of egg-laying hormone to induce reproduction.
Materials and Methods
Animal care and cell culture
Adult A. californica (a hermaphrodite) weighing 150–800 g were obtained from Marinus. Animals were housed in an ∼300 L aquarium containing continuously circulating, aerated sea water (Instant Ocean, Aquarium Systems) at 16°C–18°C on a 12/12 h light/dark cycle and fed romaine lettuce five times/week. All experiments were approved by the Queen's University Animal Care Committee (protocols Magoski 2013-041 or Magoski 2017-1745).
For primary cultures of individual, isolated bag cell neurons, animals were anesthetized by an injection of isotonic MgCl2 (∼50% of body weight), and the abdominal ganglion was removed and treated with dispase II (13.3 mg/ml; 165859; Roche Diagnostics) dissolved in tissue culture artificial sea water (tcASW) (460 mm NaCl, 10.4 mm KCl, 11 mm CaCl2, 55 mm MgCl2, 15 mm HEPES, 1 mg/ml glucose, 100 U/ml penicillin, and 0.1 mg/ml streptomycin, pH 7.8 with NaOH) for 18 h at 22°C. The ganglion was then rinsed in tcASW for 1 h, and the bag cell neuron clusters were dissected from their surrounding connective tissue. Using a fire-polished glass Pasteur pipette and gentle trituration, neurons were dissociated and dispersed in tcASW onto 35 × 10 mm polystyrene tissue culture dishes (C353001 BD Falcon; BD Biosciences). Cultures were maintained in a 14°C incubator in tcASW and used for experimentation within 1–3 d. Salts were obtained from Thermo Fisher Scientific, MP Biomedicals, or Sigma-Aldrich.
Excised, inside-out patch-clamp recording
Single cation channel current was measured using an EPC-8 amplifier (HEKA Electronics; Harvard Apparatus). Microelectrodes were pulled from 1.5 mm/1.12 mm external/internal diameter, borosilicate glass capillaries (TWF150F-4; World Precision Instruments) and fire polished to a resistance of 2–7 mΩ when filled normal artificial sea water (nASW; composition as per tcASW but lacking glucose and antibiotics) containing 20 mm tetraethylammonium (T2265, Sigma-Aldrich) in an attempt to reduce contaminating Ca2+-activating K+ currents. To lower the root mean squared noise of the current signal, microelectrode capacitance was reduced by coating the shank and half of the shoulder with dental wax (92189; Heraeus Kulzer) under a dissecting microscope before recording.
Following excision, the cytoplasmic face was bathed in standard artificial intracellular saline (composition in mm as follows: 500 K+-aspartate, 70 KCl, 1.25 MgCl2, 10 HEPES, 11 glucose, 10 glutathione, 5 EGTA, pH 7.3 with KOH). The added Ca2+ concentration was 3.32 mm, for a final free Ca2+ concentration in the intracellular saline of 1 μm, as calculated using WebMaxC (https://web.stanford.edu/∼cpatton/webmaxcS.htm). Current was low-pass filtered at 1 kHz with the EPC-8 Bessel filter and sampled at 10 kHz using a Digidata 1322A analog-to-digital converter (Molecular Devices), the Clampex acquisition program of pClamp version 10.0 (Molecular Devices), and an IBM-compatible personal computer. Recordings were made in 3 min bins, typically at −60 mV, although in experiments examining channel voltage dependence, the patch was also held at −90, −75, −45, −30, −15, 0, 15, and 30 mV. As found in prior work (Geiger et al., 2009), obtaining lengthy (≥3 min) and stable patches, which allowed us to distinguish channel openings from noise, was prohibitive at voltages more positive than 30 mV.
Imaging of intracellular Ca2+
For Ca2+ imaging, 1 mm fura-PE3 K+-salt (0110; TEFLabs) was dissolved in the K+-aspartate-based intracellular saline (for details, see Excised, inside-out patch-clamp recording), but with the free Ca2+ set to 300 nm rather than 1 μm, and introduced into cultured bag cell neurons via the whole-cell pipette under voltage clamp at −60 mV. Imaging was performed using a TS100-F inverted microscope (Nikon) and a Plan Fluor 20× [numerical aperture = 0.5] objective (Nikon). The light source was a 75 W Xe arc lamp and a multiwavelength DeltaRAM V monochromatic illuminator (Photon Technology International). Excitation wavelengths were 340 and 380 nm, and were computer-controlled via EasyRatio Pro software version 1.10 (Photon Technology International). Emitted light passed through a 400-nm-long pass dichroic mirror and a 510/40 nm emission barrier filter before being detected by a Cool SNAP HQ2 charge coupled device camera (Photometrics). The ratio of the emission following 340 and 380 nm excitation (340/380) was taken to reflect free intracellular Ca2+ (Grynkiewicz et al., 1985) and saved for subsequent analysis. Image acquisition, emitted light sampling, and ratio calculations were performed using EasyRatio Pro. Ca2+ measurements were acquired from a somatic ROI at approximately the midpoint of the vertical focal plane and one-half to three-fourths of the cell diameter. Camera gain was maximized, pixel binning was set at 8, and the exposure time at each wavelength was fixed to 500 ms, for a total acquisition time of ∼1.1 s.
Drug application and reagents
Initially, the bath (culture dish) tcASW was exchanged using a calibrated transfer pipette with intracellular saline for excised, inside-out recordings. In some experiments, the drug(s) was added to the bath 20 min before seal formation. For all other cases, reagents were added after patch excision, and drugs were pipetted directly into the dish during recording, with care being taken to make the addition near the patch without being too close to cause seal failure. Drugs were often introduced by initially removing a small volume (∼30 μl) of saline from the bath, combining that with an even smaller volume (<10 μl) of drug stock solution and then reintroducing the mixture back into the bath.
All drugs were made up as stock solutions and frozen at −20°C, then diluted down to a working concentration daily as needed. Cyclopiazonic acid (CPA; C1530, Sigma-Aldrich), 1-[6-[[(17β)-3-methoxyestra-1,3,5(10)-trien-17-yl]amino]hexyl]-1H-pyrrole-2,5-dione (U-73122; 112648-68-7; Cayman Chemical), N-(3-trifluoromethyl-phenyl)-2,4,6-trimethylbenzenesulfonamide (m-3M3FBS; T5699; Sigma-Aldrich), N-(2-trifluoromethyl-phenyl)-2,4,6-trimethylbenzenesulfonamide (o-3M3FBS; 1942; Tocris Bioscience), 1-oleoyl-2-acetyl-sn-glycerol (OAG; O6754; Sigma-Aldrich), and phorbol 12-myristate 13-acetate (PMA; P8139; Sigma-Aldrich) were dissolved in DMSO (67-68-5; Fisher Scientific) as stocks of 10 mm, 4 mm, 25 mm, 25 mm, 25 mm, and 100 μm, respectively. The maximal final concentration of DMSO ranged from 0.05 to 0.4% (v/v), which in control experiments both here and in previous work from our laboratory had no effect on holding current, membrane potential, intracellular Ca2+, ligand-gated currents, or single-channel currents (Magoski and Kaczmarek, 2005; Hickey et al., 2010; Groten et al., 2016; White et al., 2018). Adenosine 5′-triphosphate 2Na·H2O (ATP; A3377; Sigma-Aldrich), D-myo-inositol 1,4,5-trisphopshate 3Na (IP3; I9766; Sigma-Aldrich), and heparin (H3393; Sigma-Aldrich) were dissolved in H2O as stocks of 100, 5, and 2 mm, respectively.
Analysis
The Clampfit analysis program of pCLAMP was used to determine the amplitude of single-channel events and, as a measure of activity, open probability (PO). Some of the data, particularly those records gathered at 0, 15, and 30 mV, were filtered a second time using the Clampfit digital Gaussian filter to 250 or 500 Hz, depending on recording quality. Clampfit was used to determine the mean open- and closed-state current level by generating all-points histograms from the 3 min recordings, and fitting Gaussian functions, using the least-squares method and a simplex search, to the resulting histograms in Clampfit. Channel current amplitude was calculated by subtracting the mean closed-current level from the mean open-current level at a given voltage. Channel current versus voltage (I/V) relationships were produced in Prism version 5.04 (GraphPad Software) by plotting channel-current amplitude against patch-holding potential, and single-channel conductance was then determined by linear regression in Prism. Single-channel events lists were made from the data using the half-amplitude threshold criterion (Colquhoun and Sigworth, 1995) and the threshold event detection tool in Clampfit. The event detection statistics were used to determine PO using the following formula:
where t = amount of time that n channels are open, n = the number of channels in the patch, and ttot = the time interval over which PO was measured. The number of channels in the patch was determined by counting the number of unitary conductance levels, particularly at depolarized potentials (>−30 mV). Our best estimates indicate that the number of cation channels typically found in a patch was ∼1.5, with a range from just 1 to as high as 6. In addition, ∼70% of patches did not contain any detectable cation channel(s).
Voltage-response curves were constructed by dividing the PO at each voltage by the PO at 30 mV. The normalized data were then averaged across separate patches and plotted versus voltage using Prism. PO versus voltage plots were fit in Prism with a Boltzmann sigmoid curve to derive the half-maximal voltage V50 and the slope factor (k), which is the change in voltage required to move PO e-fold. For patches containing one channel, dwell-time histograms were created using the events list in Clampfit. The logarithmic distribution of the event dwell times was fitted in Clampfit with probability density functions using the minimum likelihood estimation method and a simplex search to determine two open- and three closed-state time constants.
Prism was used to import and plot ImageMaster Pro files as line graphs. Analysis of intracellular Ca2+ compared the steady-state value of the baseline 340/380 ratio with the peak or new steady-state ratio following the addition of a reagent. Measurements of baseline, steady-state, or peak were taken by eye using cursor measurements in Prism.
Data are mean ± SEM. Statistical analysis was performed using InStat version 3.10 (GraphPad Software). The Kolmogorov–Smirnov method was used to test datasets for normality. If the data were normal, Student's unpaired t test was used to test for differences between two means. If the data were not normally distributed, the Mann–Whitney unpaired U test was used. Three means were compared with a Kruskal–Wallis ordinary, nonparametric one-way ANOVA (KW-ANOVA) followed by Dunn's multiple-comparisons test. A one-sample t test was used to test whether a single mean was different from a theoretical mean of zero. Means were considered significant if the two-tailed p value was <0.05.
Results
Bag cell neuron cation channel voltage dependence
The Aplysia voltage-gated bag cell neuron cation channel is identified in excised, inside-out patches by unitary current events of ∼2 pA at a resting potential-like voltage of −60 mV, displays greater opening more at positive potentials, and lacks voltage-dependent inactivation (Wilson and Kaczmarek, 1993; Wilson et al., 1996, 1998; Magoski et al., 2002; Magoski, 2004; Magoski and Kaczmarek, 2005; Lupinsky and Magoski, 2006; Gardam and Magoski, 2009; Geiger et al., 2009). To demonstrate voltage dependence in the present study, excised patches were initially held at −60 mV; then the holding potential was changed to −90 mV for a 3 min period and subsequently increased in 15 mV increments for additional 3 min recordings up to a maximum of 30 mV (n = 11). At depolarized potentials, the channel was more active than at hyperpolarized potentials (Fig. 1A). Beyond 30 mV, lengthy recordings proved difficult, as patches were not always stable (for details, see Excised, inside-out patch-clamp recording). Thus, the PO at 30 mV was taken as maximal, and voltage dependence curves were obtained by normalizing the activity at all voltages to that at 30 mV, then plotting normalized PO versus holding potential (Fig. 1B). This relationship was fit with a Boltzmann sigmoidal function to yield a half-maximal activity (V50) at 38 mV and k of 23.
Figure 1.

A voltage-dependent cation channel from cultured Aplysia bag cell neurons. A, Cation channel activity in an excised, inside-out patch, voltage-clamped at indicated membrane potentials (left) with Na+-based nASW plus 20 mm tetraethylammonium at the extracellular face and a K+-aspartate-based intracellular saline with 1 μm Ca2+ at the cytoplasmic face. The closed state is at the top of each trace, indicated by −C, and the open-state, designated by −O, is at the bottom (at right of −60 trace). Openings are seen as unitary inward (negative) current deflections. As the patch is depolarized from −90 (bottom trace) to 30 mV (top trace), the channel opens more often, and more time is spent in the open state and less time in the closed state. Scale bars apply to all traces. B, Voltage dependence of cation channel PO expressed by normalizing activity within each experiment to the PO at 30 mV. A half-maximal voltage of activation (V50) of 38 mV and a k of 23 are determined from a Boltzmann sigmoidal curve fit to the data. The n value refers to the number of patches. Inset, Phase-contrast micrograph of a bag cell neuron in vitro (top). The pipette is coated with dental wax to reduce noise. After seal formation, the pipette is excised from the soma and current is recorded across the patch at the tip. Schematic of a cation channel in a membrane patch (bottom). C, All-points histograms of recordings in A represent current flow during channel closed (C) and open (O1 or O2) states at different voltages. Gaussian fits to these peaks are used to determine channel amplitude plotted in D. D, Single-channel I/V relationship shows subtle rectification at potentials >0 mV. A conductance (g) of 24 pS is derived from a linear fit of −90 to −15 mV; this represents the physiological range of the channel and avoids the region of rectification. E, The cation channel is part of a regulatory complex that includes PKC and calmodulin (CaM). The voltage-sensing domains open the channel in response to depolarization (ΔVm), whereas PKC-dependent phosphorylation and CaM binding intracellular Ca2+ activate the channel, allowing Na+ and Ca2+ to enter the cell and K+ to leave during the afterdischarge.
For single-channel event analyses and all-points histograms, recordings were taken at 30, 0, −30, and −60 mV (n = 13). From the all-points histograms, channel amplitude was obtained by taking the difference in the peaks of Gaussian functions fit to the closed- and open-current levels (Fig. 1C). In the representative patch from Figure 1C, the presence of a second peak at depolarized potentials suggests a second-level unitary conductance (O1 and O2), which often occurred in multichannel patches as channel PO increased. When the amplitudes from different voltages were plotted as an I/V relationship, a linear regression provided a conductance of ∼24 pS, which is comparable with that previously reported by our laboratory and others (Fig. 1D) (Wilson et al., 1996; Gardam and Magoski, 2009). The cation channel is known to rectify at membrane potentials more positive than 0 mV (Wilson et al., 1996; Gardam and Magoski, 2009; Geiger et al., 2009); thus, the linear regression was restricted to between −90 and −15 mV. In prior work, we found that the single-channel current reversed at ∼50 mV, although this was not determined by linear regression, but rather actual measurement of current at voltages on either side of the reversal potential (Geiger et al., 2009).
Ion channel kinetic states can be described by the dwell times (i.e., the length of time a channel spends in a particular open or closed state) (Colquhoun and Sigworth, 1995). The dwell-time kinetics of the cation channel voltage dependence was examined in patches containing a true single channel. The closed- and open-state histograms were fit with a best-fit probability density function composed of three closed-state time constants (τC1, τC2, and τC3) and two open-state time constants (τO1 and τO2), respectively (Fig. 2A). Depolarizing the patches resulted in a shortening of the longest closed-state time constant, τC3, whereas the longest open-state time constant, τO2, became longer (Fig. 2B). Thus, channel PO increased with depolarization because the cation channel favored opening and spent less time in the closed state.
Figure 2.
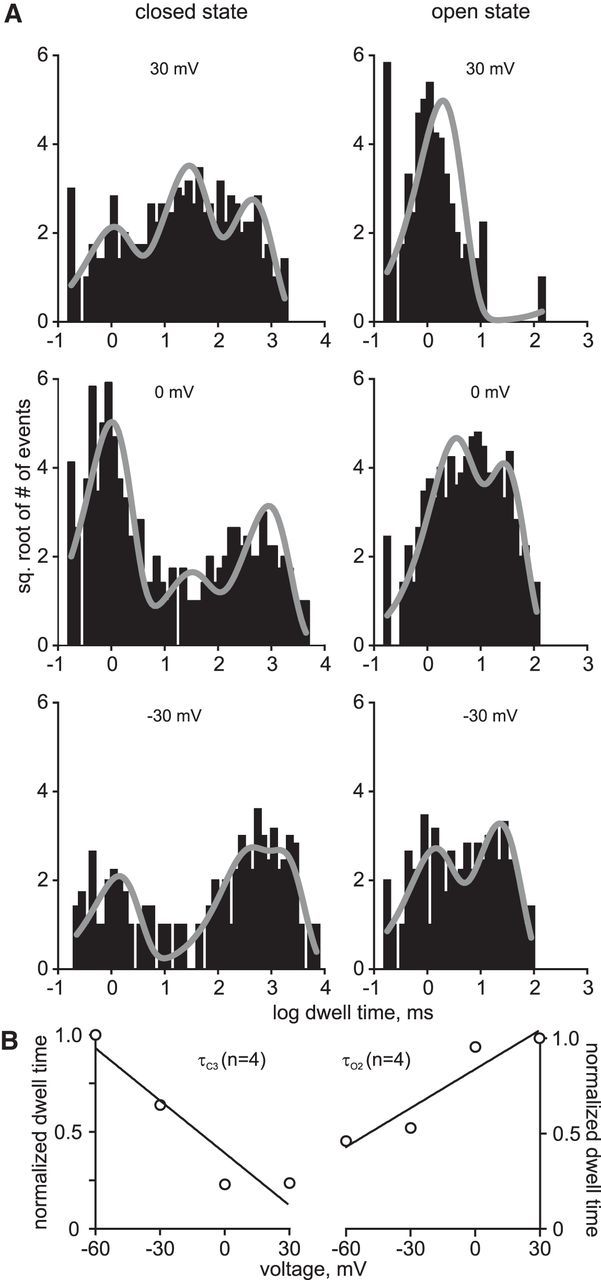
Kinetic analysis of true single channels shows that the cation channel stays open longer and favors reopening with depolarization. A, Closed-state (left column) and open-state (right column) dwell times at 30, 0, and −30 mV from a one-channel-only single-channel recording are plotted as histograms. Each histogram is best fit with a probability density function (three closed-state time constants: τC1, τC2, and τC3; two open-state time constants: τO1 and τO2). The longest closed-state time constant decreases with depolarization (−30: 8.83 ± 6.7 s vs 30: 3.3 ± 2.5 s), whereas the longer open-state time constant subtly increases in duration (−30: 23.7 ± 4.6 ms vs 30: 44.6 ± 18.8 ms). B, The duration of the longest closed-state time constant, τC3, decreases linearly with depolarization (left). Data for τC3 are normalized to −60 mV, at which τC3 is the longest. Similarly, the length of τO2 increases linearly with depolarization. Data are normalized to 30 mV, at which τO2 is the longest.
PLC-mediated PIP2 breakdown products modulate cation channel activity
The presence of phosphatidylinositols in Aplysia neuronal membranes was established based on lipid profile studies (Piomelli et al., 1987) and the liberation of arachidonic acid from PIP2 by PLC (Carlson and Levitan, 1990), as well as previous whole-cell experiments, suggesting that PLC activity can influence a voltage-independent bag cell neuron cation current (Sturgeon and Magoski, 2016). Given that PLC is activated during the afterdischarge and results in the formation of IP3 and DAG (Fink et al., 1988), we investigated the effect of these metabolites on the voltage-dependent cation channel. The impact of IP3 on the cation channel was first addressed by Gardam and Magoski (2009), who found that, although IP3 did not alter PO at −60 mV, it did change Ca2+ dependence. Aside from this, the effect of DAG, or any interaction between DAG and IP3, has not been addressed. In the present study, we bath-applied 25 μm OAG, a membrane-permeable DAG analog, to the cytoplasmic face of excised patches held at −60 mV and observed the PO (n = 10). Upon addition of OAG, the activity of the cation channel increased moderately (∼2-fold) over the first 3 min period, but during the following 6–9 min, the PO returned to the same level as the initial recording (Fig. 3A, left).
Figure 3.

A diacylglycerol analog transiently activates the cation channel, and this is prolonged by IP3. A, Application of 25 μm OAG, a diacylglycerol analog, to the cytoplasmic face of a cation channel-containing patch held at −60 mV increases activity for the 3 min following addition (middle) compared with the initial recording (top). Nine minutes after the addition, the PO has returned to the initial level (bottom). Scale bars apply to all traces in A, B, and D. B, Excising patches into intracellular saline containing 5 μm IP3, and then delivering OAG, increases the extent and duration of the OAG-induced elevation of cation channel activity. Before OAG addition, channel activity is minimal (top). Application of OAG to patches in the presence of IP3 increases PO (middle), and this effect is prolonged (bottom). C, Summary data show that the PO goes up following addition of OAG (gray bars), compared with delivery of DMSO (white). In patches excised into IP3 (black), the OAG-induced change in PO is almost twofold higher than untreated cells. The increased PO is significantly longer in IP3-treated patches than in untreated cells (6 min: p = 0.0082; 9 min: p = 0.0019; 12 min: p = 0.0171, KW-ANOVA). **p < 0.01 (Dunn's multiple-comparisons test). *p < 0.05 (Dunn's multiple-comparisons test). For this and all subsequent bar graphs, the numbers within the bars refer to the number of patches. In this instance, certain n values change starting at the 6 or 9 min bin due to some patches not lasting the full 12 min recording period. D, The synergy between OAG and IP3 is blocked by heparin. For an inside-out patch excised into 100 μm heparin, an IP3-receptor blocker, plus IP3, the subsequent application of OAG does not alter PO (bottom) compared with the initial activity (top). E, Summary data of the OAG-induced change in cation channel PO show that 10 μm (gray bars) or 100 μm heparin (black bars) prevents the activity increase induced by OAG in IP3 compared with IP3 alone (white) (p = 0.0010, KW-ANOVA). *p < 0.05 (Dunn's multiple-comparisons test). **p < 0.01 (Dunn's multiple-comparisons test). F, Left, Intracellular Ca2+ measured from the soma of a cultured bag cell neuron in nASW under whole-cell voltage-clamp at −60 mV using K+-aspartate-based intracellular saline supplemented with 1 mm fura. Bath application of 5 μm IP3 has no real impact on Ca2+, yet introducing 20 μm CPA later on causes a clear Ca2+ elevation reflective of store depletion. Right, The average response to IP3 is not significantly different from a theoretical mean of zero (p > 0.05; one-sample t test), whereas the difference between the mean Ca2+ change to CPA versus IP3 readily meets significance (*p < 0.0001; unpaired Student's t test).
Because there is a synergistic effect of OAG and IP3 on whole-cell voltage-independent cationic currents of bag cell neurons (Sturgeon and Magoski, 2016), we examined whether there was any difference in the OAG-induced PO change in voltage-dependent cation channels exposed to IP3. After bath solution exchange from tcASW to intracellular saline, IP3 was put into the bath at a final concentration of 5 μm for 20 min before patch excision (n = 10). Because our prior work showed that adding IP3 directly to the cytoplasmic face had no effect on cation channel PO (Gardam and Magoski, 2009), we opted for introducing IP3 to the bath before excision and then effectively starting the experiment by excising patches into the IP3-containing saline. This reduced the amount of necessary recording time before the delivery of OAG. In the presence of IP3, the OAG-induced activity was ∼5-fold higher than the initial value and lasted longer compared with the channels not exposed to IP3 (n = 10) (Fig. 3A,B). Overall, the OAG-alone PO increase lasted between 3 and 6 min versus DMSO (the vehicle; n = 6) (Fig. 3C). However, the elevated activity brought about by OAG was still ∼2-fold higher after 12 min in the presence of IP3. The difference in OAG channel activation after 12 min was significantly higher and longer with IP3. Parenthetically, before OAG, channels excised from neurons into the IP3-containing saline presented a PO that was not significantly different from that of channels excised into control (no IP3) saline (control saline PO: 0.0019 ± 0.0004 vs IP3-containing saline PO: 0.0018 ± 0.0002, p > 0.05; unpaired Student's t test).
Our laboratory previously proposed an IP3 binding site on the cation channel (Gardam and Magoski, 2009). Using OAG and IP3 as coactivators, we investigated this possibility with heparin, a known IP3 receptor (IP3R) blocker (Worley et al., 1987; Ghosh et al., 1988). Heparin (10 or 100 μm), along with 5 μm IP3, was introduced to dishes of cultured bag cell neurons before patch excision. After excision, OAG was added to cation channel-containing patches. Compared with IP3 alone (n = 8), the activity of the channel was unaffected by OAG in channels exposed to IP3 + heparin (Fig. 3D), suggesting that heparin may block both IP3-cation channel interactions as well as the OAG-induced channel activation. Both 10 and 100 μm heparin significantly suppressed the response to OAG (n = 9 and n = 7) (Fig. 3E).
Our hypothesis is that IP3 acts on the cytoplasmic face of the patch after excision, and heparin is blocking access to the channel or some closely associated protein. Although it is unlikely that IP3, which is charged and polar, actually crosses the membrane before patch excision to exert some effect, we sought to ensure this was not the case by monitoring intracellular Ca2+. Intact cultured bag cell neurons in nASW were loaded via whole-cell voltage-clamp at −60 mV with the Ca2+-sensitive dye, fura (Grynkiewicz et al., 1985) (for details, see Imaging of intracellular Ca2+). Delivering 5 μm IP3 to the bath (i.e., the extracellular surface of the neurons) did not alter somatic Ca2+ levels over ≥10 min (n = 6) (Fig. 3F, left). Because IP3 releases Ca2+ from the endoplasmic reticulum, 20 μm of the membrane-permeable endoplasmic reticulum Ca2+-ATPase blocker, CPA (Seidler et al., 1989), was added after IP3 as a positive control to deplete the Ca2+ store. As per our prior findings (Kachoei et al., 2006; Geiger and Magoski, 2008; Hickey et al., 2010; Groten et al., 2013), CPA caused a prominent liberation of Ca2+ from the endoplasmic reticulum (Fig. 3F, left). Overall, Ca2+ was not significantly changed by IP3, although the difference between the CPA Ca2+ response and that of IP3 was significant (Fig. 3F, right). This is similar to Levy (1992), who found that pressure ejection of IP3 onto other identified Aplysia neurons failed to modify intracellular Ca2+.
OAG and IP3 left-shift cation channel voltage dependence
The impact of PIP2 metabolites on cation channel activity at −60 mV may be due to modulation of voltage dependence, as was previously the case for Ca2+ (Lupinsky and Magoski, 2006; Gardam and Magoski, 2009). To test this, bag cell neurons were bathed in either 25 μm OAG or OAG + 5 μm IP3 for 20 min; subsequently, channels were excised into these different salines and examined as per Figure 1 for voltage dependence. At −60 mV, compared with OAG alone (n = 6), channel activity was higher in patches with OAG + IP3 (n = 5) (Fig. 4A). This difference in activity with the inclusion of IP3 became more evident at depolarized potentials, with the voltage dependence curves further demonstrating the synergistic effect of OAG + IP3 (Fig. 4B). Compared with the voltage dependence of the channel in OAG alone, the curve from channels in OAG + IP3 was clearly left-shifted. The difference in channel activity was most noticeable between −45 and −15 mV, which is the physiologically relevant membrane potential to the afterdischarge. Our previous findings indicated that OAG, unlike other recognized PKC activators, does not enhance voltage-gated Ca2+ currents in bag cell neurons (Sturgeon and Magoski, 2016). Still, we sought to affirm that the effect of OAG observed here was due to interaction with the cation channel, as opposed to some PKC-induced change. Therefore, we also treated cells with 100 nm PMA (n = 7), a phorbol ester well established as a trigger of bag cell neuron PKC (DeRiemer et al., 1985a), before patch excision and examination of voltage dependence. With PMA, the voltage dependence curve was distinctly right-shifted compared with OAG or OAG + IP3 and similar to that of naive channels (compare with Fig. 1D). At most voltages, the shift with OAG + IP3 was statistically significant compared with PMA or OAG alone.
Figure 4.

The voltage dependence of the cation channel is left-shifted by OAG and IP3. A, Cation channel activity in excised, inside-out patches exposed to 25 μm OAG alone (top traces at each voltage) or excised into 5 μm IP3 followed by OAG (bottom traces) and held at the potentials indicated on the left. Compared with OAG alone, the PO of the channel is higher in the presence of OAG + IP3, particularly at −60 and −15 mV. Ordinate at bottom right applies to −60 mV, whereas that beside the −15 mV trace applies to −15 and 15 mV; abscissa applies to all traces. B, Voltage dependence of cation channel PO in OAG (half-filled circles), OAG and IP3 (filled circles), or PMA (open circles). A Boltzmann curve fit to the PO activity normalized to 30 mV in OAG + IP3 (thick black) is left-shifted (V50 = −12 mV, k = 23) compared with OAG (dotted gray) (V50 = −3 mV, k = 13) and PMA (thin black) curves. The PMA curve is similar to naive channels (compare with Fig. 1D) and is shown here as a control. OAG with IP3 results in a larger left-shift in the voltage dependence than OAG alone (−90 mV: p > 0.05, KW-ANOVA; −75 mV: p > 0.05, KW-ANOVA; −60 mV: **p = 0.0046, KW-ANOVA with p < 0.05 for PMA vs OAG + IP3 and OAG vs OAG + IP3; −45 mV: **p = 0.0087, KW-ANOVA with p < 0.05 PMA vs OAG + IP3 and OAG vs OAG + IP3; −30 mV: *p = 0.0154, KW-ANOVA with p < 0.05 PMA vs OAG + IP3 and OAG vs OAG + IP3; −15 mV: **p = 0.0046, KW-ANOVA with p < 0.05 PMA vs OAG + IP3 and OAG vs OAG + IP3; 0 mV: p > 0.05, KW-ANOVA; 15 mV: **p = 0.0048, KW-ANOVA with p < 0.05 PMA vs OAG + IP3; all post hoc tests Dunn's multiple-comparisons).
PLC associates with the cation channel in excised patches
Much prior work suggests that the Aplysia cation channel is closely associated with multiple regulatory proteins, including PKC (Magoski, 2004; Magoski and Kaczmarek, 2005; Lupinsky and Magoski, 2006). A previous report on the nicotinic acetylcholine receptor indicates the close association between that channel and a PLC activity (Labriola et al., 2010). We therefore sought to ascertain whether there was an association between PLC and the Aplysia cation channel.
From naive bag cell neurons, we excised inside-out patches containing the cation channel and applied either 25 μm m-3M3FBS, a PLC activator (Bae et al., 2003), or o-3M3FBS, an inactive control molecule, to the cytoplasmic face at −60 mV. For channels given the inactive o-3M3FBS, the PO was unchanged (n = 9) (Fig. 5A,D). However, the response to the active m-3M3FBS was a time-dependent increase in PO (n = 7). The effect was most obvious by 9 min after addition, where the PO was substantially higher (Fig. 5B). On average, compared with the initial recording, delivery of the PLC activator increased PO starting at 6 min, and there was a significant ∼10-fold change by 9 min (Fig. 5D). These patches were pulled from neurons before addition of the PLC activator; therefore, the PLC activity remained associated with the channel in the patches, suggesting a close proximity of PLC to the cation channel.
Figure 5.

A PLC activator increases cation channel activity in excised, inside-out patches. A, Addition of 25 μm o-3M3FBS (bottom), an inactive control molecule, to the cytoplasmic face of a patch held at −60 mV, results in no change in PO from the initial level (top). B, In a separate patch from a different neuron, applying 25 μm m-3M3FBS, a PLC activator, increases channel activity (bottom trace) compared with the initial period (top). C, In a patch excised from a neuron treated with 5 μm of the PLC inhibitor, U-73122, delivery of m-3M3FBS has no effect on PO. Scale bars apply to all traces in A–C. D, Summary data show that application of m-3M3FBS to excised patches increases channel activity over the course of ∼6 min and reaches a peak by ∼9 min (gray bars), and this effect can be blocked by U-73122 treatment before patch excision (black). Adding the inactive form, o-3M3FBS, has no effect on channel activity (white) (p = 0.0083, KW-ANOVA). *p < 0.05 (Dunn's multiple-comparisons test).
To confirm that PLC was indeed present in the patch, cells were treated for 20 min with 5 μm U-73122 (n = 8), a PLC inhibitor that works well in Aplysia (Bleasdale et al., 1990; Fulton et al., 2008; Tam et al., 2011). The activity of PLC does not appear to affect the basal level of cation channel activity at −60 mV, as patches pulled from neurons exposed to U-73122 showed a similar initial activity to those pulled from untreated neurons (compare with Fig. 1A). Following excision, in the presence of the PLC inhibitor, the addition of 25 μm m-3M3FBS had no effect on the activity of the cation channel (Fig. 5C,D).
PLC-mediated PIP2 breakdown left-shifts cation channel voltage dependence
Similar to OAG and IP3, we sought to examine whether the m-3M3FBS/PLC-induced elevation of cation channel activity was the result of changes to voltage dependence. Patches were excised from bag cell neurons treated for 20 min with either m-3M3FBS (n = 7) or its inactive counterpart, o-3M3FBS (n = 7), and single-channel currents were measured at different holding potentials (Fig. 6A). The activity of the cation channel −60 mV, at rest, was higher with m-3M3FBS (bottom) than o-3M3FBS; and at depolarized potentials, this difference was even more noticeable. The openings were more frequent and longer in duration in the presence of the PLC activator at both −15 and 15 mV (Fig. 6A).
Figure 6.

PLC activation left-shifts the voltage dependence of the cation channel. A, Cation channel activity increases as holding potentials are depolarized from −60 (bottom) to 15 mV (top) when excised from cells treated with 25 μm of either the active (m-3M3FBS) or inactive (o-3M3FBS) form the PLC activator. However, at both −60 and −15 mV (middle), channel PO is higher with the active m-3M3FBS. Ordinate at bottom right applies to −60 mV, whereas that beside the −15 mV trace applies to −15 and 15 mV; abscissa applies to all traces. B, Exposure to 25 μm m-3M3FBS (filled circles) results in a left-shifted voltage dependence compared with the inactive o-3M3FBS (open circles). A Boltzmann curve fit to the PO activity normalized to 30 mV in m-3M3FBS (thick black) is left-shifted (V50 = −24 mV, k = 17) compared with the o-3M3FBS (thin black) curve (V50 = 26 mV, k = 18) (−90: p > 0.05; −75 mV: **p = 0.0095; −60 mV: **p = 0.0087; −45 mV: *p = 0.0260; −30 mV: **p = 0.0012; −15 mV: *p = 0.0350; 0 mV: **p = 0.007; 15 mV: p > 0.05; all Mann–Whitney unpaired U test).
The voltage dependence curves of the cation channel in m-3M3FBS demonstrated a clear and statistically significant left-shift compared with o-3M3FBS (Fig. 6B). Even at −60 mV, the activity of the channel with m-3M3FBS was greater than that of o-3M3FBS. More importantly, at the depolarized potentials likely experienced during the afterdischarge (−45 to −30 mV), the PO of the channel was evidently higher in m-3M3FBS. The magnitude of the left-shift of the voltage dependence curve was close to that seen in the combined presence of OAG and IP3 (compare with Fig. 4B), suggesting that, by releasing both IP3 and DAG, PLC may well potentiate the cation channel during the afterdischarge.
PIP2 breakdown products enhance the effect of PKC on the cation channel
Wilson et al. (1998) demonstrated that PKC associates with the Aplysia cation channel in excised patches, such that, when provided a phosphate source, like ATP, phosphorylation via PKC turns on the channel. This ATP-induced increase in PO can be prevented by using PKC inhibitors, such as H7 or PKC19–36, as well as disruption of the protein–protein interactions between the channel and the kinase (Wilson et al., 1998; Magoski et al., 2002; Magoski and Kaczmarek, 2005). In light of our evidence regarding the possible presence of PLC, we sought to elucidate any possible interaction between DAG, IP3, and PKC on cation channel activity. In control excised patches containing the cation channel, addition of 1 mm ATP (n = 9) increased PO by ∼2-fold (Fig. 7A). This is similar to what we have reported previously as a typical PKC-mediated effect (Magoski, 2004; Magoski and Kaczmarek, 2005; Gardam and Magoski, 2009). When endogenous PLC was activated by treating neurons with 25 μm m-3M3FBS for 20 min before patch excision (n = 6), the subsequent delivery of ATP to the cytoplasmic face resulted in an ∼15-fold increase in PO (Fig. 7B,E).
Figure 7.

PKC-induced cation channel activation is increased following addition of PLC breakdown products. A, Addition of 1 mm ATP to the cytoplasmic face of a cation channel held at −60 mV in an excised, inside-out patch increases PO ∼2-fold (bottom trace) compared with initial activity (top). Prior work shows that this is due to PKC-mediated phosphorylation (i.e., it is sensitive to PKC inhibition and reversed by protein phosphatases) (Wilson et al., 1998). B, Following treatment of an intact bag cell neuron with 25 μm m-3M3FBS, a cation channel-containing patch is excised (top). Delivery of ATP to this patch provokes a marked PO increase (bottom). C, Moreover, in a different patch, after exposure to 25 μm OAG (top trace), introducing ATP results in an even larger elevation in channel activity. Scale bars apply to all traces in A–D. D, When excised into 5 μm IP3 followed by 25 μm OAG (top), the response to ATP is a very substantial increase in PO (bottom). E, Summary data of excised patches show that, compared with pre-ATP, after addition of OAG, with or without IP3, ATP significantly increases channel activity in these patches. This PO change is far greater when both OAG and IP3 are present versus OAG alone (p < 0.0001, KW ANOVA). *p < 0.05 (Dunn's multiple-comparisons test). ***p < 0.001 (Dunn's multiple-comparisons test).
Exogenous lipid metabolites had a more dramatic effect on the PKC-induced modulation of the cation channel. Introduction of 25 μm OAG directly to patches activated the cation channel as per our prior finding (data not shown, but similar to that depicted in Fig. 3A,C); and upon the addition of ATP, the PO markedly increased (n = 7). The response of the channel was an almost 60-fold rise in PO after the ATP addition (Fig. 7E). Although the presence of OAG had a notable effect, the impact of a combination of 5 μm IP3 and 25 μm OAG (n = 7) was even more pronounced (Fig. 7D), so much so that, in the patches exposed to both IP3 and OAG, the subsequent addition of ATP elevated the channel PO by a remarkable ∼600-fold (Fig. 7E). The increased channel activity with OAG or OAG + IP3 was significant compared with control.
Discussion
The bag cell neuron afterdischarge is provoked by a brief cholinergic synaptic input and presents as a profound change in electrical and biochemical properties that lasts ∼30 min (Kupfermann and Kandel, 1970; White and Magoski, 2012). The temporally distinct nature of the intracellular signaling mechanisms during the afterdischarge underlies the ability of these neurons to respond to a short stimulus with a long-term change in activity and ultimately release reproductive hormone (Strumwasser, 1971; Pinsker and Dudek, 1977; Michel and Wayne, 2002). In particular, regulation of a cationic current during the afterdischarge enhances excitability of the cells and is key to properly timed alterations of membrane potential and action potential firing (Fig. 8).
Figure 8.
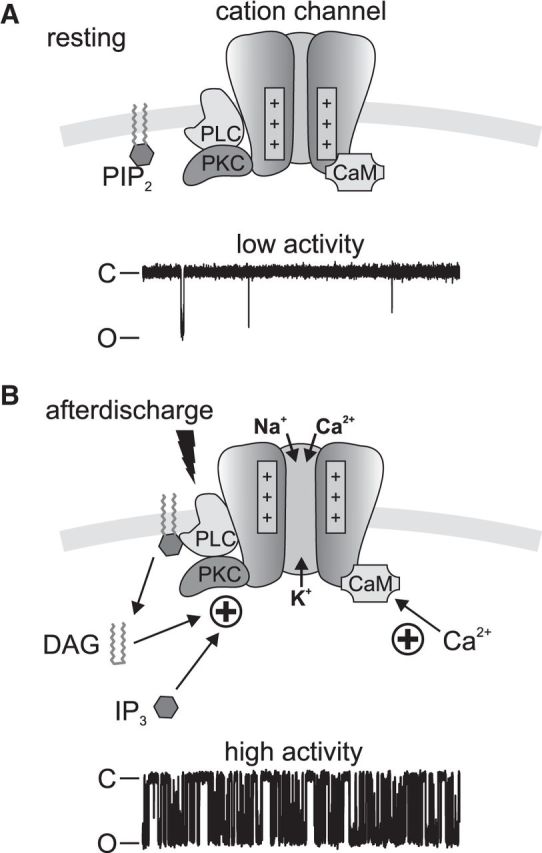
Schematic representation of the Aplysia cation channel regulatory complex in the bag cell neuron plasma membrane. A, The cation channel is found with closely associated PKC (Wilson et al., 1998), CaM (Lupinsky and Magoski, 2006), and PLC. At rest, the voltage sensors are located closer to the inner leaflet. PIP2 is located in the plasma membrane. A representative single-channel recording from the channel in an excised patch held at −60 mV indicates that the channel is predominantly in the closed (C) state, with few transitions to the open (O) state. B, In response to the afterdischarge, PLC is activated (lightning bolt) and PIP2 is hydrolyzed to DAG and IP3. The combined liberation of DAG and IP3, along with PKC-dependent phosphorylation and Ca2+/CaM, gates the channel in a positive manner. The bag cell neuron membrane also depolarizes, resulting in further channel activation and cation influx. Given these regulatory elements, channel activity increases dramatically, as evidenced by the representative single-channel recording.
The cation channel examined in the present study provides much of the depolarizing drive to extend the duration of the afterdischarge (Wilson et al., 1996), and this is due to several control elements (Fig. 1E). The channel is voltage-dependent; and given the depolarization associated with the afterdischarge, continuous activation likely occurs throughout the burst (Wilson et al., 1996; Gardam and Magoski, 2009). The channel is also activated by intracellular Ca2+ (Lupinsky and Magoski, 2006), and there is a constant influx of Ca2+ through voltage-gated Ca2+ channels over the course of the afterdischarge (Fisher et al., 1994; Groten et al., 2013). Moreover, there is a high likelihood that the cation channel experiences local Ca2+ concentrations higher than the 1 μm used here, due to proximity to sources of Ca2+ influx, including Ca2+ channels in the membrane and IP3-induced Ca2+ release from the endoplasmic reticulum (Fink et al., 1988; Groten and Magoski, 2015).
Along with voltage and Ca2+, phospholipid metabolites are potential regulators of cation channel function in bag cell neurons. PLC is turned on during the afterdischarge to break down PIP2 in the plasma membrane (Fink et al., 1988). Generally, PLC is activated by neurotransmitters via G-protein-coupled receptors (Clapham, 1995; Hille et al., 2015). Therefore, PLC activation could be due to acetylcholine binding a muscarinic receptor at the start of the afterdischarge (Dembrow et al., 2004; White and Magoski, 2012); alternatively, one of the bag cell peptides released by the bag cell neurons themselves could activate PLC through a G-protein-coupled pathway (Brown and Mayeri, 1989; Redman and Berry, 1993). Hence, PLC would become active early in the afterdischarge, liberating DAG and IP3, which combine to modulate the cation channel.
The transient activation of the Aplysia cation channel by the DAG analog, OAG, is similar to TRPC3 and TRPC6 channels expressed in HEK cells (Hofmann et al., 1999), although in Aplysia, the duration of the response is longer. The combination of OAG and IP3 can increase TRP-like whole-cell cationic currents in various types of myocytes (Albert and Large, 2003; Ju et al., 2010; Song et al., 2015). For bag cell neurons, OAG and IP3 synergize at the single-channel level to potentiate and prolong PO. The duration of the OAG + IP3 potentiation in our excised patches is again longer than that seen for TRPC channels in other tissues (Albert and Large, 2003; Song et al., 2015). Potentiation may involve IP3 binding to a site on the cytoplasmic face of the channel or an adjacent protein. Because heparin, which prevented the IP3-mediated modulation of the OAG response, is originally characterized as an IP3 receptor blocker (Worley et al., 1987; Ghosh et al., 1988), an actual IP3 receptor may be closely associated with the cation channel, as suggested for TRPC3 channels (Kiselyov et al., 1998; Kim et al., 2012). By extension, there is also the possibility that the endoplasmic reticulum itself is present in the patch as part of the complex.
The synergy between DAG and IP3 would likely be key in maintaining the cation current to drive action potentials during the afterdischarge. For cation channels exposed to OAG, the voltage dependence is left-shifted; moreover, inclusion of IP3 at the cytoplasmic face shifts the curve even further left. A similar outcome is seen by activating PLC using m-3M3FBS, with a left-shift that is even more prominent than with exogenous lipid metabolites. The activation of PLC would shift the voltage dependence into the range of depolarized membrane potentials seen during the afterdischarge.
We also present evidence of a close association between the cation channel and PLC activity. To our knowledge, this is the first instance of PLC activity closely associated with a nonselective cation channel in excised patches. After excising a patch from untreated bag cell neurons, delivery of the PLC activator, m-3M3FBS (Bae et al., 2003), increases channel PO, whereas the inactive version has no effect. This PLC activator has been used in bag cell neurons induced neurite outgrowth and to elicit whole-cell voltage-independent cationic currents similar to those evoked by a combination of OAG and IP3 (Zhang et al., 2012; Sturgeon and Magoski, 2016). Furthermore, m-3M3FBS has no effect on the channel in patches excised from neurons treated with the PLC inhibitor, U-73122 (Bleasdale et al., 1990), which has been proven effective at blocking PLC in Aplysia sensory and bag cell neurons (Fulton et al., 2008; Tam et al., 2011). This lessens the possibility of a direct effect of m-3M3FBS on the cation channel, independent of PLC. Overall, effects seen here are most likely due to PLC activation in the excised patch, resulting in the release of DAG and IP3 from membrane-bound PIP2, and augmenting activity. Consistent PLC activation in these excised patches indicates the likelihood that a channel-PLC interaction occurs in vivo.
In our experiments, the use of OAG has the potential to turn on PKC directly (Nishizuka, 1984); however, prior work by ourselves and others has shown that pharmacological activation of PKC, principally by the phorbol ester, PMA, strongly enhances voltage-gated Ca2+ currents in bag cell neurons (DeRiemer et al., 1985a,b; Strong et al., 1987; Tam et al., 2011; Groten and Magoski, 2015). Nevertheless, using this same bioassay, we previously failed to observe any change in Ca2+ current following OAG application (Sturgeon and Magoski, 2016). Furthermore, in the present study, triggering PKC before patch excision with PMA has no effect on cation channel voltage dependence. Thus, while a direct test of OAG on PKC activity itself is still lacking, the current evidence favors OAG (or OAG + IP3) interacting with the channel to left-shift the voltage dependence in a manner independent of PKC activation. That stated, lipid metabolites do alter the responsiveness of the cation channel to closely associated PKC. When provided a phosphate source, the associated PKC phosphorylates the channel, resulting in a multifold increase in PO (Wilson et al., 1998). The PKC-induced elevation of channel activity in the presence of OAG and IP3 is markedly larger compared with control. This substantial difference could be due to the exogenous concentrations we used; therefore, the enhancement following the addition of m-3M3FBS might be more comparable with that occurring in vivo. Overall, PLC may liberate sufficient amounts of DAG and IP3 to activate the channel and bolster the PKC response. Because our prior work showed that PMA does not boost the PKC response in any way like OAG or OAG + IP3 (Magoski and Kaczmarek, 2005), we would assert that the outcome reported in the present study is not due to an effect on PKC itself, but rather on the response of the channel to PKC.
The lipid environment is vital to the proper function of ion channels and transporters, and increasing evidence suggests that the surrounding microenvironment can modulate the activity of voltage-gated K+ channels, voltage-gated Ca2+ channels, the ABC transporter, TRP channels, and nicotinic receptors (Roberts-Crowley et al., 2009; Sturgeon and Baenziger, 2010; Kasimova et al., 2014; Ciardo and Ferrer-Montiel, 2017). The fact that PLC activity can be copurified with the nicotinic receptor in reconstituted membranes suggests that some ion channels not only require specific lipids but have the means to alter their lipid microenvironment to ensure the presence of cofactors for activity (Labriola et al., 2010). Considering the prior reports demonstrating the presence of regulatory proteins associated with the Aplysia cation channel (Magoski et al., 2002; Magoski, 2004; Magoski and Kaczmarek, 2005; Lupinsky and Magoski, 2006), it may be reasonable to conclude that PLC is part of such a modulatory complex.
There are parallels between the regulation of the macroscopic voltage-independent cation current we published previously (Sturgeon and Magoski, 2016) and the voltage-dependent cation current examined at the single-channel level here. In particular, both currents are triggered by OAG or the stimulation of endogenous PLC with m-3M3FBS, and both are potentiated by IP3. Conversely, although PKC can activate the voltage-dependent current in excised patches, this kinase does not directly gate the whole-cell voltage-independent current; rather, basal PKC activity is only required for OAG-induced activation (Wilson et al., 1998; Sturgeon and Magoski, 2016). As part of a channel-regulatory system, PLC influences cation current function via alteration of the surrounding lipid environment, phosphorylation, and, for one of the currents, voltage sensing. Thus, by converging on two different cation channels, the PLC pathway serves to maintain the afterdischarge and hormone secretion.
Footnotes
This work was supported by a Canadian Institutes of Health Research operating grant to N.S.M. We thank Catherine A. London and Heather M. Hodgson for technical assistance.
The authors declare no competing financial interests.
References
- Albert AP, Large WA (2003) Synergism between inositol phosphates and diacylglycerol on native TRPC6-like channels in rabbit portal vein myocytes. J Physiol 552:789–795. 10.1113/jphysiol.2003.052977 [DOI] [PMC free article] [PubMed] [Google Scholar]
- Allen JA, Halverson-Tamboli RA, Rasenick MM (2007) Lipid raft microdomains and neurotransmitter signalling. Nat Rev Neurosci 8:128–140. 10.1038/nrn2059 [DOI] [PubMed] [Google Scholar]
- Bae YS, Lee TG, Park JC, Hur JH, Kim Y, Heo K, Kwak JY, Suh PG, Ryu SH (2003) Identification of a compound that directly stimulates phospholipase C activity. Mol Pharmacol 63:1043–1050. 10.1124/mol.63.5.1043 [DOI] [PubMed] [Google Scholar]
- Berridge MJ. (2009) Inositol trisphosphate and calcium signalling mechanisms. Biochim Biophys Acta 1793:933–940. 10.1016/j.bbamcr.2008.10.005 [DOI] [PubMed] [Google Scholar]
- Bleasdale JE, Thakur NR, Gremban RS, Bundy GL, Fitzpatrick FA, Smith RJ, Bunting S (1990) Selective inhibition of receptor-coupled phospholipase C-dependent processes in human platelets and polymorphonuclear neutrophils. J Pharmacol Exp Ther 255:756–768. [PubMed] [Google Scholar]
- Brown RO, Mayeri E (1989) Positive feedback by autoexcitatory neuropeptides in neuroendocrine bag cells of Aplysia. J Neurosci 9:1443–1451. 10.1523/JNEUROSCI.09-04-01443.1989 [DOI] [PMC free article] [PubMed] [Google Scholar]
- Carlson RO, Levitan IB (1990) Regulation of intracellular free arachidonic acid in aplysia nervous system. J Membr Biol 116:249–260. 10.1007/BF01868464 [DOI] [PubMed] [Google Scholar]
- Ciardo MG, Ferrer-Montiel A (2017) Lipids as central modulators of sensory TRP channels. Biochim Biophys Acta 1859:1615–1628. 10.1016/j.bbamem.2017.04.012 [DOI] [PubMed] [Google Scholar]
- Clapham DE. (1995) Calcium signaling. Cell 80:259–268. 10.1016/0092-8674(95)90408-5 [DOI] [PubMed] [Google Scholar]
- Clapham DE. (2003) TRP channels as cellular sensors. Nature 426:517–524. 10.1038/nature02196 [DOI] [PubMed] [Google Scholar]
- Colquhoun D, Sigworth FJ (1995) Fitting and statistical analysis of single-channel records. In: Single-channel recording (Sakmann BN, ed), pp 483–587. New York, NY: Springer. [Google Scholar]
- Conn PJ, Kaczmarek LK (1989) The bag cell neurons of Aplysia. Mol Neurobiol 3:237–273. 10.1007/BF02740607 [DOI] [PubMed] [Google Scholar]
- Decrock E, De Bock M, Wang N, Gadicherla AK, Bol M, Delvaeye T, Vandenabeele P, Vinken M, Bultynck G, Krysko DV, Leybaert L (2013) IP3, a small molecule with a powerful message. Biochim Biophys Acta 1833:1772–1786. 10.1016/j.bbamcr.2012.12.016 [DOI] [PubMed] [Google Scholar]
- Dembrow NC, Jing J, Brezina V, Weiss KR (2004) A specific synaptic pathway activates a conditional plateau potential underlying protraction phase in the Aplysia feeding central pattern generator. J Neurosci 24:5230–5238. 10.1523/JNEUROSCI.5649-03.2004 [DOI] [PMC free article] [PubMed] [Google Scholar]
- DeRiemer SA, Greengard P, Kaczmarek LK (1985a) Calcium/phosphatidylserine/diacylglycerol-dependent protein phosphorylation in the Aplysia nervous system. J Neurosci 5:2672–2676. 10.1523/JNEUROSCI.05-10-02672.1985 [DOI] [PMC free article] [PubMed] [Google Scholar]
- DeRiemer SA, Strong JA, Albert KA, Greengard P, Kaczmarek LK (1985b) Enhancement of calcium current in Aplysia neurones by phorbol ester and protein kinase C. Nature 313:313–316. 10.1038/313313a0 [DOI] [PubMed] [Google Scholar]
- Fink LA, Connor JA, Kaczmarek LK (1988) Inositol trisphosphate releases intracellularly stored calcium and modulates ion channels in molluscan neurons. J Neurosci 8:2544–2555. 10.1523/JNEUROSCI.08-07-02544.1988 [DOI] [PMC free article] [PubMed] [Google Scholar]
- Fisher TE, Levy S, Kaczmarek LK (1994) Transient changes in intracellular calcium associated with a prolonged increase in excitability in neurons of Aplysia californica. J Neurophysiol 71:1254–1257. 10.1152/jn.1994.71.3.1254 [DOI] [PubMed] [Google Scholar]
- Fulton D, Condro MC, Pearce K, Glanzman DL (2008) The potential role of postsynaptic phospholipase C activity in synaptic facilitation and behavioral sensitization in Aplysia. J Neurophysiol 100:108–116. 10.1152/jn.90389.2008 [DOI] [PMC free article] [PubMed] [Google Scholar]
- Gamper N, Shapiro MS (2007) Regulation of ion transport proteins by membrane phosphoinositides. Nat Rev Neurosci 8:921–934. 10.1038/nrn2257 [DOI] [PubMed] [Google Scholar]
- Gao Y, Cao E, Julius D, Cheng Y (2016) TRPV1 structures in nanodiscs reveal mechanisms of ligand and lipid action. Nature 534:347–351. 10.1038/nature17964 [DOI] [PMC free article] [PubMed] [Google Scholar]
- Gardam KE, Magoski NS (2009) Regulation of cation channel voltage and Ca2+ dependence by multiple modulators. J Neurophysiol 102:259–271. 10.1152/jn.00065.2009 [DOI] [PubMed] [Google Scholar]
- Geiger JE, Magoski NS (2008) Ca2+-induced Ca2+ release in Aplysia bag cell neurons requires interaction between mitochondrial and endoplasmic reticulum stores. J Neurophysiol 100:24–37. 10.1152/jn.90356.2008 [DOI] [PubMed] [Google Scholar]
- Geiger JE, Hickey CM, Magoski NS (2009) Ca2+ entry through a non-selective cation channel in Aplysia bag cell neurons. Neuroscience 162:1023–1038. 10.1016/j.neuroscience.2009.05.006 [DOI] [PubMed] [Google Scholar]
- Ghosh TK, Eis PS, Mullaney JM, Ebert CL, Gill DL (1988) Competitive, reversible, and potent antagonism of inositol 1,4,5-triphosphate-activated calcium release by heparin. J Biol Chem 263:11075–11079. [PubMed] [Google Scholar]
- Groten CJ, Magoski NS (2015) PKC enhances the capacity for secretion by rapidly recruiting covert voltage-gated Ca2+ channels to the membrane. J Neurosci 35:2747–2765. 10.1523/JNEUROSCI.3581-14.2015 [DOI] [PMC free article] [PubMed] [Google Scholar]
- Groten CJ, Rebane JT, Blohm G, Magoski NS (2013) Separate Ca2+ sources are buffered by distinct Ca2+ handling systems in Aplysia neuroendocrine cells. J Neurosci 33:6476–6491. 10.1523/JNEUROSCI.6384-11.2013 [DOI] [PMC free article] [PubMed] [Google Scholar]
- Groten CJ, Rebane JT, Hodgson HM, Chauhan AK, Blohm G, Magoski NS (2016) Ca2+ removal by the plasma membrane Ca2+-ATPase influences the contribution of mitochondria to activity-dependent Ca2+ dynamics in Aplysia neuroendocrine cells. J Neurophysiol 115:2615–2634. 10.1152/jn.00494.2015 [DOI] [PMC free article] [PubMed] [Google Scholar]
- Grynkiewicz G, Poenie M, Tsien RY (1985) A new generation of calcium indicators with greatly improved fluorescent properties. J Biol Chem 260:3440–3450. [PubMed] [Google Scholar]
- Guo J, She J, Zeng W, Chen Q, Bai XC, Jiang Y (2017) Structures of the calcium-activated, non-selective cation channel TRPM4. Nature 552:205–209. 10.1038/nature24997 [DOI] [PMC free article] [PubMed] [Google Scholar]
- Hansen SB. (2015) Lipid agonism: the PIP2 paradigm of ligand-gated ion channels. Biochim Biophys Acta 1851:620–628. 10.1016/j.bbalip.2015.01.011 [DOI] [PMC free article] [PubMed] [Google Scholar]
- Hardie RC. (2007) TRP channels and lipids: from Drosophila to mammalian physiology. J Physiol 578:9–24. 10.1113/jphysiol.2006.118372 [DOI] [PMC free article] [PubMed] [Google Scholar]
- Hickey CM, Geiger JE, Groten CJ, Magoski NS (2010) Mitochondrial Ca2+ activates a cation current in Aplysia bag cell neurons. J Neurophysiol 103:1543–1556. 10.1152/jn.01121.2009 [DOI] [PubMed] [Google Scholar]
- Hilgemann DW. (2007) Local PIP(2) signals: when, where, and how? Pflugers Arch 455:55–67. 10.1007/s00424-007-0280-9 [DOI] [PubMed] [Google Scholar]
- Hilgemann DW, Dai G, Collins A, Larricia V, Magi S, Deisl C, Fine M (2018) Lipid signaling to membrane proteins: from second messengers to membrane domains and adapter-free endocytosis. J Gen Physiol 150:211–224. 10.1085/jgp.201711875 [DOI] [PMC free article] [PubMed] [Google Scholar]
- Hille B, Dickson EJ, Kruse M, Vivas O, Suh BC (2015) Phosphoinositides regulate ion channels. Biochim Biophys Acta 1851:844–856. 10.1016/j.bbalip.2014.09.010 [DOI] [PMC free article] [PubMed] [Google Scholar]
- Hofmann T, Obukhov AG, Schaefer M, Harteneck C, Gudermann T, Schultz G (1999) Direct activation of human TRPC6 and TRPC3 channels by diacylglycerol. Nature 397:259–263. 10.1038/16711 [DOI] [PubMed] [Google Scholar]
- Ju M, Shi J, Saleh SN, Albert AP, Large WA (2010) Ins(1,4,5)P3 interacts with PIP2 to regulate activation of TRPC6/C7 channels by diacylglycerol in native vascular myocytes. J Physiol 588:1419–1433. 10.1113/jphysiol.2009.185256 [DOI] [PMC free article] [PubMed] [Google Scholar]
- Kachoei BA, Knox RJ, Uthuza D, Levy S, Kaczmarek LK, Magoski NS (2006) A store-operated Ca2+ influx pathway in the bag cell neurons of Aplysia. J Neurophysiol 96:2688–2698. 10.1152/jn.00118.2006 [DOI] [PMC free article] [PubMed] [Google Scholar]
- Kaczmarek LK, Jennings K, Strumwasser F (1978) Neurotransmitter modulation, phosphodiesterase inhibitor effects, and cyclic AMP correlates of afterdischarge in peptidergic neurites. Proc Natl Acad Sci U S A 75:5200–5204. 10.1073/pnas.75.10.5200 [DOI] [PMC free article] [PubMed] [Google Scholar]
- Kasimova MA, Tarek M, Shaytan AK, Shaitan KV, Delemotte L (2014) Voltage-gated ion channel modulation by lipids: insights from molecular dynamics simulations. Biochim Biophys Acta 1838:1322–1331. 10.1016/j.bbamem.2014.01.024 [DOI] [PubMed] [Google Scholar]
- Kim Y, Wong AC, Power JM, Tadros SF, Klugmann M, Moorhouse AJ, Bertrand PP, Housley GD (2012) Alternative splicing of the TRPC3 ion channel calmodulin/IP3 receptor-binding domain in the hindbrain enhances cation flux. J Neurosci 32:11414–11423. 10.1523/JNEUROSCI.6446-11.2012 [DOI] [PMC free article] [PubMed] [Google Scholar]
- Kiselyov K, Xu X, Mozhayeva G, Kuo T, Pessah I, Mignery G, Zhu X, Birnbaumer L, Muallem S (1998) Functional interaction between InsP3 receptors and store-operated Htrp3 channels. Nature 396:478–482. 10.1038/24890 [DOI] [PubMed] [Google Scholar]
- Kockskämper J, Zima AV, Roderick HL, Pieske B, Blatter LA, Bootman MD (2008) Emerging roles of inositol 1,4,5-trisphosphate signaling in cardiac myocytes. J Mol Cell Cardiol 45:128–147. 10.1016/j.yjmcc.2008.05.014 [DOI] [PMC free article] [PubMed] [Google Scholar]
- Kupfermann I, Kandel ER (1970) Electrophysiological properties and functional interconnections of two symmetrical neurosecretory clusters (bag cells) in abdominal ganglion of Aplysia. J Neurophysiol 33:865–876. 10.1152/jn.1970.33.6.865 [DOI] [PubMed] [Google Scholar]
- Labriola JM, daCosta CJ, Wang S, Figeys D, Smith JC, Sturgeon RM, Baenziger JE (2010) Phospholipase C activity affinity purifies with the Torpedo nicotinic acetylcholine receptor. J Biol Chem 285:10337–10343. 10.1074/jbc.M109.071993 [DOI] [PMC free article] [PubMed] [Google Scholar]
- Levy S. (1992) Effect of intracellular injection of inositol trisphosphate on cytosolic calcium and membrane currents in Aplysia neurons. J Neurosci 12:2120–2129. 10.1523/JNEUROSCI.12-06-02120.1992 [DOI] [PMC free article] [PubMed] [Google Scholar]
- Lupinsky DA, Magoski NS (2006) Ca2+-dependent regulation of a non-selective cation channel from Aplysia bag cell neurones. J Physiol 575:491–506. 10.1113/jphysiol.2006.105833 [DOI] [PMC free article] [PubMed] [Google Scholar]
- Magoski NS. (2004) Regulation of an Aplysia bag-cell neuron cation channel by closely associated protein kinase A and a protein phosphatase. J Neurosci 24:6833–6841. 10.1523/JNEUROSCI.1694-04.2004 [DOI] [PMC free article] [PubMed] [Google Scholar]
- Magoski NS. (2017) Electrical synapses and neuroendocrine cell function. In: Network functions and plasticity: perspectives from studying neuronal electrical coupling in microcircuits (Jing J. ed), pp 137–160. Amsterdam, the Netherlands: Elsevier. [Google Scholar]
- Magoski NS, Kaczmarek LK (2005) Association/dissociation of a channel-kinase complex underlies state-dependent modulation. J Neurosci 25:8037–8047. 10.1523/JNEUROSCI.1903-05.2005 [DOI] [PMC free article] [PubMed] [Google Scholar]
- Magoski NS, Wilson GF, Kaczmarek LK (2002) Protein kinase modulation of a neuronal cation channel requires protein–protein interactions mediated by an src homology 3 domain. J Neurosci 22:1–9. 10.1523/JNEUROSCI.22-11-00001.2002 [DOI] [PMC free article] [PubMed] [Google Scholar]
- McLaughlin S, Murray D (2005) Plasma membrane phosphoinositide organization by protein electrostatics. Nature 438:605–611. 10.1038/nature04398 [DOI] [PubMed] [Google Scholar]
- Michel S, Wayne NL (2002) Neurohormone secretion persists after post-afterdischarge membrane depolarization and cytosolic calcium elevation in peptidergic neurons in intact nervous tissue. J Neurosci 22:9063–9069. 10.1523/JNEUROSCI.22-20-09063.2002 [DOI] [PMC free article] [PubMed] [Google Scholar]
- Montell C. (2005) The TRP superfamily of cation channels. Sci STKE 2005:re3. 10.1126/stke.2722005re3 [DOI] [PubMed] [Google Scholar]
- Newton AC. (1997) Regulation of protein kinase C. Curr Opin Cell Biol 9:161–167. 10.1016/S0955-0674(97)80058-0 [DOI] [PubMed] [Google Scholar]
- Nishizuka Y. (1984) The role of protein kinase C in cell surface signal transduction and tumour promotion. Nature 308:693–698. 10.1038/308693a0 [DOI] [PubMed] [Google Scholar]
- Pinsker HM, Dudek FE (1977) Bag cell control of egg laying in freely behaving Aplysia. Science 197:490–493. 10.1126/science.197.4302.490 [DOI] [PubMed] [Google Scholar]
- Piomelli D, Shapiro E, Feinmark SJ, Schwartz JH (1987) Metabolites of arachidonic acid in the nervous system of Aplysia: possible mediators of synaptic modulation. J Neurosci 7:3675–3686. 10.1523/JNEUROSCI.07-11-03675.1987 [DOI] [PMC free article] [PubMed] [Google Scholar]
- Redman RS, Berry RW (1993) Temperature-dependent stimulation and inhibition of adenylate cyclase by Aplysia bag cell peptides. Brain Res Mol Brain Res 17:245–250. 10.1016/0169-328X(93)90008-D [DOI] [PubMed] [Google Scholar]
- Roberts-Crowley ML, Mitra-Ganguli T, Liu L, Rittenhouse AR (2009) Regulation of voltage-gated Ca2+ channels by lipids. Cell Calcium 45:589–601. 10.1016/j.ceca.2009.03.015 [DOI] [PMC free article] [PubMed] [Google Scholar]
- Seidler NW, Jona I, Vegh M, Martonosi A (1989) Cyclopiazonic acid is a specific inhibitor of the Ca2+-ATPase of sarcoplasmic reticulum. J Biol Chem 264:17816–17823. [PubMed] [Google Scholar]
- Song T, Hao Q, Zheng YM, Liu QH, Wang YX (2015) Inositol 1,4,5-trisphosphate activates TRPC3 channels to cause extracellular Ca2+ influx in airway smooth muscle cells. Am J Physiol Lung Cell Mol Physiol 309:L1455–L1466. 10.1152/ajplung.00148.2015 [DOI] [PMC free article] [PubMed] [Google Scholar]
- Sossin WS, Abrams TW (2009) Evolutionary conservation of the signaling proteins upstream of cyclic AMP-dependent kinase and protein kinase C in gastropod mollusks. Brain Behav Evol 74:191–205. 10.1159/000258666 [DOI] [PMC free article] [PubMed] [Google Scholar]
- Strong JA, Fox AP, Tsien RW, Kaczmarek LK (1987) Stimulation of protein kinase C recruits covert calcium channels in Aplysia bag cell neurons. Nature 325:714–717. 10.1038/325714a0 [DOI] [PubMed] [Google Scholar]
- Strumwasser F. (1971) The cellular basis of behavior in Aplysia. J Psychiatr Res 8:237–257. 10.1016/0022-3956(71)90022-7 [DOI] [PubMed] [Google Scholar]
- Sturgeon RM, Baenziger JE (2010) Cations mediate interactions between the nicotinic acetylcholine receptor and anionic lipids. Biophys J 98:989–998. 10.1016/j.bpj.2009.11.030 [DOI] [PMC free article] [PubMed] [Google Scholar]
- Sturgeon RM, Magoski NS (2016) Diacylglycerol-mediated regulation of Aplysia bag cell neuron excitability requires protein kinase C. J Physiol 594:5573–5592. 10.1113/JP272152 [DOI] [PMC free article] [PubMed] [Google Scholar]
- Tam AK, Gardam KE, Lamb S, Kachoei BA, Magoski NS (2011) Role for protein kinase C in controlling Aplysia bag cell neuron excitability. Neuroscience 179:41–55. 10.1016/j.neuroscience.2011.01.037 [DOI] [PubMed] [Google Scholar]
- Wayne NL, Lee W, Kim YJ (1999) Persistent activation of calcium-activated and calcium-independent protein kinase C in response to electrical afterdischarge from peptidergic neurons of Aplysia. Brain Res 834:211–213. 10.1016/S0006-8993(99)01594-2 [DOI] [PubMed] [Google Scholar]
- Wen PJ, Osborne SL, Meunier FA (2012) Phosphoinositides in neuroexocytosis and neuronal diseases. Curr Top Microbiol Immunol 362:87–98. 10.1007/978-94-007-5025-8_4 [DOI] [PubMed] [Google Scholar]
- White SH, Magoski NS (2012) Acetylcholine-evoked afterdischarge in Aplysia bag cell neurons. J Neurophysiol 107:2672–2685. 10.1152/jn.00745.2011 [DOI] [PubMed] [Google Scholar]
- White SH, Sturgeon RM, Gu Y, Nensi A, Magoski NS (2018) Tyrosine phosphorylation determines afterdischarge initiation by regulating an ionotropic cholinergic receptor. Neuroscience 372:273–288. 10.1016/j.neuroscience.2017.12.049 [DOI] [PubMed] [Google Scholar]
- Wilson GF, Kaczmarek LK (1993) Mode-switching of a voltage-gated cation channel is mediated by a protein kinase A-regulated tyrosine phosphatase. Nature 366:433–438. 10.1038/366433a0 [DOI] [PubMed] [Google Scholar]
- Wilson GF, Richardson FC, Fisher TE, Olivera BM, Kaczmarek LK (1996) Identification and characterization of a Ca2+-sensitive nonspecific cation channel underlying prolonged repetitive firing in Aplysia neurons. J Neurosci 16:3661–3671. 10.1523/JNEUROSCI.16-11-03661.1996 [DOI] [PMC free article] [PubMed] [Google Scholar]
- Wilson GF, Magoski NS, Kaczmarek LK (1998) Modulation of a calcium-sensitive nonspecific cation channel by closely associated protein kinase and phosphatase activities. Proc Natl Acad Sci U S A 95:10938–10943. 10.1073/pnas.95.18.10938 [DOI] [PMC free article] [PubMed] [Google Scholar]
- Worley PF, Baraban JM, Supattapone S, Wilson VS, Snyder SH (1987) Characterization of inositol trisphosphate receptor binding in brain. regulation by pH and calcium. J Biol Chem 262:12132–12136. [PubMed] [Google Scholar]
- Zhang XF, Hyland C, Van Goor D, Forscher P (2012) Calcineurin-dependent cofilin activation and increased retrograde actin flow drive 5-HT-dependent neurite outgrowth in Aplysia bag cell neurons. Mol Biol Cell 23:4833–4848. 10.1091/mbc.e12-10-0715 [DOI] [PMC free article] [PubMed] [Google Scholar]