Abstract
In this photo essay, we present a sampling of technologies from laboratories at the forefront of whole-brain clearing and imaging for high-resolution analysis of cell populations and neuronal circuits. The data presented here were provided for the eponymous Mini-Symposium presented at the Society for Neuroscience's 2018 annual meeting.
Introduction
Microscopic analysis of tissues reveals that intricate organization of cells underlies biological function. Tissues are not translucent against visible light, so it is impossible to image far beyond the surface. Thus, conventional tissue imaging applies a microtome to cut samples into thin sections before staining with dyes and antibodies to visualize cells. Inferring 3D structure from thin sections is often problematic, and requires minimal sample distortion and precision alignment of serial sections.
The analysis of large 3D volumes is necessary for mapping the connections of far-reaching neurons inside the brain and determining the nature of cellular interactions underlying proper function and behavior. In recent years, several techniques have emerged to achieve optical transparency and enable high-resolution microscopy of thick tissue sections and whole organs. These techniques use different strategies to reduce light scattering in tissues and improve image sharpness.
Scattering occurs in tissues due to light's heterogeneous interaction with different molecules, subcellular structures, membranes, and cell populations inside the tissue. For example, the interface between a cell's lipid membrane and the cytoplasm causes a significant drop in refractive index (RI). Heterogeneity at the scale of molecules, cells, and tissues contribute to light scattering and requires homogenization via tissue clearing to increase overall light penetration (Tainaka et al., 2016; Treweek and Gradinaru, 2016). Combining tissue clearing with light-sheet fluorescence microscopy (LSFM) has paved the road for current whole-brain imaging by eliminating out-of-focus excitation (hence reduced background level and greatly preventing photo-bleaching), and by accelerating image acquisition.
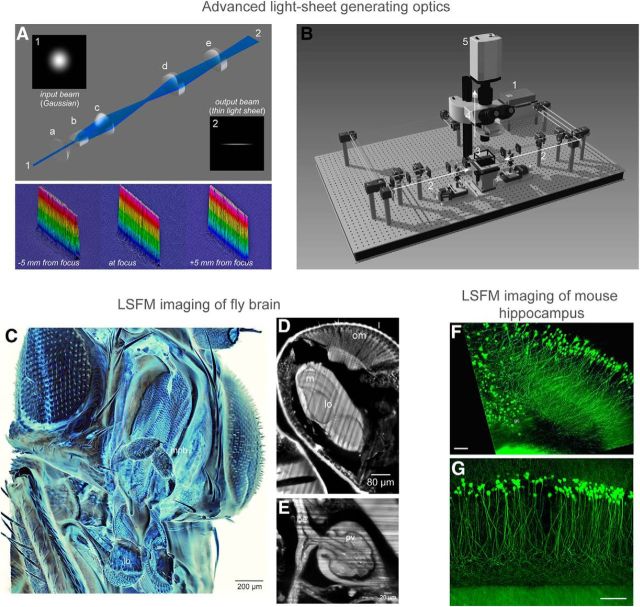
Tissue clearing originated in the early 20th century, when Werner Spalteholz experimented with high RI organic solvents (Spalteholz, 1914). Organic solvent-based clearing homogenizes a tissue's RI by the removal of highly scattering lipids and the displacement of water by high RI solvents. Building on this approach, Dodt's group revitalized organic solvent-based tissue clearing for the modern era of neuroscience by coupling it with a new optical imaging method that improves the resolution and field-of-view using LSFM (Fig. 1; Dodt et al., 2007; Ertürk et al., 2012; Saghafi et al., 2014). This technique allows rapid imaging of larger volumes than with conventional point scanning microscopy. Erturk's group developed uDISCO method (Fig. 2) to image whole-mouse bodies (Pan et al., 2016) and recently vDISCO method, a whole-mouse immunolabeling method to amplify the signal two orders of magnitude for detecting single cells in cleared mouse bodies through intact bones and muscles (Cai et al., 2018). vDISCO enabled construction of the first whole-mouse neuronal connectivity map, study brain trauma effects in peripheral nerves, and image meningeal vessels and their cellular contest through intact skull.
Figure 1.
The optical resolution of light-sheet microscopy is determined by both detection objective NA and thickness of the illuminating laser sheet. In conventional light-sheet microscopy, there is a fundamental tradeoff between light-sheet thickness and the field-of-view; when a thin laser sheet is illuminated (hence a higher axial resolution), the effective imaging area (determined by Rayleigh length) must decrease rapidly. To overcome this tradeoff, one approach is to use a beam that is generated by a sequence of aspheric lenses (Saghafi et al., 2014). A, The optical design of this light-sheet generator, along with the measurements of the beam profile along the x-y plane for confirmation of the extended Rayleigh range. Each optical element in the design are as follows: (a) first aspheric condenser lens, (b) Powell lens, (c) second aspheric condenser lens, (d) first achromatic cylindrical lens, and (e) second achromatic cylindrical lens. B, A Scheme of the ultramicroscopy setup: (1) 488 nm laser; (2) light-sheet generator optics, duplicate arms are placed on the left and right side of the specimen container; (3) specimen container with quartz windows; (4) detection arm with an exchangeable objective; and (5) scientific grade CCD camera. The objective for imaging is dipped into the clearing solution from above so that the objectives can be exchanged easily for change of magnification. C–E, Using a custom-made ultramicroscope equipped with the novel light-sheet generator, a cleared fruit-fly brain was imaged and reconstructed in 3D. A virtual cross-section through the head is presented in D. om, Ommatidia; m, medulla; lo, lobula. A virtual cross-section through the thorax is presented in E. oe, Esophagus; pv, proventriculus (cardia). F, G, The hippocampus area of Thy1-EGFP-M mouse brain was dissected and cleared, and imaged with ultramicroscopy. Close-up with 10× magnification (F) and 20× magnification (G) are shown. Scale bars: F, G, 100 μm .
Figure 2.
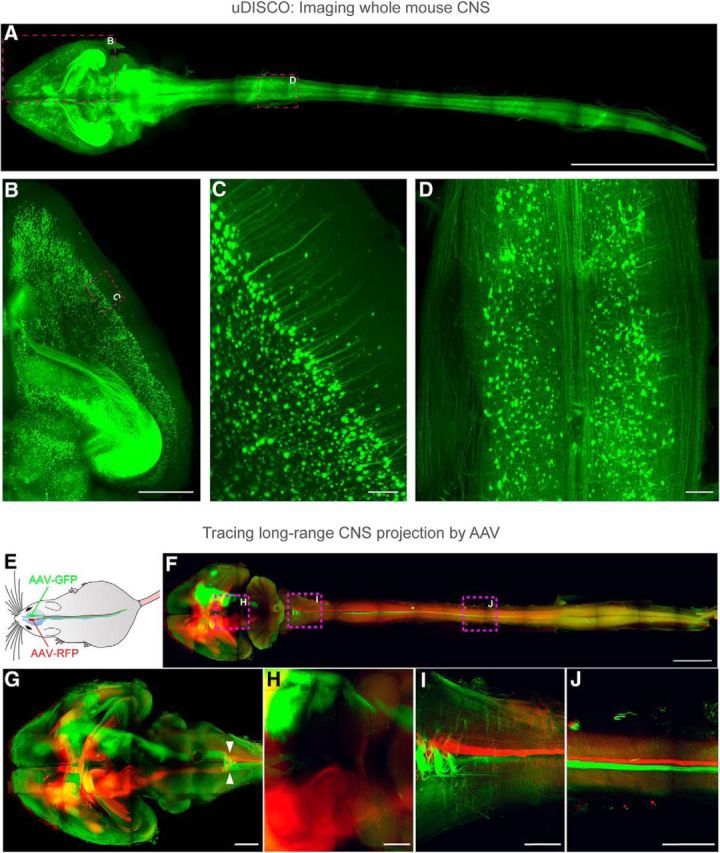
uDISCO enables investigation of long-range neuronal connections spanning the entire mouse body and entire CNS in unprecedented detail (Pan et al., 2016). A–D, The entire CNS (whole brain and spinal cord) of a Thy1-GFP-M mouse was cleared by uDISCO and imaged by LSFM. Because of the superior preservation of the fluorescent protein signals achieved by uDISCO, detailed neuronal structures are clearly visible. Zoom-in view of the brain hemisphere and spinal cord within boxed region in A are shown in B and D, respectively. Zoom-in view of B is shown in C, where individual pyramidal cell bodies and dendrites are clearly resolved. Scale bars: A, 10 mm; B, 1 mm; C, 100 μm; D, 1 mm. E–J, AAV2-Syn-GFP was transduced in the right motor cortex of mice, and AAV2-Syn-RFP in the left motor cortex. The brain was then cleared by uDISCO and imaged with LSFM. Fluorescence expression of the virally delivered proteins was detectable in the brain and throughout the intact spinal cord (F–J). Details of neuronal extensions of boxed regions in F are shown in H (thalamus and midbrain), I (cervical), and J (thoracic spinal cord regions). Arrowheads in G indicate decussation of the descending motor axons. Scale bars: F, 5 mm; G, 2 mm; H–J, 1 mm.
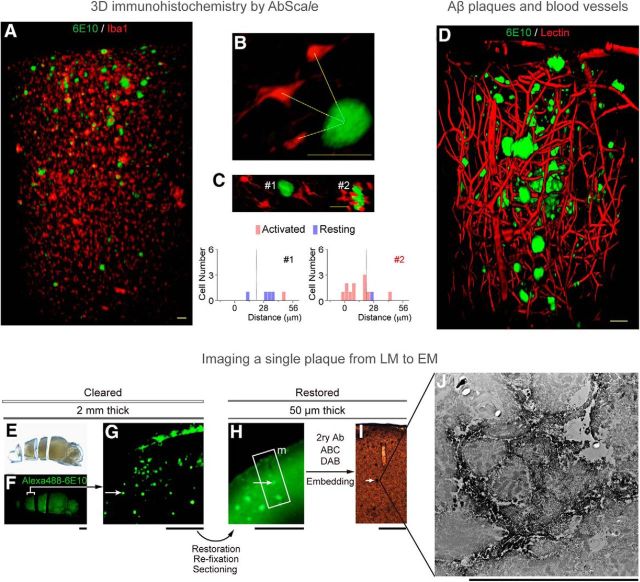
Some techniques have replaced organic solvents with aqueous solutions to improve preservation of endogenous reporter proteins and simplicity of experimental handling, since a urea-based clearing reagent ScaleA2 was developed (Hama et al., 2011). To date, various mixtures and protocols have emerged that use aqueous chemicals for whole-tissue clearing. Miyawaki's group has additionally developed a urea/sorbitol-based clearing method called ScaleS (Hama et al., 2015) to achieve mild clarification where synaptic ultrastructure, observed by electron microscopy, is well preserved. ScaleS was capable of imaging Aβ plaques in rodent models of Alzheimer's disease and human clinical samples (Fig. 3). Ueda's group has developed a clearing method called CUBIC (clear, unobstructed brain/body imaging cocktails and computational analysis; Susaki et al., 2014, 2015; Tainaka et al., 2014; Kubota et al., 2017) and has recently reported controlled expansion of cleared mouse brains using CUBIC-X (Fig. 4; Murakami et al., 2018). Physical expansion of a sample (or swelling) enables imaging of subcellular structures across the entire mouse brain. Using LSFM, authors generated a point-based mouse brain atlas (called CUBIC-Atlas) with single-cell annotation, and tracked postnatal subregion development in mice.
Figure 3.
Three-dimensional immunohistochemistry enables analysis of clinical samples, where transgenic or viral labeling strategies cannot be used. ScaleS and AbScale protocols ensure reliable, reproducible, and homogeneous penetration of antibodies while conserving tissue ultrastructure (Hama et al., 2015). A–C, A 2-mm-thick brain slice from an Alzheimer's disease (AD) model mouse was stained with AlexaFluor 488-6E10 (green) and AlexaFluor 546-Iba1 (red) using the AbScale protocol, to visualize the distribution of Aβ plaques and microglia. High-magnification images allow quantification of the distance between Aβ plaques and microglia in resting or activated states (B). Two representative Aβ plaques and microglia are shown, along with the distribution of activated and resting microglia distances (C). Scale bars: A–C, 50 μm. D, A 3D block of cerebral cortex from AD model mouse was stained with AlexaFluor 488-6E10 (green) and Texas Red lectin (red), to reveal the distribution of Aβ plaques and blood vessels. Scale bar, 50 μm. E–J, A single plaque was tracked at multiple scales by successive imaging with light (LM) and electron microscopy (EM). A 2-mm-thick slice from AD model mouse brain was cleared and stained by AbScale (E, F). After restoration and re-fixation, 50 μm sections were made, followed by DAB staining with secondary antibody (H, I). Finally, 70-nm-thick ultrathin sections were imaged with TEM. The ScaleS protocol performs excellently in preserving the ultrafine structures at nanometer scale. Scale bars: F, G, 1 mm; H, I, 50 μm; J, 2 μm.
Figure 4.
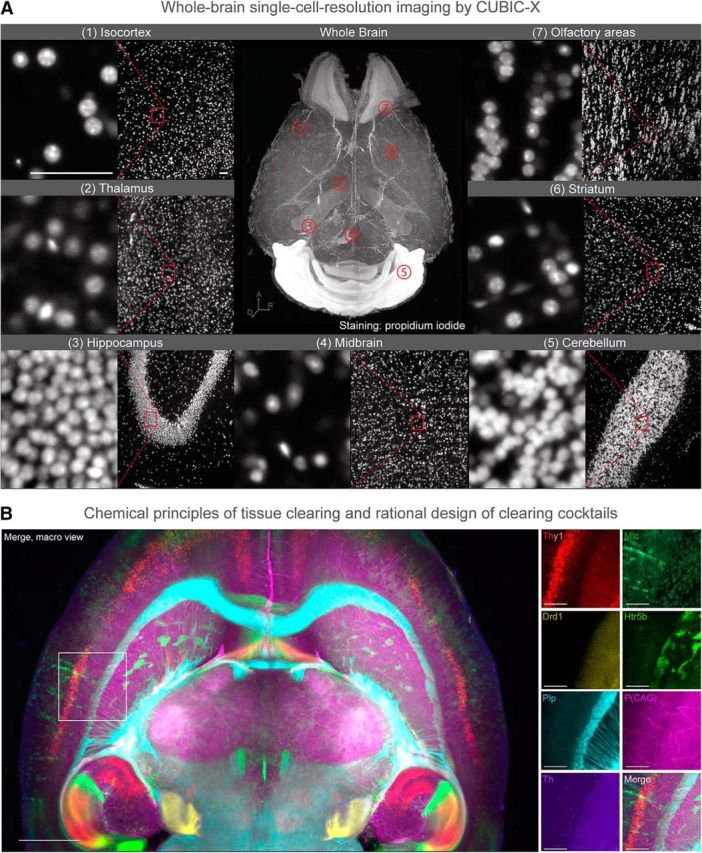
To acquire a fundamental understanding of tissue clearing by hydrophilic reagents, Ueda's group strategically screened >1600 chemicals, and identified key chemical properties that contribute to the clearing. These include salt-free amine with high octanol/water partition-coefficient (logP) for delipidation, N-alkylimidazole for decoloring, aromatic amide for RI matching, and protonation of phosphate ion for decalcification (Tainaka et al., 2018). By combining these insights, it is now possible to rationally design a new family of CUBIC protocols that are optimized, for example, for large primate and human tissues. Further, Ueda's group developed the CUBIC-X protocol, a fluorescent-protein-compatible, whole-organ clearing and homogeneous expansion method (Murakami et al., 2018), which can be combined with high-resolution LSFM to enable subcellular resolution imaging and digital identification of all cell nuclei in the adult mouse brain. A, CUBIC-X-treated whole mouse brain (2.2-fold linear expansion) was stained with propidium iodide, and was imaged with high-resolution LSFM (NA = 0.6). Whole-brain 3D rendering (center) and zoom-in images of representative brain regions (side panels with two-step magnification) are shown. Each individual cell nuclei (and even its condensation pattern in some cells) were clearly resolved across all brain regions, which were automatically detected by GPU-based high-speed algorithm. This allowed construction of the CUBIC-Atlas, a mouse brain atlas comprising an ensemble of ∼72 million cells. Scale bars: 50 μm (after normalizing the sample expansion). B, Using a new CUBIC protocol optimized for preserving fluorescent protein (FP) signals (Tainaka et al., 2018), a virtual-multiplex imaging of whole mouse brain was demonstrated. Seven individual brains with genetically encoded FPs were registered onto the reference brain, which revealed the brain-wide distribution of unique cell types; pyramidal neurons (Thy1-YFP), astrocytes (Mlc1-YFP), oligodendrocytes (Plp-YFP), dopaminergic neurons (Th-EGFP), serotonin receptor 5B (Htr5b-YFP), and dopamine receptor D1 (Drd1-mVenus). Scale bars: macro view, 1500 μm; zoom-in view, 500 μm.
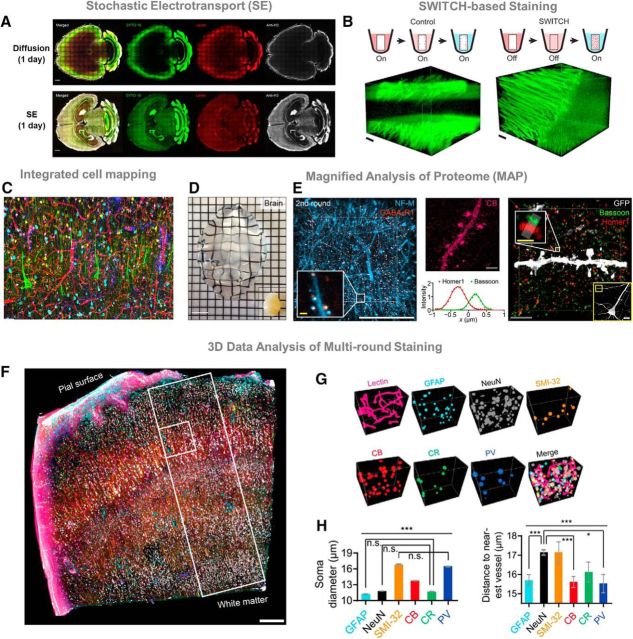
Another important innovation in tissue imaging and phenotyping is the development of technologies that engineer tissue physicochemical properties, tissue-molecular interaction, and molecular transport within intact tissue. Chung's group has developed a suite of technologies that engineer tissue properties to maximally preserve tissue information using synthetic polymer (e.g., CLARITY, MAP) or crosslinker-based tissue reinforcement strategies (e.g., SWITCH, Fig. 5; Chung et al., 2013; Murray et al., 2015; Ku et al., 2016). They have also developed MAP (magnified analysis of proteome) that expands entire brains fourfold linearly while preserving 3D proteome for super-resolution molecular imaging. When the transport of reagents into a large volume is diffusion-limited, chemical reactions are slow and uneven. To achieve uniform tissue preservation and staining, the Chung group has developed SWITCH to control a wide range of chemical reaction kinetics. In addition, they have developed stochastic electro-transport (Kim et al., 2015) that accelerates lipid removal and tissue staining to substantially improve the throughput of intact tissue phenotyping approaches. Together, these technologies enable rapid, integrated, multiscale phenotyping of neuronal circuits.
Figure 5.
A, CLARITY-processed mouse brains were stained with SYTO 16 (green), tomato lectin (red), and anti-histone H3 antibodies (white). Compared with standard diffusion (top row), Stochastic electro-transport (SE) (bottom row; Kim et al., 2015) accelerates tissue labeling with fluorescent markers by applying a rotational electric field. SE achieves complete and uniform staining of an adult mouse brain in a single day. Scale bar, 1 mm. B, SWITCH (Murray et al., 2015) is a method that enables uniform tissue processing for large-scale tissues. Molecule transport is decoupled from its interaction with the sample. For example, DiD lipid dye under standard diffusion produces incomplete staining mostly saturated at the tissue surface (left). In SWITCH, the reactivity of fixatives, dyes, and antibodies is suppressed in SWITCH-OFF buffer to allow the probes to readily diffuse deep into the tissue. For DiD, OFF buffer contains a low concentration of SDS detergent to block lipid binding until the tissue is saturated. Then, transfer to “ON buffer” DiD dye binds to lipids (right). SWICTH technique produces rapid and uniform tissue staining compared with standard diffusion. Scale bar, 200 μm. C, Tissue processing in the Chung laboratory enable multiple rounds of antibody staining. Here, we show a fully coregistered image showing various cell types in human visual cortex. D, MAP (Ku et al., 2016) physically expands tissues to achieve a fourfold increase in image resolution. MAP is applicable to intact organs, such as mouse brain. Scale bar, 1 cm. E, Left, A 3D render of a cortical sample stained with neurofilament medium unit (NF-M; blue) and GABAB receptor subunit-1 (GABABR1; red) antibodies; inset, synaptic neurofilaments colocalized with GABAergenic postsynaptic proteins. Middle, a maximum intensity projection image of calbindin (CB; magenta) showing dendritic spines. Right, synaptic structures in MAP samples resolved with a presynaptic (bassoon) and postsynaptic marker (homer1) in the cortex. Yellow box shows a GFP-positive neuron; white box highlights the elliptical structures of presynaptic and postsynaptic proteins distributed at a synaptic junction. The intensity of markers along the synapse axis confirms separation of presynaptic and postsynaptic markers. Scale bars: white, 50 μm; gray, 10 μm; yellow, 1 μm. F, SWITCH glutaraldehyde-reinforced human brain tissue shows a coregistered overlay of 9 of 22 different rounds of immunostaining. Scale bar, 300 μm. G, Information-rich datasets obtained from multi-round staining can be used for quantitative analysis of 3D volumes. H, As a proof-of-concept soma diameter and distance to nearest blood vessel are compared for six different cell types (*p < 0.05, ***p < 0.001; ANOVA).
Gradinaru's group has developed hydrogel-tissue chemistry (HTC)-based strategies to stabilize endogenous fluorescent proteins and tissue biomolecules during successive rounds of clearing, RNA labeling via single-molecule fluorescence in situ hybridization or hybridization chain reaction (HCR), immunohistochemistry, and imaging at depth (Fig. 6; Yang et al., 2014; Treweek et al., 2015; Shah et al., 2016; Greenbaum et al., 2017a,b). Recent work on viral vector engineering has led to the generation of novel AAV capsids with enhanced tropism for specific cell types, and with the ability to cross the blood–brain barrier when delivered systemically (Deverman et al., 2016; Chan et al., 2017). These vectors permit noninvasive gene transfer and tunable multicolor labeling of discrete cell populations across the CNS and PNS.
Figure 6.
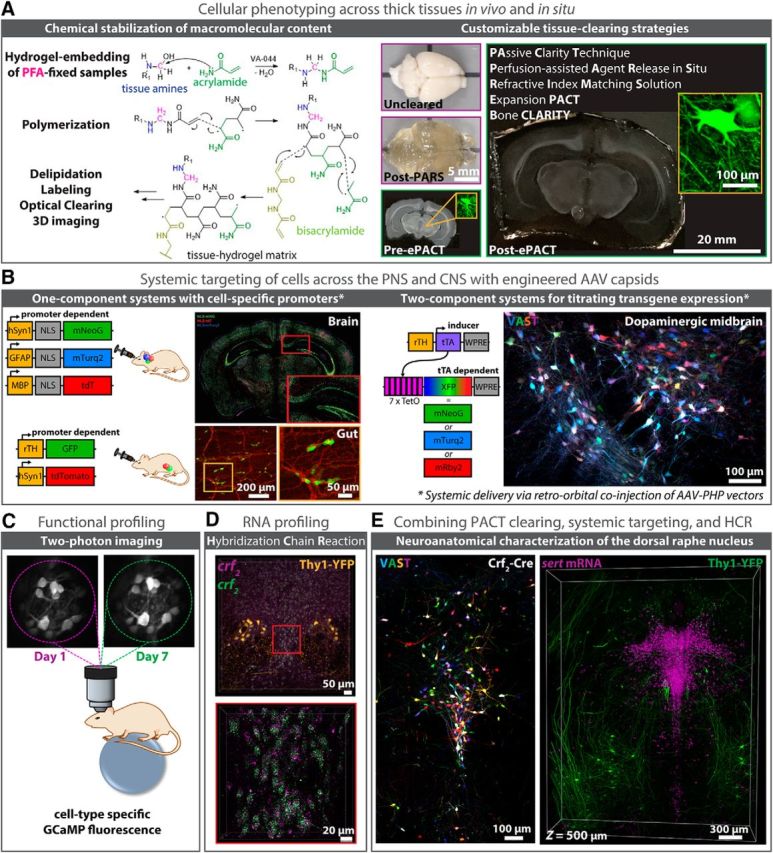
Advancing modern neuroscience endeavors is the development of techniques for modifying chemically-distinct and/or genetically-specified cells and circuits for high-resolution imaging at depth. Among these techniques are as follows: (A) HTC-based biomolecule stabilization and tissue-clearing (images adapted from Yang et al., 2014; Treweek et al., 2015; Treweek and Gradinaru, 2016; Greenbaum et al., 2017a; Gradinaru et al., 2018), (B) viral vector engineering [left, Cre recombinase-based AAV targeted evolution (CREATE); right, vector-assisted spectral tracing (VAST); Deverman et al., 2016; Chan et al., 2017; Bedbrook et al., 2018; Challis et al., 2018], and (C, E) methodologies for cell-profiling in vivo and in situ. Recent advances in modern microscopy [e.g., LSFM and ultramicroscopy (Dodt et al., 2007); CLARITY-optimized light-sheet microscopy (Tomer et al., 2014); two-photon microscopy and microendoscopy (Jung et al., 2004; Barretto et al., 2011; Marshall et al., 2016)], allow researchers to visualize deep tissue structures in real-time (C), and to image large tissue volumes rapidly and with subcellular resolution [D, E; HCR (Choi et al., 2014; Shah et al., 2016; Greenbaum et al., 2017b)]. Complementing these technologies are improved strategies for targeting individual cell populations and neuronal circuits, such as through the use of genetically engineered animal models (e.g., rodent fluorescent reporter and Cre driver lines; D, E) or through the systemic delivery (e.g., via retro-orbital (RO) injection) of viral vectors with unique cell tropism (Deverman et al., 2016; Chan et al., 2017); B, Top left, For CNS targeting, AAV-PHP.eB was used to package single-stranded (ss) rAAV genomes expressing nuclear localized (NLS) fluorescent reporters (XFP) from cell type-specific promoters for neurons (hSyn1, green), oligodendrocytes (MBP, red), or astrocytes (GFAP, blue), resulting in brain-wide gene expression upon RO delivery; bottom left, for PNS targeting, AAV-PHP.S was used to package ss-rAAV genomes expressing XFPs from either neuron-specific (hSyn1) or tyrosine hydroxylase (rTH)-specific promoters, with RO injection of ssAAVPHP.S:rTH-GFP and ssAAV-PHP.S:hSyn1-tdTomato-f (farnesylated) resulting in gene expression throughout TH+-containing cell bodies (green) and nerve bundles (red) of the myenteric and submucosal plexus of the duodenum; images adapted from Challis et al., 2018) and/or multicolor labeling capabilities (Chan et al., 2017; e.g., VAST; B, right; E, left), the latter of which promotes cell-sorting and long-range projection mapping endeavors (Bedbrook et al., 2018). D, E, Likewise, methodologies for labeling RNA transcripts and protein epitopes have been adapted for use alongside tissue-clearing protocols (E; Shah et al., 2016; Greenbaum et al., 2017b). Here, HCR is uniquely suited to imaging RNA point-labels at depth with up to single-molecule precision (D), and to resisting label loss during immunohistochemistry (E) through its use of fluorescence signal amplification and direct in situ hybridization-based readout (Choi et al., 2014).
This sampling of current work demonstrates how the breathtaking complexity of the human brain and brains of other preclinical models continues to inspire technological advancements in whole-tissue clearing, fluorescent labeling, microscope design, and analysis of large information-rich datasets. These technological breakthroughs are paving the road to whole-brain single-cell atlases and connectomes (maps of connected neurons) for future neuroscientists.
Footnotes
The Dodt laboratory thanks Dr. Saiedeh Saghafi and Dr. Klaus Becker for aspheric optics-based LSFM work, and the Austrian science funding agency FWF and the German Hertie foundation for support; the Ertürk laboratory thanks Ruiyao Cai for uDISCO figure and Synergy Excellence Cluster Munich (SyNergy), Fritz Thyssen Stiftung, and DFG for support; the Miyawaki laboratory thanks Dr. Hiroshi Hama for ScaleS figure and Grant-in-Aid for Scientific Research on Priority Areas (JSPS KAKENHI), the Human Frontier Science Program, and the Brain Mapping by Integrated Neurotechnologies for Disease Studies (Brain/MINDS) for support; the Ueda laboratory thanks Tatsuya Murakami for offering picture materials for CUBIC figure, and Brain/MINDS (AMED/MEXT), the Basic Science and Platform Technology Program for Innovative Biological Medicine (AMED/MEXT)and Grant-in-Aid for Scientific Research (S) (JSPS KAKENHI) for support; the Chung laboratory thanks The Packard Award, the McKnight Foundation and the NIH (1-DP2-ES027992) for support; the Gradinaru laboratory thanks Sripriya Ravindra Kumar, Gerard M. Coughlin, Rosemary Challis, and Collin Challis for CREATE and VAST images, Min Jee Jang for HCR images, and J. Ryan Cho for GCaMP imaging, and the NIH BRAIN Initiative and NIH Director's Office and NSF Neuronex for support.
The authors declare no competing financial interests.
References
- Barretto RP, Ko TH, Jung JC, Wang TJ, Capps G, Waters AC, Ziv Y, Attardo A, Recht L, Schnitzer MJ (2011) Time-lapse imaging of disease progression in deep brain areas using fluorescence microendoscopy. Nat Med 17:223–228. 10.1038/nm.2292 [DOI] [PMC free article] [PubMed] [Google Scholar]
- Bedbrook CN, Deverman BE, Gradinaru V (2018) Viral strategies for targeting the central and peripheral nervous systems. Annu Rev Neurosci 41:323–348. 10.1146/annurev-neuro-080317-062048 [DOI] [PubMed] [Google Scholar]
- Cai R, Pan C, Ghasemigharagoz A, Todorov MI, Foerstera B, Zhao S, Bhatia HS, Mrowka L, Theodorou D, Rempfler M, Xavier A, Kress BT, Benakis C, Liesz A, Menze B, Kerschensteiner M, Nedergaard M, Erturk A (2018) Panoptic vDISCO imaging reveals neuronal connectivity, remote trauma effects and meningeal vessels in intact transparent mice. bioRxiv 374785. Advance online publication. Retrieved July 23, 2018. doi: 10.1101/374785. [DOI] [Google Scholar]
- Challis RC, Kumar SR, Chan KY, Challis C, Jang MJ, Rajendran PS, Tompkins JD, Shivkumar K, Deverman BE, Gradinaru V (2018) Widespread and targeted gene expression by systemic AAV vectors: production, purification, and administration. bioRxiv 246405. Advance onile publication. Retrieved Jan 19, 2018. doi: 10.1101/246405. [DOI] [Google Scholar]
- Chan KY, Jang MJ, Yoo BB, Greenbaum A, Ravi N, Wu WL, Sánchez-Guardado L, Lois C, Mazmanian SK, Deverman BE, Gradinaru V (2017) Engineered AAVs for efficient noninvasive gene delivery to the central and peripheral nervous systems. Nat Neurosci 20:1172–1179. 10.1038/nn.4593 [DOI] [PMC free article] [PubMed] [Google Scholar]
- Choi HM, Beck VA, Pierce NA (2014) Next-generation in situ hybridization chain reaction: higher gain, lower cost, greater durability. ACS Nano 8:4284–4294. 10.1021/nn405717p [DOI] [PMC free article] [PubMed] [Google Scholar]
- Chung K, Wallace J, Kim SY, Kalyanasundaram S, Andalman AS, Davidson TJ, Mirzabekov JJ, Zalocusky KA, Mattis J, Denisin AK, Pak S, Bernstein H, Ramakrishnan C, Grosenick L, Gradinaru V, Deisseroth K (2013) Structural and molecular interrogation of intact biological systems. Nature 497:332–337. 10.1038/nature12107 [DOI] [PMC free article] [PubMed] [Google Scholar]
- Deverman BE, Pravdo PL, Simpson BP, Kumar SR, Chan KY, Banerjee A, Wu WL, Yang B, Huber N, Pasca SP, Gradinaru V (2016) Cre-dependent selection yields AAV variants for widespread gene transfer to the adult brain. Nat Biotechnol 34:204–209. 10.1038/nbt.3440 [DOI] [PMC free article] [PubMed] [Google Scholar]
- Dodt HU, Leischner U, Schierloh A, Jährling N, Mauch CP, Deininger K, Deussing JM, Eder M, Zieglgänsberger W, Becker K (2007) Ultramicroscopy: three-dimensional visualization of neuronal networks in the whole mouse brain. Nat Methods 4:331–336. 10.1038/nmeth1036 [DOI] [PubMed] [Google Scholar]
- Ertürk A, Becker K, Jährling N, Mauch CP, Hojer CD, Egen JG, Hellal F, Bradke F, Sheng M, Dodt HU (2012) Three-dimensional imaging of solvent-cleared organs using 3DISCO. Nat Protoc 7:1983–1995. 10.1038/nprot.2012.119 [DOI] [PubMed] [Google Scholar]
- Gradinaru V, Treweek J, Overton K, Deisseroth K (2018) Hydrogel-tissue chemistry: principles and applications. Annu Rev Biophys 47:355–376. 10.1146/annurev-biophys-070317-032905 [DOI] [PMC free article] [PubMed] [Google Scholar]
- Greenbaum A, Chan KY, Dobreva T, Brown D, Balani DH, Boyce R, Kronenberg HM, McBride HJ, Gradinaru V (2017a) Bone CLARITY: clearing, imaging, and computational analysis of osteoprogenitors within intact bone marrow. Sci Transl Med 9:eaah6518. 10.1126/scitranslmed.aah6518 [DOI] [PubMed] [Google Scholar]
- Greenbaum A, Jang MJ, Challis C, Gradinaru V (2017b) Q&A: how can advances in tissue clearing and optogenetics contribute to our understanding of normal and diseased biology? BMC Biol 15:87. 10.1186/s12915-017-0421-3 [DOI] [PMC free article] [PubMed] [Google Scholar]
- Hama H, Kurokawa H, Kawano H, Ando R, Shimogori T, Noda H, Fukami K, Sakaue-Sawano A, Miyawaki A (2011) Scale: a chemical approach for fluorescence imaging and reconstruction of transparent mouse brain. Nat Neurosci 14:1481–1488. 10.1038/nn.2928 [DOI] [PubMed] [Google Scholar]
- Hama H, Hioki H, Namiki K, Hoshida T, Kurokawa H, Ishidate F, Kaneko T, Akagi T, Saito T, Saido T, Miyawaki A (2015) ScaleS: an optical clearing palette for biological imaging. Nat Neurosci 18:1518–1529. 10.1038/nn.4107 [DOI] [PubMed] [Google Scholar]
- Jung JC, Mehta AD, Aksay E, Stepnoski R, Schnitzer MJ (2004) In vivo mammalian brain imaging using one- and two-photon fluorescence microendoscopy. J Neurophysiol 92:3121–3133. 10.1152/jn.00234.2004 [DOI] [PMC free article] [PubMed] [Google Scholar]
- Kim SY, Cho JH, Murray E, Bakh N, Choi H, Ohn K, Ruelas L, Hubbert A, McCue M, Vassallo SL, Keller PJ, Chung K (2015) Stochastic electrotransport selectively enhances the transport of highly electromobile molecules. Proc Natl Acad Sci U S A 112:E6274–6283. 10.1073/pnas.1510133112 [DOI] [PMC free article] [PubMed] [Google Scholar]
- Ku T, Swaney J, Park JY, Albanese A, Murray E, Cho JH, Park YG, Mangena V, Chen J, Chung K (2016) Multiplexed and scalable super-resolution imaging of three-dimensional protein localization in size-adjustable tissues. Nat Biotechnol 34:973–981. 10.1038/nbt.3641 [DOI] [PMC free article] [PubMed] [Google Scholar]
- Kubota SI, Takahashi K, Nishida J, Morishita Y, Ehata S, Tainaka K, Miyazono K, Ueda HR (2017) Whole-body profiling of cancer metastasis with single-cell resolution. Cell Rep 20:236–250. 10.1016/j.celrep.2017.06.010 [DOI] [PubMed] [Google Scholar]
- Marshall JD, Li JZ, Zhang Y, Gong Y, St-Pierre F, Lin MZ, Schnitzer MJ (2016) Cell-type-specific optical recording of membrane voltage dynamics in freely moving mice. Cell 167:1650–1662.e15. 10.1016/j.cell.2016.11.021 [DOI] [PMC free article] [PubMed] [Google Scholar]
- Murakami TC, Mano T, Saikawa S, Horiguchi SA, Shigeta D, Baba K, Sekiya H, Shimizu Y, Tanaka KF, Kiyonari H, Iino M, Mochizuki H, Tainaka K, Ueda HR (2018) A three-dimensional single-cell-resolution whole-brain atlas using CUBIC-X expansion microscopy and tissue clearing. Nat Neurosci 21:625–637. 10.1038/s41593-018-0109-1 [DOI] [PubMed] [Google Scholar]
- Murray E, Cho JH, Goodwin D, Ku T, Swaney J, Kim SY, Choi H, Park YG, Park JY, Hubbert A, McCue M, Vassallo S, Bakh N, Frosch MP, Wedeen VJ, Seung HS, Chung K (2015) Simple, scalable proteomic imaging for high-dimensional profiling of intact systems. Cell 163:1500–1514. 10.1016/j.cell.2015.11.025 [DOI] [PMC free article] [PubMed] [Google Scholar]
- Pan C, Cai R, Quacquarelli FP, Ghasemigharagoz A, Lourbopoulos A, Matryba P, Plesnila N, Dichgans M, Hellal F, Ertürk A (2016) Shrinkage-mediated imaging of entire organs and organisms using uDISCO. Nat Methods 13:859–867. 10.1038/nmeth.3964 [DOI] [PubMed] [Google Scholar]
- Saghafi S, Becker K, Hahn C, Dodt HU (2014) 3D-ultramicroscopy utilizing aspheric optics. J Biophotonics 7:117–125. 10.1002/jbio.201300048 [DOI] [PubMed] [Google Scholar]
- Shah S, Lubeck E, Schwarzkopf M, He TF, Greenbaum A, Sohn CH, Lignell A, Choi HM, Gradinaru V, Pierce NA, Cai L (2016) Single-molecule RNA detection at depth by hybridization chain reaction and tissue hydrogel embedding and clearing. Development 143:2862–2867. 10.1242/dev.138560 [DOI] [PMC free article] [PubMed] [Google Scholar]
- Spalteholz W. (1914) Uber das durchsichtigmachen von menschlichen und tierischen präparaten und seine theoretischen bedingungen, nebst anhang: Uber Knochenfärbung. Leipzig: S. Hirzel. [Google Scholar]
- Susaki EA, Tainaka K, Perrin D, Kishino F, Tawara T, Watanabe TM, Yokoyama C, Onoe H, Eguchi M, Yamaguchi S, Abe T, Kiyonari H, Shimizu Y, Miyawaki A, Yokota H, Ueda HR (2014) Whole-brain imaging with single-cell resolution using chemical cocktails and computational analysis. Cell 157:726–739. 10.1016/j.cell.2014.03.042 [DOI] [PubMed] [Google Scholar]
- Susaki EA, Tainaka K, Perrin D, Yukinaga H, Kuno A, Ueda HR (2015) Advanced CUBIC protocols for whole-brain and whole-body clearing and imaging. Nat Protoc 10:1709–1727. 10.1038/nprot.2015.085 [DOI] [PubMed] [Google Scholar]
- Tainaka K, Murakami TC, Susaki EA, Shimizu C, Saito R, Takahashi K, Hayashi-Takagi A, Sekiya H, Arima Y, Nojima S, Ikemura M, Ushiku T, Shimizu Y, Murakami M, Tanaka KF, Iino M, Kasai H, Sasaoka T, Kobayashi K, Miyazono K, et al. (2018) Chemical landscape for tissue clearing based on hydrophilic reagents. Cell Rep 24:2196–2210.e9. 10.1016/j.celrep.2018.07.056 [DOI] [PubMed] [Google Scholar]
- Tainaka K, Kubota SI, Suyama TQ, Susaki EA, Perrin D, Ukai-Tadenuma M, Ukai H, Ueda HR (2014) Whole-body imaging with single-cell resolution by tissue decolorization. Cell 159:911–924. 10.1016/j.cell.2014.10.034 [DOI] [PubMed] [Google Scholar]
- Tainaka K, Kuno A, Kubota SI, Murakami T, Ueda HR (2016) Chemical principles in tissue clearing and staining protocols for whole-body cell profiling. Annu Rev Cell Dev Biol 32:713–741. 10.1146/annurev-cellbio-111315-125001 [DOI] [PubMed] [Google Scholar]
- Tomer R, Ye L, Hsueh B, Deisseroth K (2014) Advanced CLARITY for rapid and high-resolution imaging of intact tissues. Nat Protoc 9:1682–1697. 10.1038/nprot.2014.123 [DOI] [PMC free article] [PubMed] [Google Scholar]
- Treweek JB, Gradinaru V (2016) Extracting structural and functional features of widely distributed biological circuits with single cell resolution via tissue clearing and delivery vectors. Curr Opin Biotechnol 40:193–207. 10.1016/j.copbio.2016.03.012 [DOI] [PMC free article] [PubMed] [Google Scholar]
- Treweek JB, Chan KY, Flytzanis NC, Yang B, Deverman BE, Greenbaum A, Lignell A, Xiao C, Cai L, Ladinsky MS, Bjorkman PJ, Fowlkes CC, Gradinaru V (2015) Whole-body tissue stabilization and selective extractions via tissue-hydrogel hybrids for high-resolution intact circuit mapping and phenotyping. Nat Protoc 10:1860–1896. 10.1038/nprot.2015.122 [DOI] [PMC free article] [PubMed] [Google Scholar]
- Yang B, Treweek JB, Kulkarni RP, Deverman BE, Chen CK, Lubeck E, Shah S, Cai L, Gradinaru V (2014) Single-cell phenotyping within transparent intact tissue through whole-body clearing. Cell 158:945–958. 10.1016/j.cell.2014.07.017 [DOI] [PMC free article] [PubMed] [Google Scholar]


