Abstract
Photoacoustic imaging relies on diffused photons for optical contrast and diffracted ultrasound for high resolution. As a tomographic imaging modality, often an inverse problem of acoustic diffraction needs to be solved to reconstruct a photoacoustic image. The inverse problem is complicated by the fact that the acoustic properties, including the speed of sound distribution, in the image field of view are unknown. During reconstruction, subtle changes of the speed of sound in the acoustic ray path may accumulate and give rise to noticeable blurring in the image. Thus, in addition to the ultrasound detection bandwidth, inaccurate acoustic modeling, especially the unawareness of the speed of sound, defines the image resolution and influences image quantification. Here, we proposed a method termed feature coupling to jointly reconstruct the speed of sound distribution and a photoacoustic image with improved sharpness, at no additional hardware cost. Simulations, phantom studies, and in vivo experiments demonstrated the effectiveness and reliability of our method.
1. Introduction
As a high resolution optical imaging modality that overcomes the optical diffusion limit, photoacoustic (PA) tomography (PAT) can form images with high spatial resolution and sensitivity for endogenous and exogenous chromophores [1]. Based on optical absorption contrasts, PAT can provide anatomical, functional, and molecular images in a single modality [2–4]. In the optically diffusive regime, ideally the spatial resolution of PAT is roughly 1/200 of the imaging depth, as defined by acoustic attenuation [5]. However, the high resolution inherent in PAT is, in many cases, degraded due to a lack of information. For example, if the detection solid angle is less than 4π, a “missing cone” would exist to result in the “limited view” problem [6]. Reflection artefacts can also worsen PAT image quality in the presence of strong acoustic boundaries. There are already some methods that compensate for acoustic reflections and scattering [7,8], or generate ultrasound images based on scattering [9]. A more common problem causing resolution drop is acoustic heterogeneity. A general assumption in PA imaging is that the speed of sound (SOS) of the whole imaged scene, including water in the background, is homogeneous. However, the SOS of soft tissues varies from 1,350 m/s (for fat) to 1,700 m/s (for skin) [10], making the images reconstructed with the uniform SOS assumption subject to feature splitting, distortion, blurring, low contrast and poor quantitation. Therefore, taking into account the SOS distribution in PA image reconstruction is highly desirable.
With an extra acoustic source and its stepwise rotation, SOS distribution can be recovered through the analysis of the acoustic time of flight (TOF), at the expense of system complexity and imaging speed [11–16]. Alternatively, it is more tempting to jointly reconstruct the distributions of the SOS and the PA initial pressure (IP) by minimizing the difference between model-based predictions and experimental data, without resorting to additional SOS measurement hardware [17–21]. Unfortunately, most of these methods were only validated in simulations. Huang et al. proved that the conventional joint reconstruction problem is ill-conditioned, and numerically unstable [21]. The accuracy of the SOS estimation sensitively relies on the IP quantification accuracy, with the latter being hampered by the limited detection angle and temporal bandwidth of the sensors in real practice [21]. The instability of the linearized joint reconstruction method was also observed in [22].
There are some methods that mitigate the influence of the SOS heterogeneity, in which absolute quantification of IP is not necessary. For example, in half-time and partial-time reconstruction, a portion of the data is discarded [23–25]. Zhang et al. used signal correlation to obtain approximate TOF for each detector [26]. However, this method has an assumption that the detected target is relatively small compared to the detection geometry (i.e., the radius of the detection surface), because the integral surface can be approximated to a plane (in 3D) or a line (in 2D) and the calculation of time of flight between opposing detector pair can work. Moreover, the TOF of one point is calculated through linear scaling, which leads to large error if the SOS variation is not moderate. This method was tested in numerical experiments. Autofocusing finds a uniform SOS value for the whole imaged object, including the background, by optimizing the sharpness [27] or other image metrics [28]. However, the effectiveness of such methods are fundamentally limited when the SOS distribution is complex. Moreover, autofocusing is not an iterative search method based on gradient. It has to perform an exhaust search at a number of discrete SOS values, so the accuracy is influenced by the preset range and step. In a numerical experiment, Zhang et al. [29] obtained a single SOS value by minimizing the discrepancy between half-time reconstructions. This method is not based on gradient search either and its computational complexity depends exponentially on the number of unknowns.
We herein propose a simple and robust method to jointly reconstruct the SOS and IP distributions based upon only the PA data. We take advantage of the fact that any subsets of a full transducer array produce images with slightly displaced features, if the SOS distribution is not properly assigned during image reconstruction. Consequently, the image reconstructed from the full array will exhibit features that are split in various directions. Our method, termed feature coupling (FC), iteratively optimizes an SOS distribution by maximizing the similarity of images from the partial arrays. The optimization process gives rise to an IP image with minimum blur and simultaneously, a SOS map with high likelihood. One advantage of FC is its insensitivity to the quantification error in the IP. Technically, we adopted the gradient ascent with momentum algorithm in the iteration to accelerate convergence, and to avoid local optima. Furthermore, within each iteration, we designed and implemented accelerated fast marching method (AFMM) to accurately calculate TOF maps given SOS distributions of arbitrary complexity. The TOF maps are used in the successive image reconstruction. Being two hundred times faster than the original fast marching method, AFMM iteratively updates the TOF on a coarse grid in batch first, then on a fine grid through interpolation. We demonstrated the effectiveness and robustness of FC through numerical simulations, phantom studies, and in vivo experiments, on a panoramic (360° in-plane detection) PAT system. Similar systems have shown significance in both preclinical [30] and clinical applications [31].
2. Methods
2.1 Accelerated fast marching method
Filtered back-projection [32] is a commonly used method for IP reconstruction. Traditional back-projection assumes a uniform SOS distribution. For acoustically heterogeneous media, the calculation of TOF needs to take into account distinct SOS values of different part, and the formula of back-projection can be modified as
| (1) |
in which is the solid angle for a detection element at with respect to a reconstruction point at r, and is the TOF between r and For an ideal detection (i.e., transducers respond instantly), the back-projection term takes the following form:
| (2) |
In reality, the measurement signal can be directly adopted as the back-projection term, that is [33],
| (3) |
The fast marching method (FMM), which is based on the Eikonal equation (a non-linear partial differential equation whose solution tracks the TOF of a monotonically advancing front), can iteratively calculate the first arrival time of the photoacoustic wave with a known SOS distribution [34,35]. The Eikonal equation [34] is formulated as
| (4) |
where is the TOF map and v is the SOS map. To solve Eq. (4), the domain is discretized into a uniform grid with a spacing h. Due to the monotone and causal properties of this discretization, let and If Eq. (4) turns to be a quadratic equation [34], whose solution is
| (5) |
If assuming one of the partial derivatives is 0, the resolution is
| (6) |
However, the original FMM has high computational complexity because it has to maintain the narrow band implemented using a sorted heap data structure [34]. To solve this problem, an accelerated version of the FMM, i.e., AFMM, is proposed. In this method, the slowly varying TOF can be calculated on a coarse grid first, and the corresponding TOF on a fine grid can be obtained through interpolation. Since the ray path is reversible, each sensor point is assigned as a point source, and the TOF at all pixel points of the reconstruction domain is calculated iteratively. The iterative procedure of AFMM can be summarized as Algorithm 1 in Appendix.
The TOF threshold is formulated as where is the pixel size of the coarse grid, is the maximum SOS of the outer boundary of each iteration and is a weight usually fixed to be 1.5. The pixel size of the fine mesh is set to be 50 and that of the coarse mesh is 150 The reconstruction domain completely encloses the target (i.e., the cross-section of the animal or phantom) and is slightly larger than the target through image dilation, in order to avoid the detrimental interpolation error of the boundary of Compared to the original FMM, AFMM can process in parallel a batch of pixel points in each iteration. Moreover, primary calculation on the coarse mesh also increases the speed dramatically. For example, assuming a target diameter of 1.6 cm, a radius of the ring array of 5 cm, water and tissue SOS of 1,515 and 1,590 m/s, respectively, the calculation time of AFMM (0.55 s) is 1/212.53 of that of the original FMM (116.89 s) (Intel(R) Core(TM) i7-7700 CPU @ 3.6 GHz), while the mean TOF error is only 4.57 ns. After the TOF is obtained, back-projection (Eq. (1)) can be performed, denoted as AFMM-BP.
2.2 Feature coupling method
The sound speed distribution is approximated using finite-dimensional parameterization, i.e., piecewise constant. An initial coarse segmentation of the target can be obtained using half-time back-projection [23] based on the SOS of water. denotes the SOS of different regions, except water, whose SOS can be estimated through temperature measurement [36]. For the ring array system, if the estimated SOS has an obvious deviation from the real distribution, the features of the reconstructed images due to two half rings do not completely co-locate, manifesting as feature splits in the full ring image. Then the SOS distribution can be obtained by maximizing the similarity of the half-ring reconstructions, mathematically
| (7) |
where c is a similarity metric dependent upon . We choose correlation coefficient as the similarity metric, the evaluation of which is performed on the region identified as the target, denoted as the correlation domain . Then, explicitly,
| (8) |
where and are the half-ring images reconstructed with AFMM-BP. To reduce computational complexity, for each half ring we only select a subset of elements for AFMM-BP. The chosen elements are evenly distributed along the array at a fixed interval. For our simulation and phantom experiments, the interval was Ninter = 4 (elements); for our in vivo experiments, Ninter = 2 (elements). To suppress negative-valued image artifacts due to sparse spatial sampling and limited detection angle, the negative parts in the reconstructed images are set to be zero before evaluating Eq. (8). The problem to be solved in (7) is not concave, so the gradient ascent with momentum algorithm is adopted to avoid local optima and accelerate convergence. The partial derivatives of the similarity function are calculated numerically by
| (9) |
in which is a tiny SOS perturbation.
The feature coupling algorithm is summarized in Algorithm 2 in Appendix.
3. Experiments
3.1 System
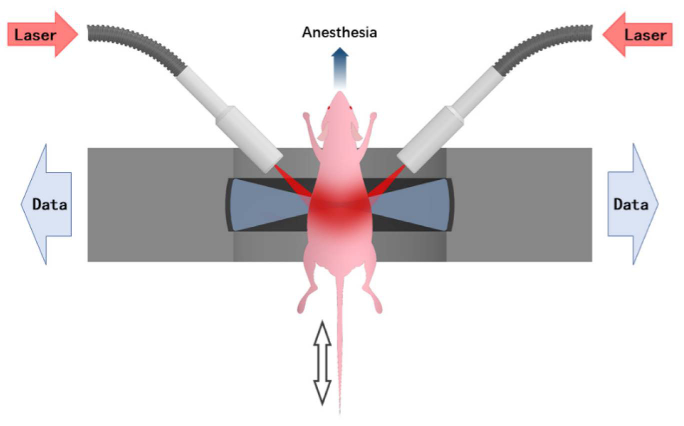
A simplified illustration of our panoramic PAT system is given in Fig. 1. A custom-made 256-element full-ring ultrasound detector array (Imasonic Inc.; 5.5 MHz central frequency; > 60% −6 dB bandwidth) is used for photoacoustic signal detection. As shown in Fig. 1, each element is geometrically focused in the elevational direction to provide sectioning. Two customized 128-channel preamplifier modules (20 dB gain) directly connect to the rear side of the transducer array. The outputs from the preamplifier modules are fed into two 128-channel data acquisition units (Analogic Corp., SonixDAQ; 40 MHz sampling rate; 12-bit ADC; 36-51 dB programmable gain) for A/D conversion. 10 Hz laser pulsing is synchronized with data acquisition. In order to double the spatial sampling density, clamped mechanical rotation is applied to the transducer array, causing the array to rotate back and forth at ± 2π/512 (rad) between adjacent data acquisition. Two successive sinograms acquired at the interleaved positions are then merged to complete a 512-element measurement.
Fig. 1.
System setup.
A 1,064 nm Nd:YAG laser (LOTIS, LS-2145-LT150, 10 Hz pulse repetition rate, 12 ns pulse duration) was employed for most of the experiments. The maximum energy density on the sample (11 mJ/cm2)) was below the American National Standards Institute (ANSI) security limits (100 mJ/cm2 at 1,064 nm, 10 Hz laser pulse repetition rate). As for the multispectral experiment, an optical parametric oscillator (OPO) (SOLAR LP604,680-1,064 nm tuning range, 10 Hz repetition, 10 ns temporal width) was employed. The maximum energy density on the sample (11 mJ/cm2 at 830 nm) was also below the ANSI limits. The light beams were expanded and subsequently coupled into a customized 1-to-10 fiber bundle (Silica fiber, transmission band 500-2,400 nm). The distal ends of the fiber bundle were arranged such that on the imaged object an annular illumination pattern was formed on the focal plane of the transducer array. The system was controlled by a high-precision delay generator (Stanford Research Systems, DG645). A heater with thermostat control was integrated into the system’s water circulation unit to maintain a relatively constant water temperature of around 31°C.
3.2 Experiments and results
3.2.1 Computer simulation
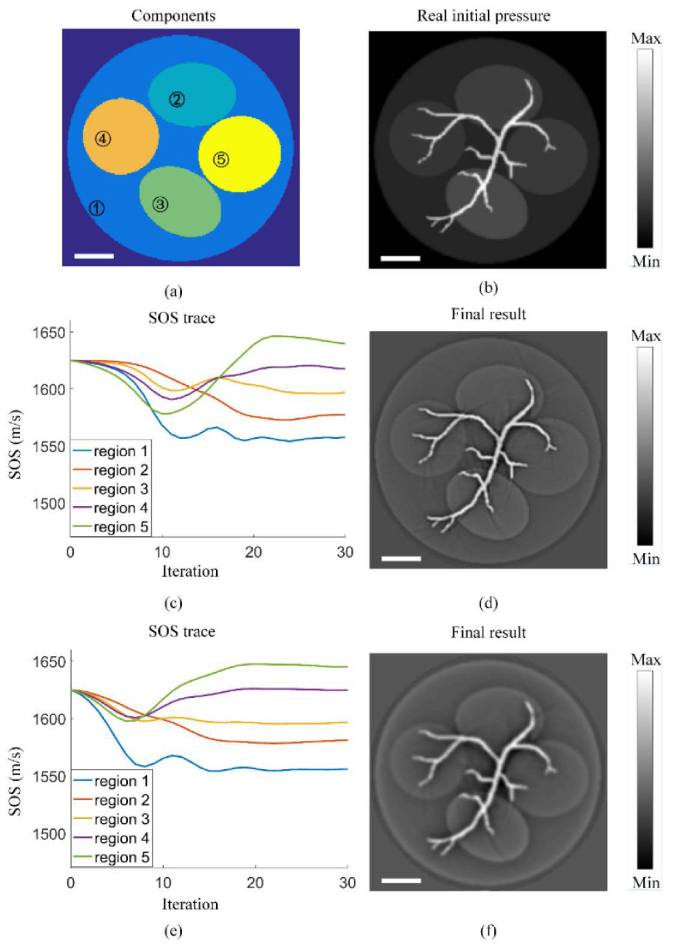
In our computer simulations, we used a 512-element ring array with a radius of 5 cm, resembling the real system. The SOS of water was set to be 1,480 m/s. The target was 2.85 cm in diameter and comprised five components with different SOS values (1,560, 1,580, 1,600, 1,620 and 1,640 m/s, respectively, Fig. 2(a)). Figure 2(b) denotes the ‘gold standard’ initial pressure distribution that we used in the K-wave toolbox [37] to generate the simulated pressure signals. We conducted two numerical experiments: 1. Ideal simulation (Expt. 1). The generated signals were contaminated by white Gaussian noise with a signal-to-noise ratio (SNR) of 40 dB. During the FC process, Eq. (2) was used as the back-projection kernel in AFMM-BP. 2. Partially real simulation (Expt. 2). The electrical impulse response (EIR) of our system was measured (with an absorber whose PA signal bandwidth greatly exceeds our system’s bandwidth). Then the generated pressure signals were convolved with the EIR to better represent real measurements. White Gaussian noise was added, with a SNR of 40 dB. Equation (3) was used as the back-projection kernel in AFMM-BP.
Fig. 2.
Simulation results. (a) Different colors represent regions with different SOS. (b) The real IP distribution (gold standard). (c) SOS evolutions in Expt. 1. (d) The IP image corresponding to the reconstructed SOS distribution in Expt. 1. (e) SOS evolutions in Expt. 2. (f) The IP image corresponding to the reconstructed SOS distribution of Expt. 2. Scale bars: 5 mm.
In the beginning of the iteration, all compartments shown in Fig. 2(a) shared a single SOS value of 1,625 m/s, in both Expts. 1 and 2. As Figs. 2(c) and 2(e) show, the SOS of different components gradually separate and approach the correct values. Figures 2(c) and 2(d) are the results of Expt. 1. The mean relative error of the recovered SOS is as small as 0.13%. In the IP image reconstructed using FC (Fig. 2(d)), all details are well recovered. After the pressure signals are filtered with the EIR (Expt. 2), the mean relative error of the recovered SOS is slightly larger but is still small (0.23%). In the reconstructed IP image (Fig. 2(f)), sharp features are smoothed but the image quality is still satisfactory. To better show the convergence capability of FC, a series of reconstructed IP images corresponding to the SOS distribution at different iteration steps are given in Visualization 1 (224.3KB, mov) .
3.2.2 Phantom studies
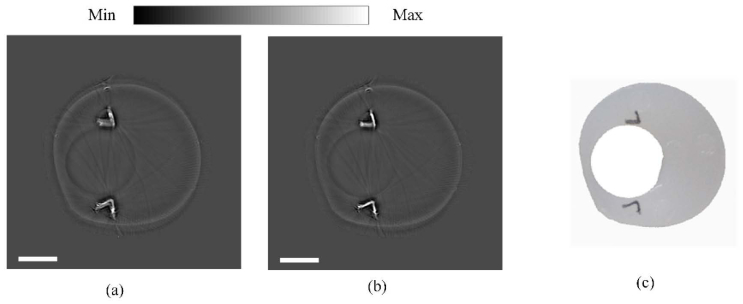
A cylindrical dual-SOS phantom was made (Expt. 3) with agarose gel providing higher SOS than water in an enclosed cylindrical cavity [38] (Fig. 3(c) for the cross-section of the phantom). The India ink was diluted to be 0.625%v/v first. The body of the phantom was made of 5%w/w agar, 0.5%w/w intralipid and 0.85%w/w diluted ink. For the vessel-like PA features, we used 5%w/w agar, 0.5%w/w intralipid and 66%w/w diluted ink. Here, ink and intralipid were used to enhance optical absorption and scattering, respectively. We created a 9 mm-diameter cylindrical cavity in the phantom filled with water, whose SOS was assumed to be unknown. The temperature of the surrounding water was 25.6 ºC, so we calculated the SOS of water to be 1,498.3 m/s [36]. We used this value to infer the SOS of the inner cavity and compare with our reconstruction result. A lab-made phantom holder was used to stably mount the phantom in the system. For PA imaging, we used the 1,064 nm laser with an energy density on the sample of 6 mJ/cm2.
Fig. 3.
The results of the phantom experiment. (a) and (b) are the IP images corresponding to the initial and final SOS distributions, respectively. (c) A photograph of the phantom. Scale bars: 5 mm.
The initial SOS values for the agarose background and the inner cavity (i.e., water) were set to be 1,620 and 1,530 m/s, respectively. These initial values were set for faster convergence. The reconstructed SOS for the agarose background and the inner cavity were 1,596.7 and 1,502.8 m/s, respectively. So the relative error of the water SOS was only 0.3% (as compared with 1,498.3 m/s). Figures 3(a) and 3(b) show the IP images corresponding to the initial and final SOS distributions, respectively. In Fig. 3(a), we can clearly observe feature splitting and artifacts due to an incorrect SOS map. With the SOS corrected, the PA image gets much sharper (Fig. 3(b)) to resemble the real object shown in Fig. 3(c).
3.2.3 In vivo experiments
For all in vivo experiments, mice were maintained under gaseous anesthesia of 1.3% volatile isoflurane. Each mouse was immobilized on a lab-made animal holder upright in the center of the ultrasound detector array. The trunk of the mouse was immersed in distilled water at around 31 °C. Raw data was averaged 131 times to enhance SNR. All animal experiments were conducted in conformity with the regulations of the Laboratory Animal Research Center at Tsinghua University, Beijing, China. Mice could be imaged repeatedly without noticeable adverse conditions due to imaging.
3.2.3.1 Single-wavelength imaging of the mouse trunk
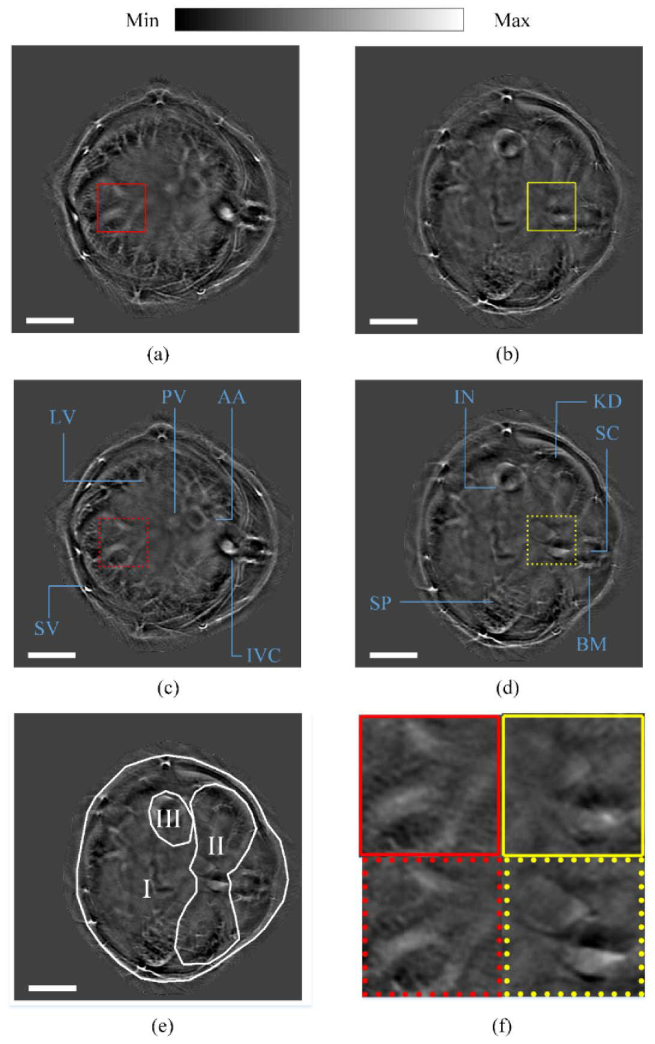
A healthy nude mouse (8-week-old Crl: NU-Foxn 1nu mouse) was scanned from liver to kidney with a step of 0.28 mm (Expt. 4). The excitation light was 1,064 nm. Figure 4 shows the IP images of some representative layers. Figures 4(a) and 4(c) were taken in the liver region, while Figs. 4(b) and 4(d) were taken in the kidney region. In the liver region, because the cross-section was almost entirely occupied by the liver, no segmentation was needed. The initial SOS values for different slices were set to 1,660 m/s. In the kidney region, three SOS values were taken into account (Fig. 4(e)), including kidney, bowel and intermediate tissue. For slices in this region, the initial SOS values for kidney, bowel and intermediate tissue were 1,595, 1,620 and 1,620 m/s, respectively. Artifacts prevalent in the starting IP images vanished at the end of the iterations (Fig. 4(f)). A subset of the imaged cross-sections (layers 4, 6, …, 14 for liver, layers 25, 30, 35 and 40 for kidney) were processed with the proposed FC. The mean and standard deviation (std) of the liver SOS was 1,635.6 and 2.4 m/s, respectively. This indicates that the SOS of the whole liver is quite uniform. The mean and std of the kidney SOS were found to be 1,613.1 and 7.5 m/s, respectively, indicating a diverse distribution. A fly-though movie concatenating all layers is provided in Visualization 2 (635.1KB, mov) . A movie showing feature convergence during the iteration is given in Visualization 3 (235.1KB, mov) .
Fig. 4.
In vivo images of a nude mouse trunk (Expt. 4). (a) and (b) are IP images corresponding to the initial SOS distributions, (c) and (d) are IP images corresponding to the final SOS distributions. (a) and (c) correspond to one of the liver sections, while (b) and (d) correspond to one of the kidney sections. (e) presents the segmentation scheme in getting (d) (I: intermediate tissue, II: kidney, III: bowel). (f) shows zoomed-in views of the subdomains in (a)-(d), labeled by the colors and types of the borderlines. Scale bars: 5 mm. AA, abdominal aorta; BM, backbone muscles; IN, intestines; IVC, inferior vena cava; KD, kidneys; LV, lobes of liver; PV, portal vein; SC: spinal cord; SP, spleen; SV, superficial vessels.
3.2.3.2 Multi-wavelength imaging
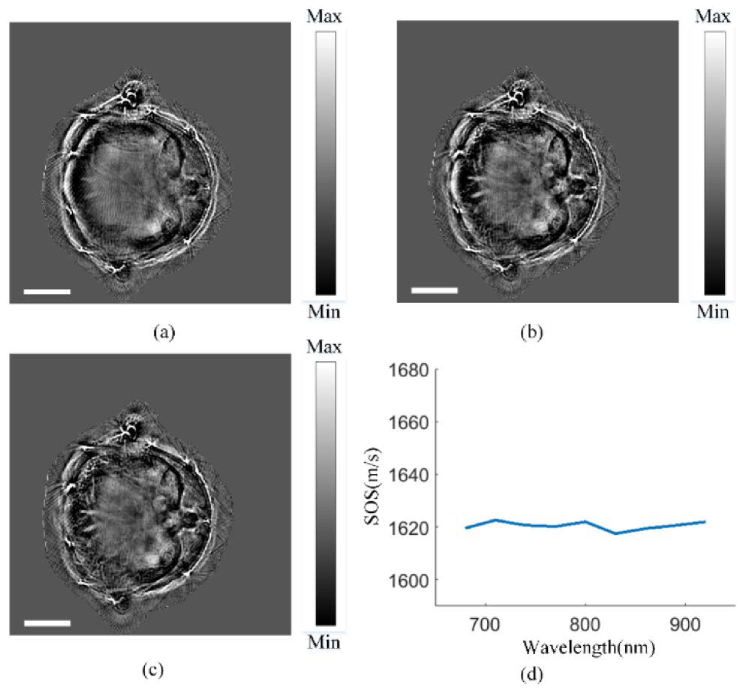
Multi-spectral PA imaging (or, multi-spectral optoacoustic tomography, MSOT) plays an essential role in functional and molecular imaging [1]. The key to multispectral imaging is that objects manifest wavelength-dependent features. Since only the IP image, rather than the SOS distribution, is wavelength dependent, ideally our method should converge to the same SOS distribution regardless of the excitation wavelength. To demonstrate this, laser pulses with different wavelengths were used for liver imaging (Expt. 5). A 8-week-old Crl: NU-Foxn 1nu mouse was used in this particular experiment. The laser wavelengths was tuned from 680 to 920 nm, with a step of 30 nm. When a short wavelength (680 nm) was used, the light attenuated faster towards the center due to higher tissue absorption and scattering. As a result, the inner part of the body appeared vague (Fig. 5(a)). For longer wavelengths, the fluence distribution was more uniform and the inner vasculatures started to appear (Figs. 5(b) and 5(c)). The SOS of the liver was automatically sought by the program at these discrete wavelengths, see Fig. 5(d). Although slightly different, the estimated SOS at various wavelengths were quite consistent, with a mean of 1,620.5 m/s, and a standard deviation of 1.58 m/s. The remarkable consistency of the calculated SOS values at different excitation wavelengths proves that FC works robustly, even if some inner features are missing.
Fig. 5.
Experimental demonstration of FC’s robustness against wavelength-dependent feature variations (Expt. 5). (a-c) In vivo images reconstructed using FC at a fixed axial position in the liver region, acquired at different excitation wavelengths. (a), (b) and (c) correspond to 680, 800 and 920 nm, respectively. Scale bars: 5 mm. (d) The estimated SOS values as a function of excitation wavelengths.
3.2.3.3 Pathological model: liver cancer
Liver cancer is the second leading cause of cancer-related death all over the world. Magnetic resonance (MR) elastography [39] and transient elastography [40] confirm that primary or metastatic liver tumors are stiffer than normal liver parenchyma, which indicates that the SOS may increase in the tumor region. Thus, we postulated that our method would uncover the SOS change on top of the tumor-induced angiogenesis contrast in the IP image (Expt. 6).
To prove the above hypothesis, three Crl: NU-Foxn 1nu mice were orthotopically injected with HepG2 cells at the age of six weeks and then raised for 3 weeks. The excitation light was 1,064 nm. During imaging, six layers through the whole liver were measured for each mouse. Then, all data were processed using FC, and an average liver SOS was calculated for each mouse. The mean SOS were 1,676.9 m/s (std: 4.0 m/s), 1,682.7 m/s (std: 9.6 m/s) and 1,686.0 m/s (std: 6.7 m/s), respectively. Compared to normal liver (Expts. 4 and 5), the average SOS increased by approximately 50 m/s.
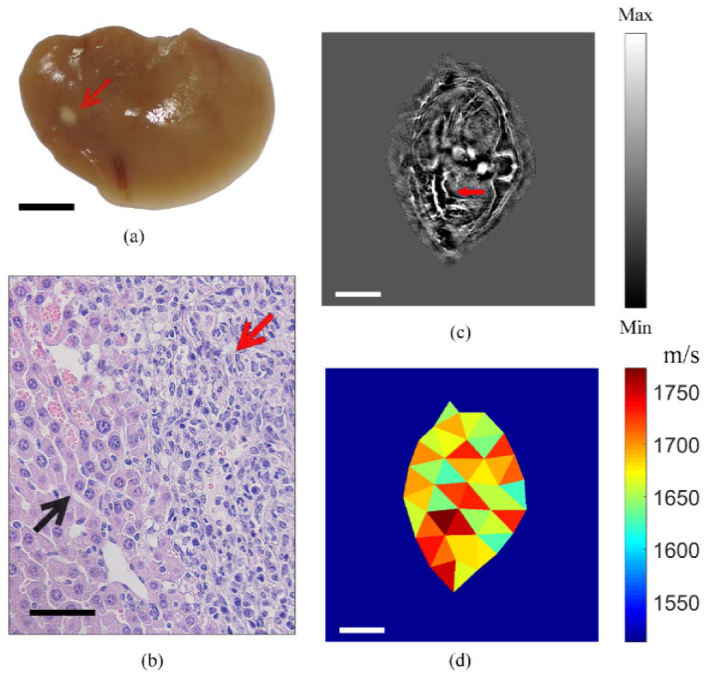
All mice were sacrificed after image acquisition. In one representative dissected liver, the tumor was clearly observed (indicated by the red arrow in Fig. 6(a)). According to the hematoxylin and eosin (H&E) stained histologic specimen, tumor cells underwent excessive proliferation, compared to normal tissue (red and black arrows in Fig. 6(b), respectively). On the in vivo IP image, although we expected to see blood vessels in the neighborhood of the tumor, it could be difficult to delineate the tumor boundary precisely without exogenous contrast agents. To dissociate FC from image-dependent SOS segmentation, we meshed the object into 39 triangles [41]. FC optimization was then performed over the 39 degrees of freedom and converged onto the final IP image shown in Fig. 6(c), with most of the features in sharp focus. The spiral ‘feeding’ vasculature of the tumor could be clearly seen in the figure (red arrow). The corresponding SOS map is shown in Fig. 6(d), with a high SOS region overlapping with the tumor.
Fig. 6.
In vivo PA imaging of an orthotopic mouse model of HepG2. (a) The dissected liver with the tumor. The red arrow points to the tumor. (b) H&E of histological section of (a) showing the tumor boundary. Black and red arrows point to the normal and tumor regions, respectively. (c) Cross-sectional image taken at the liver region of a living mouse carrying the tumor. The IP image was reconstructed after applying an SOS map generated by FC optimization. Red arrow points to a ‘feeding’ vessel of the tumor. (d) The reconstructed SOS distribution corresponding to (c). Scale bars: (a)(c)(d) 5 mm; (b) 40 .
3.2.3.4 Pathological model: hepatic injury
We applied the FC method to imaging of the IP feature and acoustic property changes due to hepatic injury (Expt. 7). In this experiment, six-week-old BALB/cAnNCrl mice were used. Subcutaneous injection with CCl4 and olive oil solution (20% volume fraction, bolus dose 0.1 mL/10g body weight) was carried out every 3 days for totally 10 weeks. In the last 3 weeks, intragastric infusion of ethanol (15%v/v) was performed. Before in vivo imaging, the hair of the trunk was removed, followed by an 8-hour abrosia with only water supplied, in order to reduce the strong PA signals from digested food.
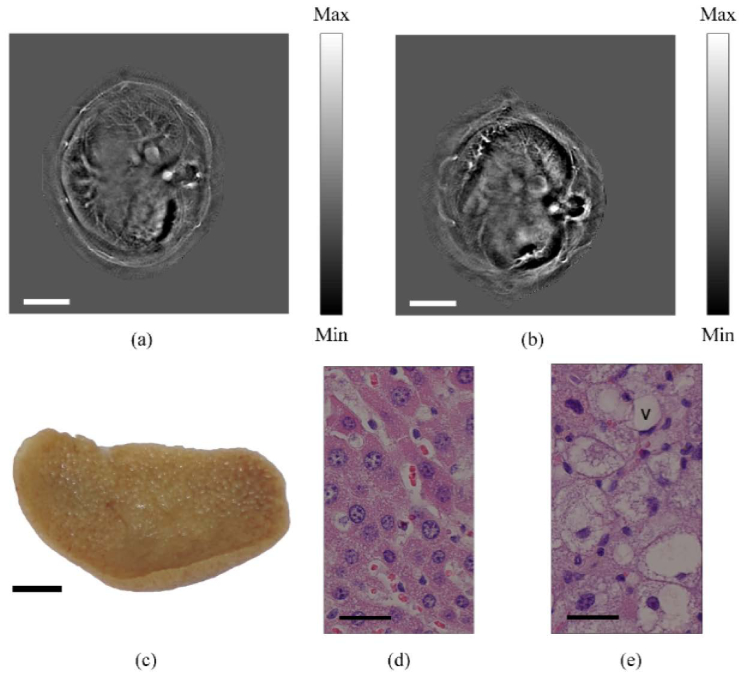
Alcohol and its metabolites can induce hepatocyte injury via mitochondrial damage and endoplasmic reticulum stress, inhibit fatty acid oxidation, but favor fatty acid and triglyceride synthesis. The alcoholic liver diseases (ALDs) include steatosis, alcoholic fibrosis, and cirrhosis. Toxicosis gives rise to ballooning degeneration of hepatocytes. As can be seen in the H&E staining section (Fig. 7(e)), excess lipid droplets accumulated in vesicles. Because the SOS of fat is low (1,350 m/s) [10], the mean SOS of liver tends to decrease.
Fig. 7.
In vivo PA imaging of hepatic injury. The reconstructed images of normal liver (a) and liver with hepatic injury (b) of BALB/cAnNCrl mice. The SOS maps used in these reconstructions were generated by FC optimization. (c) Photography showing the dissected liver with hepatic injury. (d) H&E stained specimen of a healthy liver. (e) H&E stained specimen of a liver with hepatic injury. V: vacuole. Scale bars: (a)(b)(c) 5 mm. (d)(e) 20 .
The excitation light was 1,064 nm. More than 3 layers of the liver were measured for each mouse. The mean SOS measured for two normal mice were 1,668.5 m/s (std: 8.7 m/s) and 1,663.9 m/s (std: 2.0 m/s), respectively. Four mice with hepatic injury had lower SOS of 1,642.6 m/s (std: 0.6 m/s), 1,635.9 m/s (std: 4.8 m/s), 1,641.4 m/s (std: 1.7 m/s) and 1,633.5 m/s (std: 5.2 m/s), respectively.
Numerous hepatic nodules appeared in the dissected liver with injury (Fig. 7(c)). The lobular architectures separated distinctly, so the IP features of the hepatic mouse liver shown in Fig. 7 (b) were different from those of a health mouse shown in Fig. 7(a). Our hypothesis about the SOS change was confirmed by histologic specimens stained with H&E (Figs. 7(d) and 7(e)). Compared to normal tissues (Fig. 7(d)), there were many vacuoles in the injured liver (Fig. 7(e)), which contained lipid droplets and reduced the mean SOS of the whole liver.
4. Discussion and conclusion
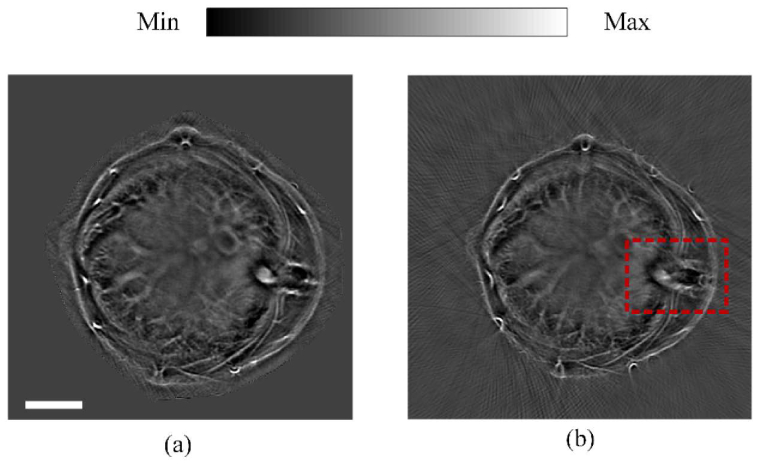
FC has high quantitative accuracy for multi-SOS problems in numerical experiments (Expts. 1 and 2). For both phantom and in vivo experiments, FC can converge to visually correct results and mitigate image distortion and blurring. Figure 8 shows the final IP images using the liver data in Expt. 4, to compare the performance of FC (Fig. 8(a)) and the popular half-time back projection (Fig. 8(b)) [23]. The inferior vena cava and spinal cord have obvious distortion and splitting artefacts (highlighted in red box). However, relatively large computation burden is one of the limitations of FC. For FC, time cost for iteratively searching for the SOS map is 2403 s (with an element interval of eight), and the time for generating the final IP image using the full-ring elements (512 elements) is 313 s, while half-time back projection only takes 7 s (Intel(R) Core(TM) i7-7700 CPU @ 3.6 GHz). In the future, GPU acceleration will be needed.
Fig. 8.
The comparison of results of FC and half-time back projection, using the liver data of Expt. 4. (a) The final IP result of FC. (b) The IP result using half-time back projection. Red box highlights the part that has splitting artefacts. Scale bar: 5 mm.
Although deep vessels could not be clearly imaged with short wavelengths using our current imager, FC still showed good consistency for SOS estimation among different wavelengths (Expt. 5). The significant increase of the SOS for liver tumors (Expt. 6) can be measured with FC, indicating that FC not only produces better PA images, but also indicates the elastic property changes of solid tumors to enrich image contrast for cancer studies. Moreover, the successful application of triangular mesh proves that the implementation of FC is not restricted to image segmentation. If features are plenty in the initial IP reconstruction, blind meshing followed by FC reconstruction could be used to automatically identify the tumor region. The relevance of the FC method for pathological study was further verified by capturing the SOS drop in mouse livers with hepatic injury, and was shown to agree with the fact that the increased vacuoles and lipid droplets reduced the SOS of liver (Expt. 7).
To best implement FC reconstruction, the determination of the initial value for the iteration is a key, especially for the multi-SOS problem. If the initial value is too far from the optimum point, more iterations are needed. Moreover, the optimization problem for FC is not concave, so it may fall into suboptimal solutions. To guarantee the robustness and accuracy of the algorithm, the imaged object should contain features with high contrast, such as vessels and probes that have strong PA emissions. Another problem we encountered was that large structures, such as big vessels and the spleen, exhibited distinct features when reconstructed using the two respective half rings. For example, the part facing the half ring may appear bright, and cast small-valued or even negative ‘shadows’ away from the detector. The above polarity is inverted when reconstructed using the complementary half ring. The altered features dramatically reduce the sensitivity of our similarity-based method in finding the optimal SOS values. We are still working on this problem to improve the reliability of the method. Moreover, small target size and low image resolution can affect sound speed reconstruction. One last problem is that the blind segmentation shown in Fig. 6(d) is computationally demanding due to the large degrees of freedom. In addition, while it works fine to yield a sharp image, the SOS distribution may look ‘jumpy’ if no further regulation is applied (such as smoothness). We are still working on developing regulation techniques, or smarter fitting strategies, to make such blindly segmented SOS estimation more reliable.
Our method was demonstrated on a full-ring PACT system, but the basic concept of FC is rather generic and can be implemented on any detection geometry with moderate modification. The way we divided the array (into two adjacent half rings) is effective and simple for our system, but other division schemes may show improved efficiency and accuracy for other detection geometries. If the detection surface is divided into more than two sub-regions, image quality might be further improved, but how to evaluate the similarity of multiple images is one key problem. In sum, we envision that the FC concept has broader impacts in various PACT systems, in imaging applications where both the IP and SOS contrasts are of interest, and even in similar tomographic problems beyond photoacoustics.
Appendix
Algorithm 1 Accelerated fast marching method
Set parameters
Build the coarse mesh and the fine mesh, with corresponding pixel sizes and ranges set. Set the TOF threshold . Set the input of SOS map sensor position , reconstruction domain and the SOS of water .
Run AFMM
-
1.
Initially, pixels closer to the sensor than those in can be tagged as accepted, and their TOF can be calculated as , in which means the distance from r to .
-
2.
On the coarse grid, find the outer boundary of the accepted domain.
-
3.
Update their arrival times by solving (4).
-
4.
The pixel points in the outer boundary with , in which is the minimum TOF of the outer boundary, are tagged as accepted.
-
5.
If points of are all accepted, go to step 6; or otherwise, go back to step 2.
-
6.
Obtain the TOF of fine grid through interpolation.
Algorithm 2 Feature coupling
Set parameters
Set the upper limit of the iteration number , an initial guess of the SOS vector ,the iteration step , the momentum coefficient and the SOS perturbation to numerically evaluate the gradients. Also, set the starting element to divide the ring array into two parts, and the sampling interval Ninter. Set the initial iteration number k=1.
Run FC
Funding
National Natural Science Foundation of China (61735016 and 61871251); Youth Innovation Fund of Beijing National Research Center for Information Science and Technology.
Disclosures
The authors declare that there are no conflicts of interest related to this article.
References
- 1.Razansky D., Distel M., Vinegoni C., Ma R., Perrimon N., Köster R. W., Ntziachristos V., “Multispectral opto-acoustic tomography of deep-seated fluorescent proteins in vivo,” Nat. Photonics 3(7), 412–417 (2009). 10.1038/nphoton.2009.98 [DOI] [Google Scholar]
- 2.Yao J., Maslov K. I., Zhang Y., Xia Y., Wang L. V., “Label-free oxygen-metabolic photoacoustic microscopy in vivo,” J. Biomed. Opt. 16(7), 076003 (2011). 10.1117/1.3594786 [DOI] [PMC free article] [PubMed] [Google Scholar]
- 3.Filonov G. S., Krumholz A., Xia J., Yao J., Wang L. V., Verkhusha V. V., “Deep-tissue photoacoustic tomography of a genetically encoded near-infrared fluorescent probe,” Angew. Chem. Int. Ed. Engl. 51(6), 1448–1451 (2012). 10.1002/anie.201107026 [DOI] [PMC free article] [PubMed] [Google Scholar]
- 4.Cai C., Deng K., Ma C., Luo J., “End-to-end deep neural network for optical inversion in quantitative photoacoustic imaging,” Opt. Lett. 43(12), 2752–2755 (2018). 10.1364/OL.43.002752 [DOI] [PubMed] [Google Scholar]
- 5.Wang L. V., Hu S., “Photoacoustic tomography: in vivo imaging from organelles to organs,” Science 335(6075), 1458–1462 (2012). 10.1126/science.1216210 [DOI] [PMC free article] [PubMed] [Google Scholar]
- 6.Xu Y., Wang L. V., Ambartsoumian G., Kuchment P., “Reconstructions in limited-view thermoacoustic tomography,” Med. Phys. 31(4), 724–733 (2004). 10.1118/1.1644531 [DOI] [PubMed] [Google Scholar]
- 7.Deán-Ben X. L., Ntziachristos V., Razansky D., “Artefact reduction in optoacoustic tomographic imaging by estimating the distribution of acoustic scatterers,” J. Biomed. Opt. 17(11), 110504 (2012). 10.1117/1.JBO.17.11.110504 [DOI] [PubMed] [Google Scholar]
- 8.Singh M. K. A., Steenbergen W., “Photoacoustic-guided focused ultrasound (PAFUSion) for identifying reflection artifacts in photoacoustic imaging,” Photoacoustics 3(4), 123–131 (2015). 10.1016/j.pacs.2015.09.001 [DOI] [PMC free article] [PubMed] [Google Scholar]
- 9.Fehm T. F., Deán-Ben X. L., Razansky D., “Four dimensional hybrid ultrasound and optoacoustic imaging via passive element optical excitation in a hand-held probe,” Appl. Phys. Lett. 105(17), 173505 (2014). 10.1063/1.4900520 [DOI] [Google Scholar]
- 10.Bamber J. C., “Acoustical characteristics of biological media,” Encyclopedia of Acoustics 4, 1703–1726 (1997). [Google Scholar]
- 11.Willemink R. G., Manohar S., Purwar Y., Slump C. H., van der Heijden F., van Leeuwen T. G., “Imaging of acoustic attenuation and speed of sound maps using photoacoustic measurements,” Proc. SPIE 6920, 692013 (2008). 10.1117/12.770061 [DOI] [Google Scholar]
- 12.Manohar S., Willemink R. G., van der Heijden F., Slump C. H., van Leeuwen T. G., “Concomitant speed-of-sound tomography in photoacoustic imaging,” Appl. Phys. Lett. 91(13), 131911 (2007). 10.1063/1.2789689 [DOI] [Google Scholar]
- 13.Xia J., Huang C., Maslov K., Anastasio M. A., Wang L. V., “Enhancement of photoacoustic tomography by ultrasonic computed tomography based on optical excitation of elements of a full-ring transducer array,” Opt. Lett. 38(16), 3140–3143 (2013). 10.1364/OL.38.003140 [DOI] [PMC free article] [PubMed] [Google Scholar]
- 14.Resink S., Jose J., Willemink R. G., Slump C. H., Steenbergen W., van Leeuwen T. G., Manohar S., “Multiple passive element enriched photoacoustic computed tomography,” Opt. Lett. 36(15), 2809–2811 (2011). 10.1364/OL.36.002809 [DOI] [PubMed] [Google Scholar]
- 15.Jose J., Willemink R. G., Resink S., Piras D., van Hespen J. C., Slump C. H., Steenbergen W., van Leeuwen T. G., Manohar S., “Passive element enriched photoacoustic computed tomography (PER PACT) for simultaneous imaging of acoustic propagation properties and light absorption,” Opt. Express 19(3), 2093–2104 (2011). 10.1364/OE.19.002093 [DOI] [PubMed] [Google Scholar]
- 16.Merčep E., Herraiz J. L., Deán-Ben X. L., Razansky D., “Transmission-reflection optoacoustic ultrasound (TROPUS) computed tomography of small animals,” Light Sci. Appl. 8(1), 18 (2019). 10.1038/s41377-019-0130-5 [DOI] [PMC free article] [PubMed] [Google Scholar]
- 17.Jiang H., Yuan Z., Gu X., “Spatially varying optical and acoustic property reconstruction using finite-element-based photoacoustic tomography,” J. Opt. Soc. Am. A 23(4), 878–888 (2006). 10.1364/JOSAA.23.000878 [DOI] [PubMed] [Google Scholar]
- 18.Yuan Z., Jiang H., “Three-dimensional finite-element-based photoacoustic tomography: reconstruction algorithm and simulations,” Med. Phys. 34(2), 538–546 (2007). 10.1118/1.2409234 [DOI] [PubMed] [Google Scholar]
- 19.Ding T., Ren K., Vallélian S., “A one-step reconstruction algorithm for quantitative photoacoustic imaging,” Inverse Probl. 31(9), 095005 (2015). 10.1088/0266-5611/31/9/095005 [DOI] [Google Scholar]
- 20.Zhang J., Wang K., Yang Y., Anastasio M. A., “Simultaneous reconstruction of speed-of-sound and optical absorption properties in photoacoustic tomography via a time-domain iterative algorithm,” Proc. SPIE 6856, 68561F (2008). 10.1117/12.764171 [DOI] [Google Scholar]
- 21.Huang C., Wang K., Schoonover R. W., Wang L. V., Anastasio M. A., “Joint reconstruction of absorbed optical energy density and sound speed distributions in photoacoustic computed tomography: a numerical investigation,” IEEE Trans. Comput. Imaging 2(2), 136–149 (2016). 10.1109/TCI.2016.2523427 [DOI] [PMC free article] [PubMed] [Google Scholar]
- 22.Stefanov P., Uhlmann G., “Instability of the linearized problem in multiwave tomography of recovery both the source and the speed,” arXiv:1211.6217 (2012).
- 23.Anastasio M. A., Zhang J., Pan X., Zou Y., Ku G., Wang L. V., “Half-time image reconstruction in thermoacoustic tomography,” IEEE Trans. Med. Imaging 24(2), 199–210 (2005). 10.1109/TMI.2004.839682 [DOI] [PubMed] [Google Scholar]
- 24.Anastasio M. A., Zhang J., Sidky E. Y., Zou Y., Xia D., Pan X., “Feasibility of half-data image reconstruction in 3-D reflectivity tomography with a spherical aperture,” IEEE Trans. Med. Imaging 24(9), 1100–1112 (2005). 10.1109/TMI.2005.852055 [DOI] [PubMed] [Google Scholar]
- 25.Poudel J., Matthews T. P., Li L., Anastasio M. A., Wang L. V., “Mitigation of artifacts due to isolated acoustic heterogeneities in photoacoustic computed tomography using a variable data truncation-based reconstruction method,” J. Biomed. Opt. 22(4), 041018 (2017). 10.1117/1.JBO.22.4.041018 [DOI] [PMC free article] [PubMed] [Google Scholar]
- 26.Zhang C., Wang Y., “A reconstruction algorithm for thermoacoustic tomography with compensation for acoustic speed heterogeneity,” Phys. Med. Biol. 53(18), 4971–4982 (2008). 10.1088/0031-9155/53/18/008 [DOI] [PubMed] [Google Scholar]
- 27.Treeby B. E., Varslot T. K., Zhang E. Z., Laufer J. G., Beard P. C., “Automatic sound speed selection in photoacoustic image reconstruction using an autofocus approach,” J. Biomed. Opt. 16(9), 090501 (2011). 10.1117/1.3619139 [DOI] [PubMed] [Google Scholar]
- 28.Mandal S., Nasonova E., Deán-Ben X. L., Razansky D., “Optimal self-calibration of tomographic reconstruction parameters in whole-body small animal optoacoustic imaging,” Photoacoustics 2(3), 128–136 (2014). 10.1016/j.pacs.2014.09.002 [DOI] [PMC free article] [PubMed] [Google Scholar]
- 29.Zhang J., Anastasio M. A., “Reconstruction of speed-of-sound and electromagnetic absorption distributions in photoacoustic tomography,” Proc. SPIE 6086, 608619 (2006). 10.1117/12.647665 [DOI] [Google Scholar]
- 30.Li L., Zhu L., Ma C., Lin L., Yao J., Wang L., Maslov K., Zhang R., Chen W., Shi J., Wang L. V., “Single-impulse panoramic photoacoustic computed tomography of small-animal whole-body dynamics at high spatiotemporal resolution,” Nat. Biomed. Eng. 1(5), 0071 (2017). 10.1038/s41551-017-0071 [DOI] [PMC free article] [PubMed] [Google Scholar]
- 31.Lin L., Hu P., Shi J., Appleton C. M., Maslov K., Li L., Zhang R., Wang L. V., “Single-breath-hold photoacoustic computed tomography of the breast,” Nat. Commun. 9(1), 2352 (2018). 10.1038/s41467-018-04576-z [DOI] [PMC free article] [PubMed] [Google Scholar]
- 32.Xu M., Wang L. V., “Universal back-projection algorithm for photoacoustic computed tomography,” Phys. Rev. E Stat. Nonlin. Soft Matter Phys. 71(1), 016706 (2005). 10.1103/PhysRevE.71.016706 [DOI] [PubMed] [Google Scholar]
- 33.Pramanik M., “Improving tangential resolution with a modified delay-and-sum reconstruction algorithm in photoacoustic and thermoacoustic tomography,” J. Opt. Soc. Am. A 31(3), 621–627 (2014). 10.1364/JOSAA.31.000621 [DOI] [PubMed] [Google Scholar]
- 34.Hassouna M. S., Farag A. A., “Multi-stencils fast marching methods: a highly accurate solution to the eikonal equation on cartesian domains,” IEEE Trans. Pattern Anal. Mach. Intell. 29(9), 1563–1574 (2007). 10.1109/TPAMI.2007.1154 [DOI] [PubMed] [Google Scholar]
- 35.Jose J., Willemink R. G., Steenbergen W., Slump C. H., van Leeuwen T. G., Manohar S., “Speed-of-sound compensated photoacoustic tomography for accurate imaging,” Med. Phys. 39(12), 7262–7271 (2012). 10.1118/1.4764911 [DOI] [PubMed] [Google Scholar]
- 36.Marczak W., “Water as a standard in the measurements of speed of sound in liquids,” J. Acoust. Soc. Am. 102(5), 2776–2779 (1997). 10.1121/1.420332 [DOI] [Google Scholar]
- 37.Treeby B. E., Cox B. T., “k-Wave: MATLAB toolbox for the simulation and reconstruction of photoacoustic wave fields,” J. Biomed. Opt. 15(2), 021314 (2010). 10.1117/1.3360308 [DOI] [PubMed] [Google Scholar]
- 38.Gu M. D., “Investigating a Relationship Between Speed of Sound and Hydrogel Water Content via Ultrasound for Future Articular Cartilage Applications,” thesis, Case Western Reserve University; (2013). [Google Scholar]
- 39.Venkatesh S. K., Yin M., Glockner J. F., Takahashi N., Araoz P. A., Talwalkar J. A., Ehman R. L., “MR elastography of liver tumors: preliminary results,” AJR Am. J. Roentgenol. 190(6), 1534–1540 (2008). 10.2214/AJR.07.3123 [DOI] [PMC free article] [PubMed] [Google Scholar]
- 40.Masuzaki R., Tateishi R., Yoshida H., Sato T., Ohki T., Goto T., Yoshida H., Sato S., Sugioka Y., Ikeda H., Shiina S., Kawabe T., Omata M., “Assessing liver tumor stiffness by transient elastography,” Hepatol. Int. 1(3), 394–397 (2007). 10.1007/s12072-007-9012-7 [DOI] [PMC free article] [PubMed] [Google Scholar]
- 41.Persson P. O., Strang G., “A simple mesh generator in MATLAB,” SIAM Rev. 46(2), 329–345 (2004). 10.1137/S0036144503429121 [DOI] [Google Scholar]


