Abstract
We developed a compact, hand-held hyperspectral imaging system for 2D neural network-based visualization of skin chromophores and blood oxygenation. State-of-the-art micro-optic multichannel matrix sensor combined with the tunable Fabry-Perot micro interferometer enables a portable diagnostic device sensitive to the changes of the oxygen saturation as well as the variations of blood volume fraction of human skin. Generalized object-oriented Monte Carlo model is used extensively for the training of an artificial neural network utilized for the hyperspectral image processing. In addition, the results are verified and validated via actual experiments with tissue phantoms and human skin in vivo. The proposed approach enables a tool combining both the speed of an artificial neural network processing and the accuracy and flexibility of advanced Monte Carlo modeling. Finally, the results of the feasibility studies and the experimental tests on biotissue phantoms and healthy volunteers are presented.
1. Introduction
Biomedical application of hyperspectral imaging [1] is nowadays an intensively developing area of the research supported by the recent technical progress in the instrument development and significant cost reduction. Potential applications of the considered technique are of high social impact and include monitoring and diagnostics of diabetic ulcer formation [2,3], rheumatic complications [4,5], wound healing control [6,7], diagnosis of melanoma [8,9] and other malignancies [10], support of surgical and treatment procedures [11,12] and others. Moreover, the development of portable and low-cost imaging systems [13–15] demonstrates strong potential for implementation of hyperspectral imaging technology in our everyday life and the day-to-day practice of clinicians.
Spectral images of skin and other biotissues contain information about the spatial distributions and concentrations of biological chromophores [16,17] such as oxy- and deoxyhemoglobin, melanin, bilirubin, etc. The methods of in vivo assessment and mapping of main skin chromophores and estimation of blood oxygen saturation have a long history [18]. Conventional approach usually utilizes 2–4 wavelengths in the visible and near-infrared ranges or RGB color sensors [19,20]. Multispectral measurements typically involve 4 to ∼10 wavelengths providing more consistent data for the analysis, while hyperspectral imaging devices are capable of measuring at up to hundreds of spectral bands.
Basic physiological skin parameters such as blood volume fraction, blood oxygenation and melanin content are usually retrieved by fitting the measured intensity spectrum data with an analytical or numerical model of skin diffuse reflectance. Unfortunately, analytic expressions for biotissue reflectance are known only for a limited amount of simplified geometries and boundary conditions such as, for instance, semi-infinite or two-layer medium. In particular, Yudovsky et al. [21] proposed an analytical expression for the diffuse reflectance of semi-infinite homogeneous and two-layer absorbing and anisotropically scattering media based on the modified two-flux Kubelka-Munk approximation.
The diffusion model is also a frequently used approximation for description of radiative transport in biotissues. Corresponding analytical solution for two-layer media was reported by Kienle et al. in [22] and later generalized for -layer medium [23]. Application of the diffusion model for processing the hyperspectral skin images was also demonstrated in [24]. However, the diffusion model is known to have certain significant limitations [25] in an accurate description of radiative transport in low scattering or highly anisotropic media as well as at short source-detector distances and near the surface regions where the diffusion scattering regime is not yet established.
The Monte Carlo (MC) method is considered as a ’gold standard’ for modeling light transport in a turbid tissue-like scattering medium [26] enabling accounting realistic biotissue geometry and complex boundary conditions. Practical realization of this computational approach is often limited by the required computer facilities. Since recently, the progress in computer technologies and parallel computing, including GPU-accelerated counting enable one to perform enormously extensive computational modeling in a reasonable time [27,28]. The subsequent use of machine learning technologies such as Artificial Neural Networks (ANN) naturally allows utilizing the versatility and flexibility of the MC approach for real-time hyperspectral data processing. Indeed, all the time-consuming calculations are performed in advance and the generated numerical solutions could be used as a training dataset for the supervised machine learning.
The aim of the present study is to implement in practice an ANN-based approach to hyperspectral imaging for quantitative diagnostics and characterization of human skin, including 2D mapping of skin chromophores (hemoglobin, melanin, etc.), mapping of blood oxygenation kinetics and evaluation of skin perfusion. To the best of our knowledge, the current work is the first one that applies MC-trained ANN for processing the hyperspectral data of skin functional tests and verifies the proposed approach through the phantom measurements.
2. Methods and materials
2.1 Hyperspectral imaging system
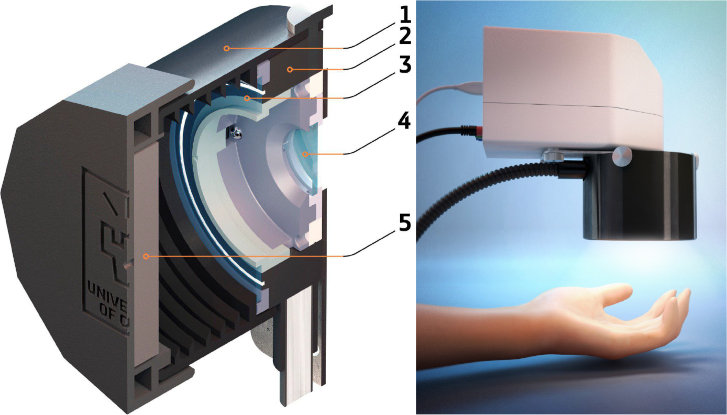
A compact hand-held imaging system was constructed on the basis of the hyperspectral snapshot camera (Senop Optronics, Finland) utilizing a micro Fabry-Perot tunable filter providing spectral resolution of 6–10 nm within the total range of 500–900 nm. The schematic layout of the constructed device is presented in Fig. 1. A broadband illumination unit utilizing 50W halogen lamp is based on the fiber-optic ring illuminator (Edmund Optics, USA) providing uniform distribution of light intensity in the camera focal plane with the average irradiance of 4.3±0.5 mW/cm2 in the camera field of view on the skin surface. The use of the ring illuminator made it possible to combine the axes of illumination and detection. The illumination ring and the camera are equipped with the rotatable broadband linear polarizers fixed at the crossed position for the reduction of specular reflection from the measured object. The 3D model of the unit was implemented using CAD software and printed out with a 3D material printer. The considered measurement approach allows capturing the reflected signal of the entire field of view at a certain waveband. The scanning is performed in spectral domain. Generally, the constructed device is capable of recording spatially and spectrally resolved reflectance used for further ANN analysis. Thus, the diffuse reflectance of skin/biotissue phantom was recorded with the spectral step of 5 nm from the area of 8×8 cm2 at 1010×1010 pixels resolution of CMOS sensor. Normalized spatially-resolved tissue reflectance was calculated as a pointwise ratio of dark-noise-corrected light intensity reflected from the skin/phantom and that reflected from the diffuse reflectance standard. A hypercube from the reflectance standard was recorded every time before the measurement of an object. Gray Spectralon (50% reflection, Labsphere, Inc., USA) was used as a calibration standard. Use of gray standard allows one to avoid the oversaturation of CMOS sensor matrix possible for white reflectance standard (100% reflection) at the fixed integration time.
Fig. 1.
Schematic design of the developed prototype of hyperspectral imaging system: 1 – lens hood (spacer), 2 – fiber ring illuminator delivering the broadband radiation from 50W halogen lamp, 3 – ring-shaped polarizer of illumination unit, 4 – camera polarizer; 5 – built-in diffuse reflectance standard (grey Spectralon – 50% reflection).
2.2 Biotissue phantom
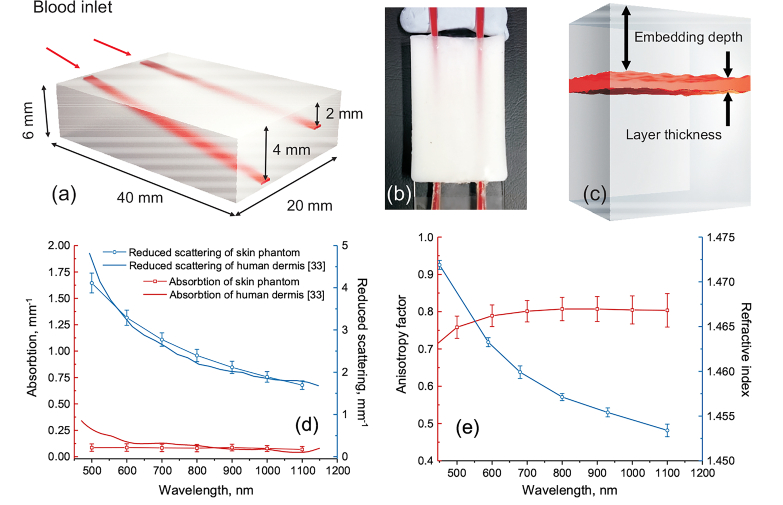
A solid biotissue phantom with predefined optical properties equal to those of human bloodless dermis was used to validate the abilities of the proposed approach to measure blood oxygen saturation in the embedded vessels. The layout and the dimensions of the developed phantom are shown in Fig. 2(a,b). The phantom contains two tilted plain hollow channels (0.25×1 mm2 cross-section) located at the different angles inside the phantom. The embedding depth linearly increases from 0.3 to 2 mm for superficial channel and from 0.3 to 4 mm for the deep one. The detailed description of the manufacturing and characterization of biotissue phantoms is given in [29–31]. In short, polyvinyl chloride (PVC)-based matrix was used as a transparent host for ZnO nanoparticles introducing scattering. The proper amount of added scattering particles was estimated on the basis of Mie theory taking into account their size distribution. The average diameter of the particles was m. To control the absorption coefficient of the phantom, a black plastic color composed of CI Pigment Black 7 was added. Two glass capillaries were installed at different angles as described above inside the phantom mold prior to the phantom solidification. After the solidification, the capillaries were gently removed thus forming the hollow channels. The channels were further connected via the micropipette tips and plastic tubing to the syringe pump.
Fig. 2.
3D schematics of the biotissue phantom with the embedded blood vessels (a); photograph (top view) of the manufactured phantom with the channels filled with fully oxygenated blood (b); three-layer tissue phantom model used for calculations of diffuse reflectance spectra (c); measured optical properties of the biotissue phantom (d,e).
A suspension of washed human red blood cells (RBC) (45% v/v) obtained from a healthy donor was pumped through the channels with the rate of 10 ml/h to avoid the sedimentation process. The used RBC suspension was prepared according to the following procedure. First, a whole blood (hematocrit 45%) from a healthy donor was drawn by venipuncture and put into an ethylenediaminetetraacetic acid (EDTA)-covered tubes to prevent coagulation. Written consent was obtained from the volunteer. The studies were conducted in accordance with the obtained ethical permission from the Finnish Red Cross. Secondly, to prevent uncontrolled aggregation the RBC were washed in phosphate buffered saline (PBS, pH 7.4). For that purpose the whole blood was centrifuged at 3000 g for 10 min, and plasma supernatant was replaced with PBS. This procedure was repeated three times to remove residual plasma containing the proteins inducing the uncontrolled aggregation. Finally, washed RBC mass was suspended in PBS to the initial value of hematocrit. All the measurements were conducted at room temperature of C.
Optical properties of the fabricated phantom including absorption and scattering coefficients as well as the anisotropy factor in the visible and near-infrared spectral region were derived on the basis of the inverse adding-doubling method from the diffuse reflectance, diffuse transmittance and collimated transmittance measured with the spectrophotometer (Gooch & Housego, USA) equipped with the integrating spheres [30,32]. Additionally, the refractive index of the phantom was measured using the multiwavelength Abbe refractometer (Atago, Japan). The results of the characterization of the phantom optical properties are presented in Fig. 2(d, e). Figure 2(d) also shows the comparison of the retrieved absorption and reduced scattering coefficients of the created phantom with those measured from the human ex vivo dermis. The data for human dermis are taken from [33]. The measurements for the reduced scattering (see Fig. 2(d)) are in a good agreement for the whole spectral range 500–1100 nm. For the absorption coefficient, good agreement is observed for the spectral range ∼650–1100 nm. The measured scattering anisotropy factor (Fig. 2(e)) is on the level of 0.8 for the considered range that is also typical for the biotissues including skin [34,35]. Thus, the developed phantom can be considered as a relevant model of human bloodless dermis/skin for red and infrared spectral range.
Before the measurements, the prepared RBC suspension was carefully stirred on the air to increase its oxygen saturation up to 100%. To confirm the oxygen level, 0.5 mL of the suspension was placed into a sealed 1-mm-thick plain glass cuvette and the optical properties of the suspension for the spectral range of 600–1000 nm were estimated on the basis of the spectrophotometric measurements and the inverse adding-doubling procedure similarly as described above. Good agreement of the obtained absorption spectrum with the absorption of oxygenated blood (hematocrit 45 %) [36] confirms the predetermined oxygen saturation level.
2.3 Human skin model
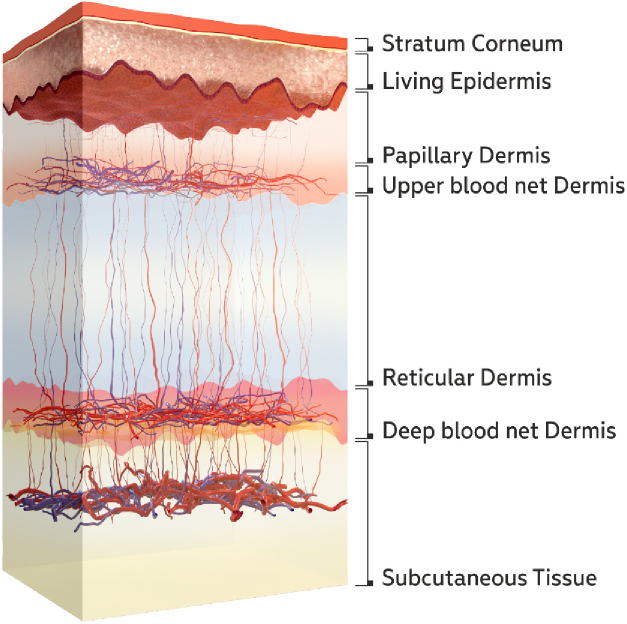
A seven-layer model of skin (Fig. 3) was used to calculate the diffuse reflectance spectra. The utilized model accounts for the in-depth distribution of blood in the dermis that is missing in basic two-layer models considering dermal blood distribution as uniform. The account of the dermal blood distribution is essential due to the dependence of the light penetration depth on its wavelength (see e.g. [37]). Thus, nonuniform blood distribution in the dermis will have an effect on the shape of the reflectance spectrum. The basics of the considered model have been previously described in [38,39] and a brief summary is given below. The main parameters of the model are presented in Table 1. The absorption coefficient of each layer takes into account the blood volume fraction in various vascular beds, oxygen saturation , water content and melanin fraction [38]:
| (1) |
| (2) |
| (3) |
Here, is the absorption coefficient of melanin, is the absorption coefficient of water-free tissues, is the absorption coefficient of water, and are the absorption coefficients of oxygenated and deoxygenated blood, respectively, for the hematocrit = 45%. The scattering coefficients of the layers are approximated based on the combination of Mie and Rayleigh scattering [35,38]:
| (4) |
| (5) |
Fig. 3.
Skin tissue layers taken into account in the used seven-layer model
Table 1. Parameters used for assessment of the absorption coefficients of the skin layers.
| Layer | Thickness, m | Blood volume | Saturation | Water | Melanin |
|---|---|---|---|---|---|
| fraction, , % | S, % | , % | , % | ||
| 20 | 0 | 0 | 5 | 0 | |
| Living epidermis | 50 | 0 | 0 | 20 | |
| Papillary dermis | 100 | 4 | 50 | 0 | |
| Upper blood net dermis | 80 | 20 | 60 | 0 | |
| Reticular dermis | 1620 | 4 | 70 | 0 | |
| Deep blood net dermis | 200 | 10 | 70 | 0 | |
| Subcutaneous fat | 5900 | 7 | 15 | 0 |
Therefore, 25 nonzero parameters are required by the considered model (see Table 1) to describe the absorption of the skin. To make the model more practical, some groups of the parameters were reduced by the introduction of the coefficients that links the parameters inside the groups. The main idea in this simplification was to consider a minimal set of parameters influencing the reflectance spectra shape and admitted to change independently. This approach assumes that the parameters of each group can vary coherently. Thus, as seen from Table 1, parameter links blood volume fractions of dermal and sub-dermal layers. The average value of blood oxygen saturation same for all layers was taken into account. The parameter describes the thickness of epidermis and Stragum corneum. Finally, four parameters, , , , were considered as variables to model diffuse reflectance of the skin. The rest of parameters were considered as fixed and equal to their typical values.
2.4 Monte Carlo simulations of diffuse reflectance spectra
For the training of ANN and estimation of blood oxygen saturation, the diffuse reflectance spectra of biotissue phantom were simulated by MC technique using three-layer tissue model (see Fig. 2(c)) accounting the blood layer embedding depth and its oxygen saturation as the variable parameters. The thickness of the blood layer was selected equal to the channel thickness of the biotissue phantom. GPU accelerated Monte Carlo model of photon migration in scattering tissue-like media [26] was used for routine simulation of the spectra in the training dataset for all possible combinations of the considered parameters and cross-validated for biotissue phantoms with [40]. Totally 2,091 spectra were simulated accounting = [0–4] mm with a step of 0.1 mm and = [50–100]% with a step of 1% for the spectral range 500–900 nm with a step of 5 nm. Measured optical properties of the biotissue phantom presented above were utilized for the simulations. Optical properties of blood (hematocrit 45%) for different oxygen levels were adopted from [36].
A similar approach was used to simulate diffuse reflectance spectra of the skin. The differences in the spatial distribution of blood, melanin, blood oxygen saturation, hematocrit, the water content of the skin, as well as the numerical aperture of the detector were taken into account. All possible combinations of four variable parameters were obtained for the simulated skin reflectance spectra accounting blood volume coefficient = [0–2] with a step of 0.1, blood oxygen saturation = [30–100]% with a step of 1%, melanin concentration = [0–0.1] with a step of 0.01 and epidermis thickness coefficient = [1–5] with a step of 1. The complete training data set contained 82,005 spectra in the range of 500–900 nm with a step of 5 nm.
2.5 Neural networks
Matlab R2018b Deep Learning Toolbox was chosen to build and train an interconnected set of neural networks for the retrieval of skin parameters , , and as well as biotissue phantom parameters and . The toolbox allows using the multilayer perceptron (MLP) network for curve fitting and regression. The MLP network has an input layer, one hidden layer and a linear output. It can be regarded as a nonlinear parameterized mapping of the input feature vector to the output space of data fitting results. In the considered problem statement, the inverse solution for tissue parameters characterization can be classified as a construction of a multiple regression model. The favorable number of the neurons in the hidden layer was evaluated in a series of tests. In the tests, the number of neurons was sequentially increased from 1 to , where is the number of data points in the considered spectrum range used for the estimation of skin/phantom parameters. The number of hidden neurons providing the best fitting performance was selected for further use.
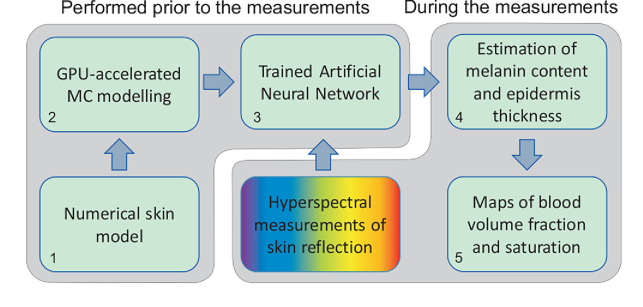
A general flowchart of data processing is shown in Fig. 4. All the mentioned steps can be divided into two major groups. The first group consisting of numerical tissue model adjustment, simulation of the training dataset and training the ANN is the most time consuming but performed prior to the measurements. The second group is the application of trained ANN to the results of the hyperspectral measurements and obtaining the required parameters. This group does not demand significant computational resources and can be performed in line with the experimental data acquisition. At first, the epidermal thickness and melanin content are estimated (step 4 in Fig. 4) using the corresponding trained ANN. The best fit for these parameters was obtained in the spectral range of 680–725 nm and 725–770 nm, respectively. Then, for the estimated epidermal thickness and melanin content, the blood volume fraction and blood oxygenation were retrieved for the spectral range of 535–705 nm and 675–825 nm, respectively (step 5 in Fig. 4). Preprocessing of the measurement data aiming at improving the signal-to-noise ratio consists of the spatial averaging of the input hyperspectral cube in a 5×5 pixel window. All the input measurement data vectors for the considered spectral ranges as well as the training dataset were normalized prior to the network training procedure. The normalization procedure was implemented in the data processing algorithm and dedicated to the mitigation of possible height variations of the skin surface in the camera field of view. The vector normalization (by -norm) for both the training dataset and measured data was used to obtain the corresponding unit vectors.
Fig. 4.
Flowchart of hyperspectral data processing. Steps 1–3 are performed prior to the measurements. Steps 4 and 5 – in line with the data acquisition. Note: step 4 could be omitted for repeated measurements of the same area of interest.
3. Results and discussion
3.1 Phantom studies
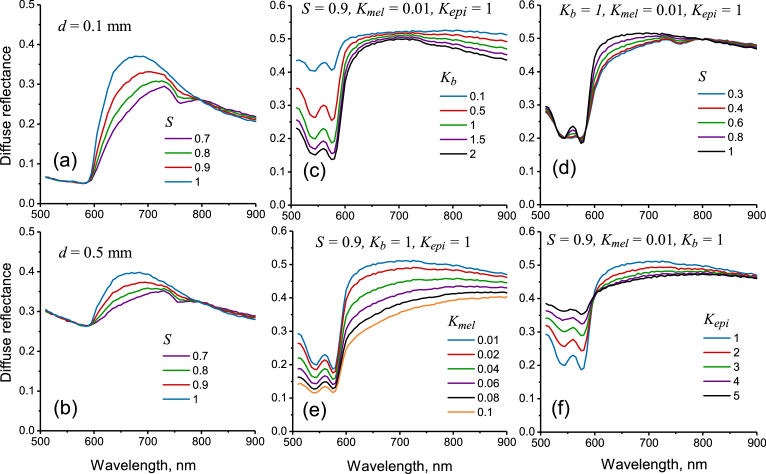
The simulated diffuse reflectance spectra for the biotissue phantom at two values of blood layer embedding depth and different blood oxygen level are presented in Fig. 5(a, b). Strong blood absorption in the spectral region < 600 nm is the cause of low reflection in this range. It is clearly seen that the increase of the embedding depth also increases the reflection in the range of 500–600 nm by making the absorbing layer deeper thus fewer photons are capable of reaching it and get absorbed. For the considered spectral range, similar changes are also typical for the skin reflectance spectra in the case of decrease of blood volume fraction (see Fig. 5(c)) or increase of the epidermis thickness (see Fig. 5(f)). The reflection in the range of 600–800 nm is less depth-sensitive and depends mostly on the blood oxygen level. With the decrease of the blood oxygen level, the reflection in the range of 600–800 nm drops and the characteristic deoxyhemoglobin absorption peak at 760 nm also becomes visible as a pit on the phantom reflection spectra. Similar changes in spectra caused by the variation in blood oxygen saturation are observed for the skin (see Fig. 5(d)).
Fig. 5.
Simulated spectra of diffuse reflectance from biotissue phantom (a, b) at different embedding depths of blood layer and oxygen saturation . Simulated reflectance spectra for human skin at different values of blood volume coefficient – (c), blood oxygen saturation – (d), melanin concentration – (e) and epidermis thickness coefficient – (f).
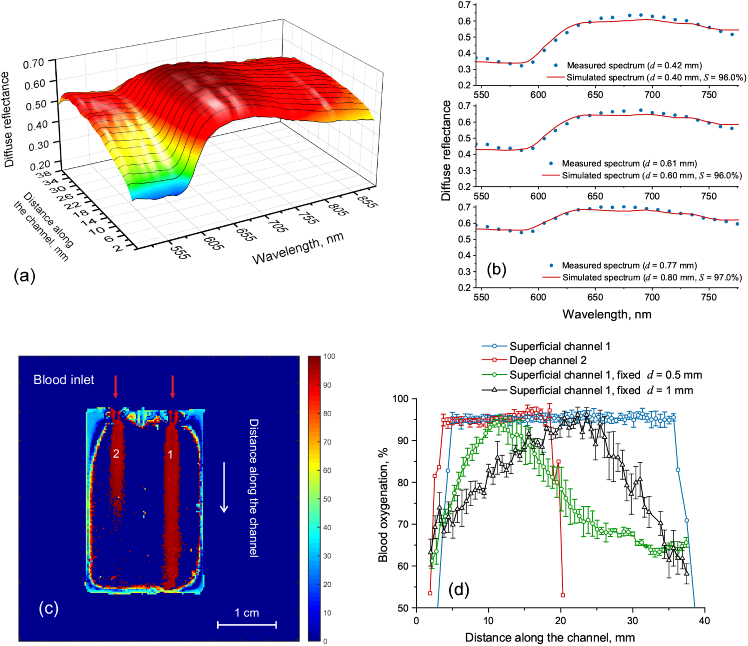
The simulated reflectance spectra were used for training of the ANN for the recovery of the oxygen level in the blood channels inside the biotissue phantom. Trained ANN was applied for processing the hyperspectral measurements of phantom diffuse reflection. The spectral region of 550–800 nm was selected for the blood oxygen estimation as the most prominent changes of reflectance are observed in this region as can be seen from Fig. 5(a, b). Figure 6(a) shows the measured diffuse reflectance along the superficial channel. The distance along the channel linearly corresponds to the channel embedding depth. Thus, the increase in the channel embedding depth causes the significant increase of the reflection in the range 500–600 nm similarly as it was observed in the simulations. Figure 6(b) shows the comparison of the measured reflectance spectra (dots) with the simulated ones (lines) selected as a best fit by the trained ANN for three values of the capillary embedding depth. In all cases, the recovered blood oxygen saturation differs less than 4% from the actual value. The map of the recovered blood oxygen saturation for the whole biotissue phantom is presented in Fig. 6(c). The corresponding values for the superficial and deep channels are shown in Fig. 6(d). It is seen that the correct value of blood oxygenation, in this case, can be recovered up to the depth of about 2 mm that corresponds approximately to the middle of the channel 2. Further increase of the embedding depth causes the immediate signal loss.
Fig. 6.
Spectral dependence of the diffuse reflectance measured along the deepening superficial channel (a); measured reflectance versus best fit selected by the trained ANN (b); 2D map of blood oxygen saturation in the biotissue phantom (c); recovered values of blood oxygen saturation in the deepening superficial and deep channels of the biotissue phantom (d).
The results described above were obtained using two-parameter fit accounting the dependence of the simulated spectra on the channel embedding depth and blood oxygen saturation . The phantom studies also allow to investigate the effect of the chosen tissue model on the blood oxygen level recovering accuracy. Fig. 6(d) (the green and the black lines) shows the recovered oxygen level in the deepening superficial channel of the phantom using the biotissue model with the fixed embedding depth of the blood layer ( = 0.5 and 1 mm, correspondingly). Thus, it is seen that the application of the model with a fixed embedding depth of the blood layer may lead to significant (up to 40%) underestimation of the recovered blood oxygen saturation. In this case, the best fit performed by the neural network is obtained for a reflectance spectrum corresponding to lower oxygen saturation that is causing the underestimation in the recovered oxygen level. The correct value is obtained only for the embedding depth corresponding to that in the biotissue model.
3.2 In vivo skin imaging
The proposed imaging approach was applied to human skin in vivo. Typical dependencies of the simulated skin reflectance spectra on the variable parameters (, , , ) obtained for seven-layer skin model are presented in Fig. 5(c–f). The increase of blood volume fraction in the skin (shown in Fig. 5(c)) causes the decrease of skin reflectance within the entire spectral range of 500–900 nm. However, the most significant changes are observed in the region of strong blood absorption (500–600 nm) that is also observed in the experiments with variable mechanical pressure on the skin [41]. The most prominent changes in the skin reflectance caused by the variation in blood oxygen saturation are observed in the range of 600–800 nm (see Fig. 5(d)). The influence of the melanin content in the epidermis is shown in Fig. 5(e). It is seen that an increase in melanin content decreases the reflectance in the entire considered spectral range. However, the change in the shape of spectra is significantly different compared to the increase of blood volume fraction. Increase in the epidermal thickness (see Fig. 5(f)) acts differently for the spectral region 500–600 nm and 600–900 nm. Below 600 nm the increase in the epidermal thickness causes the increase in skin reflectance, however, for the longer wavelengths, similar increase causes the decrease in the reflectance. This effect can be explained by the significantly lower (up to two orders of magnitude) absorption of oxyhemoglobin in the red-IR spectral region relative to the absorption in the green region. Thus, the oxygenated blood turns into a moderate absorber and the decrease in the reflectance in the red-IR region is caused by the increased optical density of the epidermis.
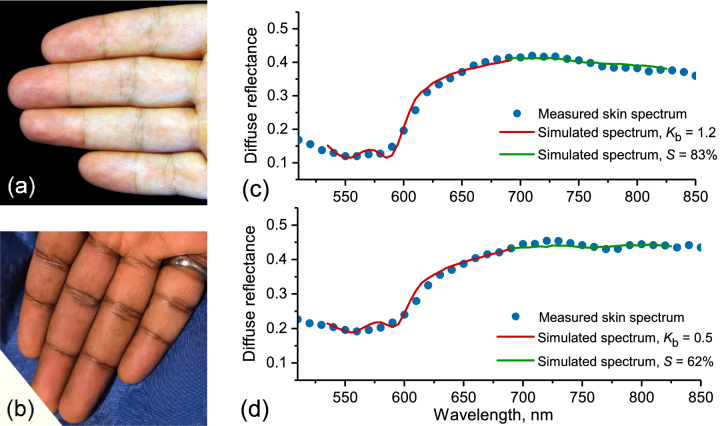
The developed hyperspectral imaging system was used to perform trial measurements and the arterial occlusion tests with healthy volunteers. Several examples of the obtained hyperspectral images of the dorsal and palmar side of a human hand are shown in Visualization 1 (4.9MB, avi) . According to the University of Oulu Ethics Committee regulations, informed consent was obtained from all tested subjects. Caucasian and Indian male skin corresponding to the type II and V of Fitzpatrick scale (Fig. 7(a,b)) was considered. During the occlusion test, the middle or ring finger of the right hand was occluded with a rubber band. The pressure applied was above both systolic/diastolic pressures that ensured suppression of blood circulation within the finger and, hence, its oxygenation. Hyperspectral images of the intact skin before the occlusion, after 3 minutes of continuous occlusion and 1 minute after the release of the occluding ring were obtained. Finally, 2D maps of blood volume fraction and blood oxygen saturation were reconstructed. Spatial variations in the thickness of the epidermis and melanin content of the skin were also taken into account. Figure 7(c,d) shows a comparison of the measured skin reflectance spectra with those selected as the best fit by the trained ANN. A good general agreement of measured and simulated spectra is demonstrated. The measurements were performed for Caucasian skin at a distal phalanx of a ring finger before (Fig. 7(c)) and during the occlusion (Fig. 7(d)) resulting in a simultaneous decrease of blood volume fraction and oxygenation.
Fig. 7.
Photographs of the Caucasian (a) and Indian (b) skin in vivo used for the measurements. Measured skin diffuse reflectance versus best fit selected by the trained ANN for Caucasian skin at different values of blood volume fraction and oxygenation before (c) and during (d) the occlusion. The measurements were performed at a distal phalanx of a ring finger. Red and green colors indicate the parts of the spectrum used for estimation of skin blood volume fraction and oxygenation, correspondingly.
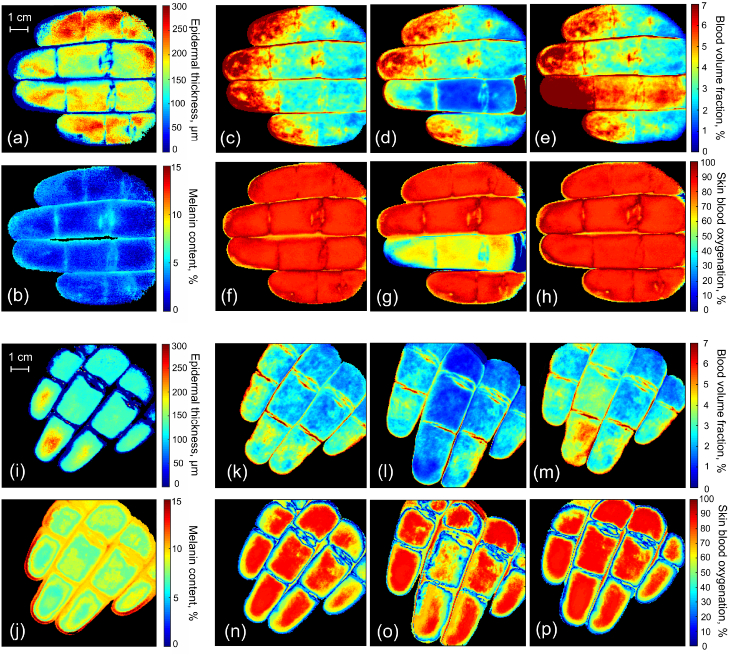
The reconstructed values of epidermal thickness and melanin content for the considered skin types are presented in Fig. 8(a,i) and Fig. 8(b,j), correspondingly. The average value of epidermal thickness in both cases is within 140–180 m that is typical for palmar skin. The uneven distribution of the epidermal thickness across the measured area can be explained by the intra-individual variability related to uneven loads to the different parts of the palm during the lifetime. The average recovered value of melanin content is 1.3% for Caucasian skin and 8% for Indian skin. Fig. 8(c–e) and (k–m) present the reconstructed maps of blood volume fraction during the occlusion test for both considered skin types. It is seen that in the case shown in Fig. 8(c) the blood content for the distal phalanges is up to 3 times higher than for the middle or proximal ones. This increase could also be noticed from the photograph presented in Fig. 7(a). For the second case (see Fig. 8(k)), the corresponding increase is about 2 times. During the occlusion (see Fig. 8(d,l)), in both cases, the significant decrease in blood content is observed. The release of the occlusion ring causes the appearance of the reactive hyperemia resulting in the increase of blood volume fraction (see Fig. 8(e,m)) that can be reliably detected by the developed system in case of low and high melanin content of the skin. Figure 8(f–h) and (n–p) present the obtained maps of the blood oxygenation before, during and after the occlusion for both of skin types. The average blood oxygen level is of 81–84% for not occluded tissues. The obtained parameter represents tissue oxygenation and corresponds to the average between the oxygen saturation of the arterial (95–99%) and venous (∼75%) blood [42]. Three-minute occlusion lowers the blood oxygen content down to the level of 60–65% (see Fig. 8(g,o)). After the release of the occlusion ring, the oxygenation rapidly recovers back to its initial values (see Fig. 8(h,p)).
Fig. 8.
Reconstructed values of the epidermal thickness (a, i) and melanin content (b, j) for the Caucasian and Indian skin, correspondingly. Retrieved maps of blood volume fraction before (c, k), during (d,l) and 1 min after (e,m) the ring/middle finger occlusion for the considered skin types. Corresponding maps of skin blood oxygenation before (f,n), during (g,o) and 1 min after (h, p) the occlusion.
Thus, the developed hyperspectral system has shown the ability to sense the alterations of blood volume fraction and blood oxygen level in human skin in vivo and biotissue phantoms. The melanin content and epidermal thickness of skin have been taken into account to obtain correct values of blood fraction and oxygenation for different skin types. The implementation of the ANN-based processing allows for fast recovery of the considered skin parameters. The mean processing time of one hyperspectral measurement including retrieval of 2D maps of the above-mentioned skin parameters on an Intel Core i7 computer with 4 CPU cores and 16 Gb RAM requires about 3s. The potential of further decrease in the processing time using GPU units is also available.
An alternative approach for the assessment of blood content and oxygen saturation in biotissues is spatial frequency-domain imaging (SFDI) [43]. In this approach, the tissue is illuminated by a sinusoidal light pattern of different spatial frequencies and wavelengths. The benefit is the control over the penetration depth of the light in biotissues by accounting for corresponding spatial frequencies. However, this approach also utilizes a simplified tissue model (one- or two-layer) [44] that limits its application in the hyperspectral domain.
3.3 System limitations and future directions
Although the performance of the proposed data processing algorithm allows for near real-time processing of the hyperspectral images, the time of the hypercube acquisition (∼30s depending on the exposure time) and the duration of the data transfer process (∼10s) via USB interface create a bottleneck in the pipeline of the measurement procedure thus imposing the main limitation on the system performance. Nevertheless, it should be noted that in this paper, we focus mostly on the data processing rather than data acquisition. The spatial resolution of the system is estimated to be of 0.5 mm. The limited field of view applies certain restrictions on the large-scale skin imaging as it would require performing consecutive measurements with subsequent image stitching.
The future work will focus on the development intended to overcome the described limitations. In particular, critical assessment of data acquisition procedure and optimization of the illumination intensity will create a possibility to improve the system performance towards the real-time applications.
4. Conclusion
A compact, hand-held hyperspectral imaging system utilizing ANN-based processing for the reconstruction of 2D maps of blood volume fraction and blood oxygen saturation in the skin was developed. For the correct quantitative evaluation of the parameters mentioned above, the melanin fraction distribution and epidermal thickness of the skin were taken into account. The developed approach is capable of close to the real-time hyperspectral image processing based on the advanced seven-layer skin model.
Phantom studies have shown that the correct estimation of the thickness of the superficial bloodless layer plays an important role in the accurate estimation of blood oxygenation. Using the proposed method, the blood oxygen saturation in the 250-m-thick capillary can be correctly assessed up to the embedding depth of 2 mm in the biotissue phantom mimicking human skin.
The system was also used to perform trial measurements including occlusion tests with healthy volunteers. As a result, 2D spatial distribution of blood volume fraction, blood oxygen saturation, as well as melanin content and epidermal thickness of the skin, were obtained.
The presented approach has a strong potential for clinical applications, e.g. for monitoring and diagnosis of chronic skin ulcer and other relevant skin diseases along with cosmetological defects.
Funding
Academy of Finland10.13039/501100002341 (290596, 314369, 318281); Ministry of Science and Higher Education of Russian Federation (0035-2019-0014).
Disclosures
The authors declare no conflicts of interests relevant to this article.
References
- 1.Lu G., Fei B., “Medical hyperspectral imaging: a review,” J. Biomed. Opt. 19(1), 010901 (2014). 10.1117/1.JBO.19.1.010901 [DOI] [PMC free article] [PubMed] [Google Scholar]
- 2.Yudovsky D., Nouvong A., Schomacker K., Pilon L., “Monitoring temporal development and healing of diabetic foot ulceration using hyperspectral imaging,” J. Biophotonics 4(7-8), 565–576 (2011). 10.1002/jbio.201000117 [DOI] [PubMed] [Google Scholar]
- 3.Dremin V., Zherebtsov E., Sidorov V., Krupatkin A., Makovik I., Zherebtsova A., Zharkikh E., Potapova E., Dunaev A., Doronin A., Bykov A., Rafailov I., Litvinova K., Sokolovski S., Rafailov E., “Multimodal optical measurement for study of lower limb tissue viability in patients with diabetes mellitus,” J. Biomed. Opt. 22(8), 085003 (2017). 10.1117/1.JBO.22.8.085003 [DOI] [PubMed] [Google Scholar]
- 4.Milanic M., Paluchowski L., Randeberg L., “Hyperspectral imaging for detection of arthritis: feasibility and prospects,” J. Biomed. Opt. 20(9), 096011 (2015). 10.1117/1.JBO.20.9.096011 [DOI] [PubMed] [Google Scholar]
- 5.Zherebtsov E., Zherebtsova A., Doronin A., Dunaev A., Podmasteryev K., Bykov A., Meglinski I., “Combined use of laser doppler flowmetry and skin thermometry for functional diagnostics of intradermal finger vessels,” J. Biomed. Opt. 22(4), 040502 (2017). 10.1117/1.JBO.22.4.040502 [DOI] [PubMed] [Google Scholar]
- 6.Wahabzada M., Besser M., Khosravani M., Kuska M., Kersting K., Mahlein A.-K., Sturmer E., “Monitoring wound healing in a 3D wound model by hyperspectral imaging and efficient clustering,” PLoS One 12(12), e0186425 (2017). 10.1371/journal.pone.0186425 [DOI] [PMC free article] [PubMed] [Google Scholar]
- 7.Wild T., Becker M., Winter J., Schuhschenk N., Daeschlein G., Siemers F., “Hyperspectral imaging of tissue perfusion and oxygenation in wounds: assessing the impact of a micro capillary dressing,” J. Wound Care 27(1), 38–51 (2018). 10.12968/jowc.2018.27.1.38 [DOI] [PubMed] [Google Scholar]
- 8.Hosking A., Coakley B., Chang D., Talebi-Liasi F., Lish S., Lee S. W., Zong A., Moore I., Browning J., Jacques S., Krueger J., Kelly K., Linden K., Gareau D., “Hyperspectral imaging in automated digital dermoscopy screening for melanoma,” Lasers Surg. Med. 51(3), 214–222 (2019). 10.1002/lsm.23055 [DOI] [PMC free article] [PubMed] [Google Scholar]
- 9.Pardo A., Gutierrez-Gutierrez J., Lihacova I., Lopez-Higuera J., Conde O., “On the spectral signature of melanoma: a non-parametric classification framework for cancer detection in hyperspectral imaging of melanocytic lesions,” Biomed. Opt. Express 9(12), 6283–6301 (2018). 10.1364/BOE.9.006283 [DOI] [PMC free article] [PubMed] [Google Scholar]
- 10.Akbari H., Uto K., Kosugi Y., Kojima K., Tanaka N., “Cancer detection using infrared hyperspectral imaging,” Cancer Sci. 102(4), 852–857 (2011). 10.1111/j.1349-7006.2011.01849.x [DOI] [PMC free article] [PubMed] [Google Scholar]
- 11.Valdes P., Jacobs V., Wilson B., Leblond F., Roberts D., Paulsen K., “System and methods for wide-field quantitative fluorescence imaging during neurosurgery,” Opt. Lett. 38(15), 2786–2788 (2013). 10.1364/OL.38.002786 [DOI] [PubMed] [Google Scholar]
- 12.Wisotzky E., Uecker F., Arens P., Dommerich S., Hilsmann A., Eisert P., “Intraoperative hyperspectral determination of human tissue properties,” J. Biomed. Opt. 23(9), 091409 (2018). 10.1117/1.JBO.23.9.091409 [DOI] [PubMed] [Google Scholar]
- 13.Bolton F., Bernat A., Bar-Am K., Levitz D., Jacques S., “Portable, low-cost multispectral imaging system: design, development, validation, and utilization,” J. Biomed. Opt. 23(12), 121612 (2018). 10.1117/1.JBO.23.12.121612 [DOI] [PubMed] [Google Scholar]
- 14.Kim S., Cho D., Kim J., Kim M., Youn S., Jang J. E., Je M., Lee D. H., Lee B., Farkas D., Hwang J. Y., “Smartphone-based multispectral imaging: system development and potential for mobile skin diagnosis,” Biomed. Opt. Express 7(12), 5294–5307 (2016). 10.1364/BOE.7.005294 [DOI] [PMC free article] [PubMed] [Google Scholar]
- 15.Spigulis J., “Multispectral, fluorescent and photoplethysmographic imaging for remote skin assessment,” Sensors 17(5), 1165 (2017). 10.3390/s17051165 [DOI] [PMC free article] [PubMed] [Google Scholar]
- 16.Bydlon T., Nachabe R., Ramanujam N., Sterenborg H., Hendriks B., “Chromophore based analyses of steady-state diffuse reflectance spectroscopy: current status and perspectives for clinical adoption,” J. Biophotonics 8(1-2), 9–24 (2015). 10.1002/jbio.201300198 [DOI] [PubMed] [Google Scholar]
- 17.Kapsokalyvas D., Bruscino N., Alfieri D., de Giorgi V., Cannarozzo G., Cicchi R., Massi D., Pimpinelli N., Pavone F. S., “Spectral morphological analysis of skin lesions with a polarization multispectral dermoscope,” Opt. Express 21(4), 4826–4840 (2013). 10.1364/OE.21.004826 [DOI] [PubMed] [Google Scholar]
- 18.Tuchin V., Tissue Optics: Light Scattering Methods and Instruments for Medical Diagnosis, SPIE Digital Library (SPIE, 2015). [Google Scholar]
- 19.Nishidate I., Tanaka N., Kawase T., Maeda T., Yuasa T., Aizu Y., Yuasa T., Niizeki K., “Noninvasive imaging of human skin hemodynamics using a digital red-green-blue camera,” J. Biomed. Opt. 16(8), 086012 (2011). 10.1117/1.3613929 [DOI] [PubMed] [Google Scholar]
- 20.Spigulis J., Oshina I., Berzina A., Bykov A., “Smartphone snapshot mapping of skin chromophores under triple-wavelength laser illumination,” J. Biomed. Opt. 22(9), 091508 (2017). 10.1117/1.JBO.22.9.091508 [DOI] [PubMed] [Google Scholar]
- 21.Yudovsky D., Pilon L., “Simple and accurate expressions for diffuse reflectance of semi-infinite and two-layer absorbing and scattering media,” Appl. Opt. 48(35), 6670–6683 (2009). 10.1364/AO.48.006670 [DOI] [PubMed] [Google Scholar]
- 22.Kienle A., Patterson M., Dognitz N., Bays R., Wagnieres G., van den Bergh H., “Noninvasive determination of the optical properties of two-layered turbid media,” Appl. Opt. 37(4), 779–791 (1998). 10.1364/AO.37.000779 [DOI] [PubMed] [Google Scholar]
- 23.Liemert A., Kienle A., “Light diffusion in n-layered turbid media: steady-state domain,” J. Biomed. Opt. 15(2), 025003 (2010). 10.1117/1.3368685 [DOI] [PubMed] [Google Scholar]
- 24.Bjorgan A., Milanic M., Randeberg L., “Estimation of skin optical parameters for real-time hyperspectral imaging applications,” J. Biomed. Opt. 19(6), 066003 (2014). 10.1117/1.JBO.19.6.066003 [DOI] [PubMed] [Google Scholar]
- 25.Venugopalan V., You J. S., Tromberg B. J., “Radiative transport in the diffusion approximation: An extension for highly absorbing media and small source-detector separations,” Phys. Rev. E 58(2), 2395–2407 (1998). 10.1103/PhysRevE.58.2395 [DOI] [Google Scholar]
- 26.Doronin A., Meglinski I., “Online object oriented Monte Carlo computational tool for the needs of biomedical optics,” Biomed. Opt. Express 2(9), 2461–2469 (2011). 10.1364/BOE.2.002461 [DOI] [PMC free article] [PubMed] [Google Scholar]
- 27.Doronin A., Meglinski I., “Peer-to-peer Monte Carlo simulation of photon migration in topical applications of biomedical optics,” J. Biomed. Opt. 17(9), 0905041 (2012). 10.1117/1.JBO.17.9.090504 [DOI] [PubMed] [Google Scholar]
- 28.“Cloud based Monte Carlo tool for photon transport,” www.lighttransport.net. Accessed: 2019-03-04.
- 29.Bykov A., Popov A., Priezzhev A., Myllyla R., “Multilayer tissue phantoms with embedded capillary system for OCT and DOCT imaging,” Proc. SPIE 8091, 80911R (2011). 10.1117/12.889923 [DOI] [Google Scholar]
- 30.Wrobel M., Popov A., Bykov A., Kinnunen M., Jedrzejewska-Szczerska M., Tuchin V., “Measurements of fundamental properties of homogeneous tissue phantoms,” J. Biomed. Opt. 20(4), 045004 (2015). 10.1117/1.JBO.20.4.045004 [DOI] [PubMed] [Google Scholar]
- 31.Wrobel M., Popov A., Bykov A., Kinnunen M., Jedrzejewska-Szczerska M., Tuchin V., “Multi-layered tissue head phantoms for noninvasive optical diagnostics,” J. Innovative Opt. Health Sci. 08(03), 1541005 (2015). 10.1142/S1793545815410059 [DOI] [Google Scholar]
- 32.Moffitt T., Chen Y.-C., Prahl S., “Preparation and characterization of polyurethane optical phantoms,” J. Biomed. Opt. 11(4), 041103 (2006). 10.1117/1.2240972 [DOI] [PubMed] [Google Scholar]
- 33.Salomatina E., Jiang B., Novak J., Yaroslavsky A., “Optical properties of normal and cancerous human skin in the visible and near-infrared spectral range,” J. Biomed. Opt. 11(6), 064026 (2006). 10.1117/1.2398928 [DOI] [PubMed] [Google Scholar]
- 34.Ma X., Lu J. Q., Ding H., Hu X.-H., “Bulk optical parameters of porcine skin dermis at eight wavelengths from 325 to 1557 nm,” Opt. Lett. 30(4), 412–414 (2005). 10.1364/OL.30.000412 [DOI] [PubMed] [Google Scholar]
- 35.Jacques S., “Optical properties of biological tissues: a review,” Phys. Med. Biol. 58(11), R37–R61 (2013). 10.1088/0031-9155/58/11/R37 [DOI] [PubMed] [Google Scholar]
- 36.Bosschaart N., Edelman G., Aalders M., van Leeuwen T., Faber D., “A literature review and novel theoretical approach on the optical properties of whole blood,” Lasers Med. Sci. 29(2), 453–479 (2014). 10.1007/s10103-013-1446-7 [DOI] [PMC free article] [PubMed] [Google Scholar]
- 37.Moco A., Stuijk S., de Haan G., “New insights into the origin of remote PPG signals in visible light and infrared,” Sci. Rep. 8(1), 8501 (2018). 10.1038/s41598-018-26068-2 [DOI] [PMC free article] [PubMed] [Google Scholar]
- 38.Petrov G., Doronin A., Whelan H., Meglinski I., Yakovlev V., “Human tissue color as viewed in high dynamic range optical spectral transmission measurements,” Biomed. Opt. Express 3(9), 2154–2161 (2012). 10.1364/BOE.3.002154 [DOI] [PMC free article] [PubMed] [Google Scholar]
- 39.Meglinski I., Doronin A., Bashkatov A., Genina E., Tuchin V., “Dermal component-based optical modeling of skin translucency: Impact on skin color,” in Computational Biophysics of the Skin, (Pan Stanford Publishing Ltd., 2014), pp. 25–62. [Google Scholar]
- 40.Loginova D., Sergeeva E., Fiks I., Kirillin M., “Probing depth in diffuse optical spectroscopy and structured illumination imaging: a Monte Carlo study,” J. Biomed. Photonics Eng. 3(1), 010303 (2017). 10.18287/JBPE17.03.010303 [DOI] [Google Scholar]
- 41.Popov A., Bykov A., Meglinski I., “Influence of probe pressure on diffuse reflectance spectra of human skin measured in vivo,” J. Biomed. Opt. 22(11), 110504 (2017). 10.1117/1.JBO.22.11.110504 [DOI] [PubMed] [Google Scholar]
- 42.Akons K., Dann E., Yelin D., “Measuring blood oxygen saturation along a capillary vessel in human,” Biomed. Opt. Express 8(11), 5342–5348 (2017). 10.1364/BOE.8.005342 [DOI] [PMC free article] [PubMed] [Google Scholar]
- 43.Cuccia D., Bevilacqua F., Durkin A., Ayers F., Tromberg B., “Quantitation and mapping of tissue optical properties using modulated imaging,” J. Biomed. Opt. 14(2), 024012 (2009). 10.1117/1.3088140 [DOI] [PMC free article] [PubMed] [Google Scholar]
- 44.Saager R., Truong A., Cuccia D., Durkin A., “Method for depth-resolved quantitation of optical properties in layered media using spatially modulated quantitative spectroscopy,” J. Biomed. Opt. 16(7), 077002 (2011). 10.1117/1.3597621 [DOI] [PMC free article] [PubMed] [Google Scholar]


