Abstract
Calcium ions (Ca2+) impact nearly every aspect of cellular life and intracellular calcium [Ca2+]i is a critical factor in the regulation of a plethora of physiological functions, including: muscle contraction, saliva secretion, metabolism, gene expression, cell survival and death. By measuring the changes of [Ca2+]i levels, critical physiologic functions can be characterized and aberrant pathologic conditions or drug responses can be efficiently monitored. We developed a protocol for assessment of Ca2+ signaling in the acinar units of submandibular glands isolated from C57BL/6 mice, using benchtop, multi-mode, high throughput plate reader (FlexStation 3). This method represents a powerful tool for unlimited in vitro studies to monitor changes in receptor-mediated Ca2+ responses while retaining functional and morphological features of a native setting.
Keywords: calcium, carbachol, in vitro, FlexStation, ionomycin, salivary glands, signaling
BACKGROUND
Key events in salivary gland calcium signaling
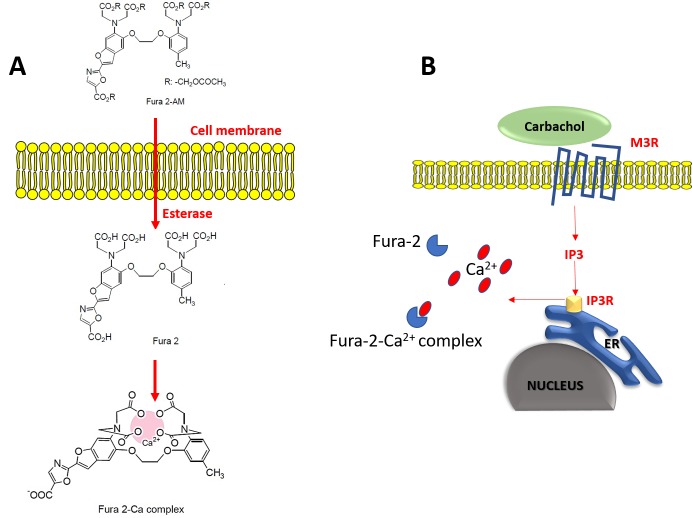
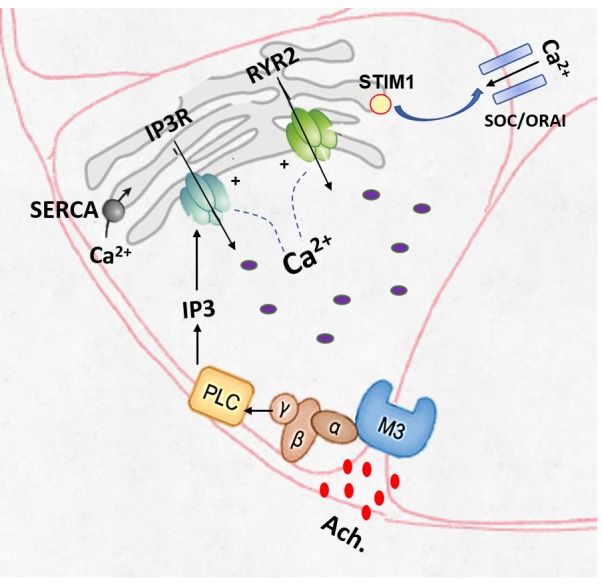
For many years, exocrine acinar cells have been the optimal model for examining Ca2+ signaling. Acetylcholine is the parasympathetic postganglionic transmitter that mainly acts on the acinar M3 muscarinic receptors to increase intracellular calcium [Ca2+]i and stimulate fluid secretion [1]. The primary action of acetylcholine on muscarinic receptors is the activation of phospholipase Cβ (PLCβ). PLCβ cleaves phosphatidylinositol 1,4, bisphosphate (PIP2) to produce diacylglycerol (DAG) and the soluble signaling molecule; inositol 1,4,5, trisphosphate (IP3) [2,3]. IP3 activates the endoplasmic reticulum (ER)-Ca2+ release channels; IP3 receptors (IP3Rs), which induce Ca2+ release from the ER stores [4]. IP3-mediated Ca2+ release via IP3R, and resulting depletion of ER Ca2+, is the main triggering event in the activation of Ca2+ entry, which is mediated by the store-operated Ca2+ entry mechanism [5]. It is worth noting that the presence of Ca2+ in the cytoplasm will release more Ca2+ from the endoplasmic reticulum, providing what’s known as Ca2+-induced Ca2+ release (CICR), which represents a powerful mechanism for amplification and propagation of cytosolic Ca2+ signals [6]. The termination of Ca2+ signals is as important as their initiation [7]. Thus, all Ca2+ released from the ER is pumped out of the cell by the plasma membrane Ca2+ pump (plasma-membrane-Ca2+-activated-ATPase, or PMCA) [8]. Extruded Ca2+ then re-enters the cell, presumably through store-operated Ca2+ channels, to be taken up into the ER by the sarco-endoplasmic-reticulum-Ca2+-activated ATPase, or SERCA [9,10] (Fig. 1).
Figure 1. Mechanisms of M3R-mediated release of Ca2+ from the endoplasmic reticulum.
Fura-2 as a calcium sensing dye
Intracellular calcium concentration variations at the nanomolar scale can be detected in live cells with either dyes or biosensors. Fura-2 is by far the most commonly used ratiometric fluorescent dye for quantitative [Ca2+]i measurements [11]. Fura-2-free acid is Ca2+ sensitive but membrane impermeant. Accordingly, fura-2 pentaacetoxymethyl (AM) ester is used to permeate the cells. Once inside the cell, esterase enzymes sequentially cleave the AM groups to leave fura-2-free acid trapped inside the cell, where it is able to bind Ca2+ [12] (Fig. 2). Fura-2 exhibits excitation spectrum changes upon Ca2+ binding such that the Ca2+ free form is excited maximally at 380 nm while the Ca2+ bound form is excited maximally at 340 nm. Both forms emit fluorescence with a peak at 510 nm [13]. Therefore, it follows that the concentration of free [Ca2+]i is proportional to the ratio of fluorescence at 340/380.
Figure 2. FURA-2 detection of intracellular changes and Ca2+ binding.
A. Structural changes of Fura-2 by esterase activity and Ca2+ binding. Fura-2 AM ester is Ca2+ insensitive and nonpolar. Once inside the cell, esterase enzymes sequentially cleave the AM groups to leave Fura-2-free acid (Ca2+ sensitive, polar) trapped inside the cell, where it is able to bind Ca2+. B. Carbachol is a muscarinic receptor agonist that initiates a signaling pathway, resulting in the release of Ca2+ within seconds. Fura-2 exhibits a calcium dependent excitation spectral shift to report the 340/380 ratio.
High throughput assay of calcium signaling
Multi-mode, automated, microplate readers with integrated fluidics transfer capabilities can measure time-resolved changes in fluorescence and are suitable for performing intracellular Ca2+ mobilization assays in a 96-well format. The FlexStation 3 has been used for studying the function of Ca2+-permeable ion channels and G-protein coupled receptors in the HTC4 rat hepatoma cell line [14]. In addition, it has permitted monitoring the ryanodine receptor 2 (RYR2) activity in the mouse pulmonary artery myocytes [15] and P2 receptors’ (P2Rs) activity in eosinophils isolated from rat peritoneal lavage [16]. To our knowledge, the FlexStation 3 has not been used to study calcium kinetics in cells prepared from exocrine tissues such as the salivary glands. While measuring [Ca2+]i using single cell fluorescent microscopy provides sensitivity and temporal resolution, and it is also exhaustive and time consuming.
Accordingly, the high-throughput screening of [Ca2+]i kinetics with the FlexStation 3 can be more favorable, mainly because of its cost-effectiveness, speed and the automated fluidics system. Furthermore, the use of this instrument for measurements of intracellular Ca2+ in salivary gland cells or any acutely isolated cells from other tissues provides two overlapping advantages. First, the possibility of automated screening of multiple wells at the same time, overcomes the delay that can be anticipated with linear systems measuring one well at a time. Reasonably, for real-time measurements of several minutes, linear systems introduce an undesirably long delay between measurement of the first and last well and the kinetic Ca2+ measurements of only a few minutes/well will introduce a delay of several hours between the first and the last measurement in a 96-well plate. During this delay, cells maintained in suboptimal conditions, may show deterioration of function and viability. In addition, this could result in dye leakage as well as dye sequestration in intracellular organelles, e.g., mitochondria [17]. The other advantage that can also be related to the former fact is the possibility of automatic and simultaneous transfer of a wide array of compound concentrations sequentially to the assay plate. This allows repeatable, reliable and reproducible recording of Ca2+ levels in the acinar units, which can be differentially treated. The step-by-step protocol presented herein describes a method that has been developed for preparing mouse salivary glands for assessing acinar cell Ca2+ dynamics ex-vivo. This approach leverages multi-well plate assaying of calcium signals with improved workflow in a semi-automated, high volume fashion. Presumably, this protocol can be applied to other exocrine glands, to reliably unravel aberrations in [Ca2+]i responses, which can directly cause cell dysfunction and increase the rates of cell damage [18].
MATERIALS
Reagents
HEPES (Sigma-Aldrich, Cat. # H3375)
NaCl (Sigma-Aldrich, Cat. # S7653)
KCl (BDH, AnalaR, Cat. # 101984L)
MgCl2 (Sigma-Aldrich, Cat. # M8266)
CaCl2 (Sigma-Aldrich, Cat. # C-4901)
Glucose (Sigma-Aldrich, Cat. # G8270)
Glutamine (Sigma-Aldrich, Cat. # G7513)
MEM Non-Essential Amino Acids Solution (100X) (Thermo Fisher Scientific (Life Technologies) Cat. # 11140050)
Bovine serum albumin (BSA) (Sigma-Aldrich, Cat. # A2153)
Collagenase from Clostridium histolyticum (Type-4 collagenase) (Sigma-Aldrich, Cat. # C5138)
Soybean Trypsin Inhibitor (Thermo Fisher Scientific (Life Technologies), Cat. # 17075029)
Corning® Cell-Tak (Fisher Scientific Ltd, Cat. # 354240)
NaHCO3 (Sigma-Aldrich, Cat. # S6014)
Fura-2 AM (Molecular Probes™, Cat. # F-1201)
Probenecid (Sigma-Aldrich, Cat. # P8761)
Half-area, 96-well plates ((Fisher Scientific Ltd, Cat. # 10717804)
Carbachol (CCh) (Santa Cruz Biotechnology, Cat. # sc-202092)
Ionomycin (IM) (Santa Cruz Biotechnology, Cat. # sc-3592)
Culture grade dimethyl sulfoxide (DMSO) (Sigma-Aldrich, Cat. # 276855)
Dulbecco phosphate buffered saline (DPBS) (Sigma-Aldrich, Cat. # D8662)
Recipes
HEPES incubation buffer: 20 mM HEPES, 95 mM NaCl, 4.7 mM KCl, 0.6 mM MgCl2, 1.3 mM CaCl2, 10 mM glucose, 2 mM glutamine, and 1 × minimum Eagle’s medium non-essential amino acids, pH 7.4. The buffer was oxygenated for 20 min before use
BSA incubation buffer: BSA 1% w/v final added to 25 ml of the HEPES buffer
Collagenase digestion buffer (CDB): 1.1 mg/ml type-4 collagenase and 1 mg/ml soybean trypsin inhibitor added to 6 ml of BSA incubation buffer
Sodium bicarbonate (NaHCO3) neutral buffer solution: 0.1 M sodium bicarbonate, pH 8.0 was prepared by dissolving 420 mg NaHCO3 in 50 ml ultrapure distilled water
For coating of a half area 96-well plate: Dilute 30 µl of Corning® Cell-Tak in 2 ml of the neutral bicarbonate buffer
Fura-2 AM stock solution: Suspend 1 mg of lyophilized Fura-2 AM with DMSO to yield a 1 mM stock. Aliquot this stock and keep at all times in the dark at −20°C
1 M probenecid: Dissolve in 1 M NaOH (50 mg/ml), yielding a clear, colorless solution
Fura-2 working solution: 4 µl Fura-2 AM stock, 4 µl probenecid 1 M and 4 ml HEPES buffer
CAUTION: Buffer preparation and cell loading should be performed in the dark to prevent degradation of the Fura-2.
Equipment
FlexStation 3 (Molecular Devices, Inc.) benchtop scanning fluorometer is used to measure changes in fluorescence of the fura-2 stained acinar units upon agonists’ transfer from the compound plate to the pre-designated set of wells in the assay plate.
PROCEDURE
-
Assay plate preparation
To maintain acinar units in place throughout the FlexStation 3 measurements, Corning® Cell-Tak adhesive was used to coat the half-area, 96-well assay plates which were used in these experiments. Corning® Cell-Tak adhesive is a formulation of the “polyphenolic proteins” [19] extracted from the marine mussel, Mytilus edulis. This family of related proteins is the key component of the glue secreted by the mussel to anchor itself to solid structures in its natural environment [20].
1.1. On the day preceding the experiment, filter-sterilize the NaHCO3 neutral buffer solution.
1.2. The amount of Corning® Cell-Tak required for each well in the assay plate is calculated according to the manufacturer’s recommendations: 0.56 µg Corning® Cell-Tak/well.
1.3. Dilute the correct amount of Corning® Cell-Tak into the neutral buffer, mix thoroughly, and dispense into the assay plate wells within 10 min.
1.4. Place the cover and incubate the coated assay plate overnight at room temperature.
1.5. On the next day (the day of the experiment), pour the unevaporated Cell-Tak off and wash each well with 200 µl filter-sterile distilled water to remove the bicarbonate.
- HINT: It is of extreme importance not to place the Cell-Tak-coated assay plate in the CO2 incubator while preparing the compound plate, otherwise Cell-Tak will lose its activity and acinar units will be detached from the plate bottom when the secretagogues are added and severe inconsistency in fluorescence recording will occur.
-
Isolation and preparation of the SMGs
2.1. Dissect the submandibular glands (SMGs) and rinse it with Hanks balanced salt solution.
2.2. Mince the excised SMG with scalpels or curved scissors in a labeled weighing boat, containing 1 ml of the CDB.
2.3. Transfer the gland homogenate to a 50 ml falcon tube and incubate in 4 ml CDB, in a 37°C water bath for 30 min.
2.4. After the digestion is complete, carefully pipette-out the CDB and replace with 6 ml of BSA incubation buffer.
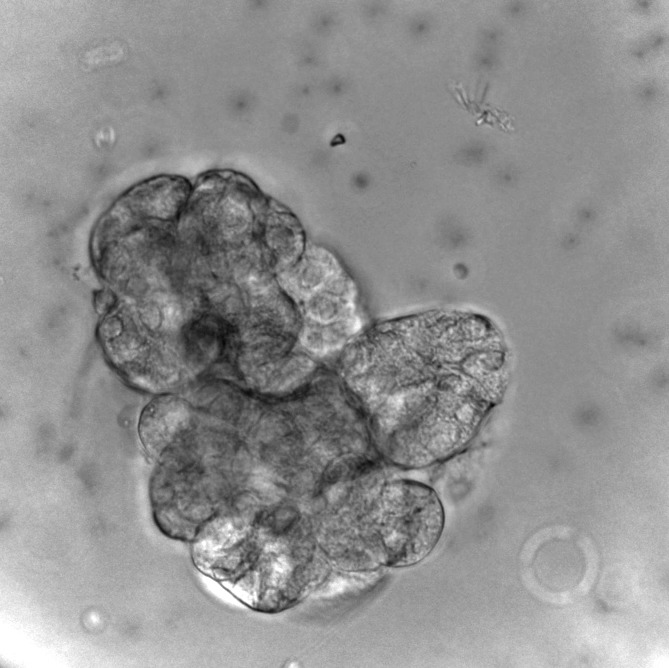
2.5. Shake the tube vigorously by hand for 10 s, in order to disperse the cells into smaller acinar units (Fig. 3).
2.6. Allow the acinar units to settle, then discard the supernatant and replace with HEPES buffer-containing Fura-2 AM.
- HINT: Care should be taken to remove the BSA buffer completely, followed by replacement with HEPES incubation buffer.
-
Dye loading
3.1. To prevent leakage of the dye from the cells, an organic anion transport blocker probenecid was added to the dye buffer to achieve a final concentration of 1 mM.
3.2. Incubate the acinar units (in the falcon tube) in 4 ml Fura-2 working solution in a CO2 incubator at 37°C for 1 h.
3.3. During this period, switch on the FlexStation and adjust the temperature to 37°C.
3.4. After one hour, wash the acinar units with HEPES buffer once.
3.5. Calculate the final HEPES buffer volume to be dispensed on the acinar units according to number of wells to be seeded, using the following formula: final HEPES buffer per gland = number of wells to be seeded × 75 (final volume/well in the assay plate).
3.6. After seeding the HEPES buffer/acinar units into the assay plate, cover it and place it into its allocated position in the FlexStation, until preparation of the compound plate is complete.
- CAUTION: Do NOT do this step in the CO2 incubator.HINT: (1) It is essential to take into consideration the importance of having relatively equal density of acinar units per well. To achieve pipetting the digested acinar units gently up and down frequently between each transfer of HEPES buffer/acinar units into the wells of the assay plate, we recommend performing this critical step near an inverted microscope to frequently check uniform density of the seeded acinar units; (2) Since probenecid also has effect on some ion channels, caution should be taken when interpreting data obtained from experiments that include probenecid in the assay buffer.
-
Compound plate preparation
4.1. Prepare the stock solutions of the cholinergic receptor agonist; carbachol (CCh) and the calcium ionophore; ionomycin (IM) in DMSO.
4.2. Prepare the intermediate and working solutions in DPBS (Table 1).
- CAUTION: (1) Since the FlexStation will be set-up to transfer 25 µl CCh followed by 25 µl IM, from the compound plate columns to the 75 µl buffer/acinar units’ columns in the assay plate. Accordingly, it is very important to take into consideration that determination of the final concentrations in the compound plate, depends on the buffer volume in the corresponding well of the assay plate, before the compound addition (Fig. 4); (2) It is very important to note that the compound concentration is subject to change after each compound addition (in experiments where multiple compounds are used).
-
FlexStation settings
5.1. Set-up the FlexStation 3 to record changes in calcium signals before (baseline) and after compound additions, as demonstrated in Table 2.
5.2. For baseline fluorescence reading, adjust the settings similar to that demonstrated in Table 2, except that: (1) select an endpoint read type; (2) do not select the compound transfer option.
5.3. Record emission ratios with excitation wavelengths of 340 and 380 nm every 6 s after compound applications, for 3 min.
5.4. Experimental data is processed directly using the SoftMax Pro software (otherwise it can be copied and pasted into any spreadsheet program, such as Microsoft Excel).
Figure 3. Representative example of the physiologic acinar units obtained in the present protocol following collagenase digestion.
Table 1.
Carbachol and ionomycin preparation.
| Intermediate | Final conc. (µM) in assay plate | Initial conc. (µM) in compound plate | CCh (µl) | IM (µl) | Buffer (µl) | |
|---|---|---|---|---|---|---|
| Carbachol stock solution (100 mM): 100 mg CCh in 5.47 ml DMSO | 1:100 in DPBS | 50 20 10 |
200 80 40 |
40 16 8 |
160 184 192 |
|
| Ionomycin stock solution (3 mM): 5 mg IM in 2.23 ml DMSO | No intermediate is required | 6 | 30 | 2 | 198 |
Figure 4. Step-wise illustration of compound plate preparation.
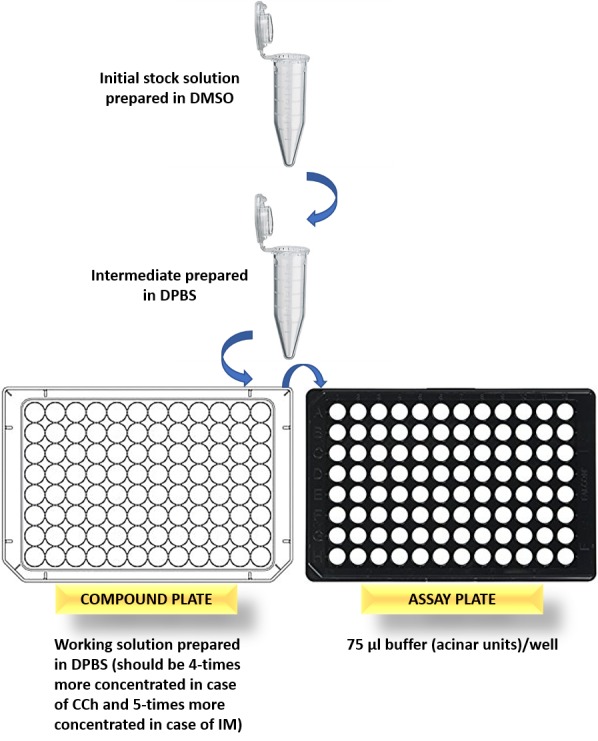
Table 2.
FlexStation settings.
| Read mode | FL |
| Read type | Flex |
| Category | |
| • Wavelength [2 wave length pairs] | Excitation: Lm1 340 nm Lm2 380 nm Emission: Lm1 510 Lm2 510 Auto cut-off |
| • Plate type | 96-well Corning half area flat clear bottom |
| • Read area settings | Select all (read the whole plate) |
| • PMT and optics settings | PMT gain: Medium Flashes per Read: 6 |
| • Timing settings | Total run time: 3 mins Interval: 6 secs Number of reads: 21 |
| • Compound transfer | |
| Number of transfers | 2 |
| Initial volume (µl) | Compound 1 (CCh): 75 Compound 2 (IM): 100 |
| Pipette height* | Compound 1 (CCh): 90 Compound 2 (IM): 100 |
| Volume | Compound 1 (CCh): 25 Compound 2 (IM): 25 |
| Rate (µl/sec)* | Compound 1 (CCh): 2 Compound 2 (IM): 2 |
| Time point | Compound 1 (CCh): 20 Compound 2 (IM): 120 |
| • Compound plate type | Costar 96 opaque 3 ml |
| • Pipette tips and layout | Subject to experimental condition |
| • Compound and tips column | Subject to experimental condition |
| No trituration (otherwise dislodgment of the Cell-Tak adherent cells will occur) | |
*The parameters for the integrated FlexStation pipettor require optimization for each assay. The dispensation height of the pipettor and the speed of dispensation should be adjusted to ensure optimal delivery of the compounds to the specific plates being used. Optimal delivery should not cause cell disruption but should allow adequate mixing of the compounds in the well. To assist adequate mixing of compounds, the volume of agonist added to the well is typically 25% of the final well volume. The optimal dispenser speed may vary according to how well cells adhere to the bottom of the well [21].
RESULTS
Carbachol is a cholinergic agonist which evokes intracellular Ca2+ signaling by increasing IP3 concentrations and releasing Ca2+ from the ER stores [22]. On the other hand, ionomycin is known to increase [Ca2+]i in virtually all cell types, including salivary acinar cells, via globally depleting Ca2+ from all intracellular stores [17,23]. Fura-2 ratiometric properties can be depicted in real time through the dual excitation wavelength capability of the FlexStation. Figure 5 exemplifies the raw graph obtained using the SoftMax Pro software and demonstrates that when Fura-2 is excited at 340 nm, its emission is raised with increasing Ca2+ concentration, whereas when excited at 380 nm, Fura-2 emission is decreased with increasing Ca2+ concentration. Changes in the 340/380 ratio will reflect changes in intracellular-free Ca2+ concentrations.
Figure 5. Schematic illustration of intracellular calcium changes as recorded by flexstation at 340 and 380 nm.
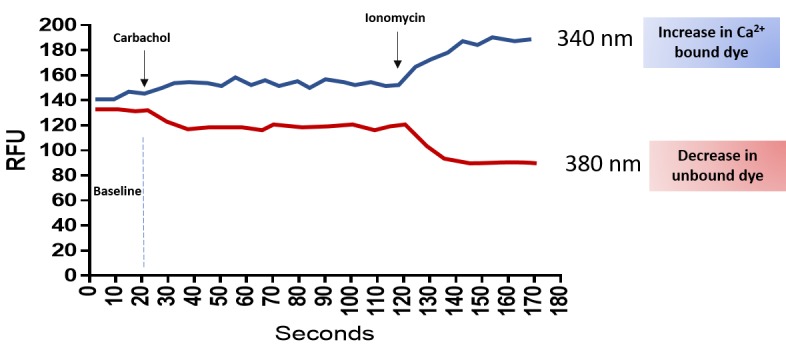
The raw data depicts the typical signals obtained from a fura-2-loaded cell when it is excited at 340 and 380 nm. Agonist stimulation will cause an increase in the 340 nm signal and a decrease in the 380 nm signal. Addition of an ionophore (Ionomycin) will release Ca2+ from all intracellular stores and will result in the F340max and F380min.
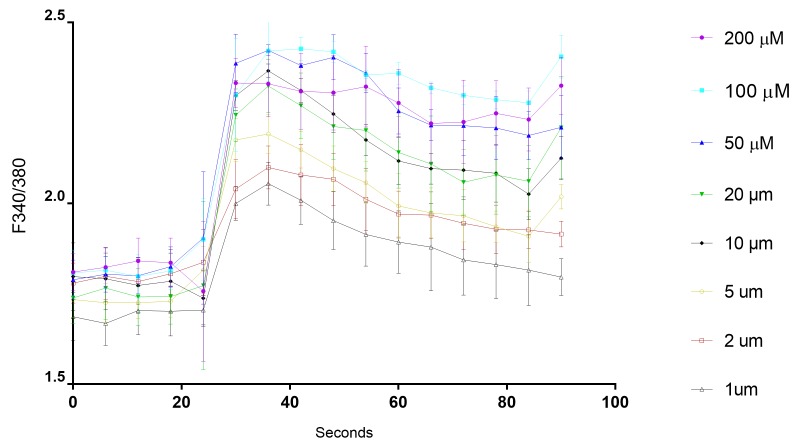
In the present experiments, the processed data (F340/380) revealed that CCh induced a dose-dependent increase of [Ca2+]i levels. Prompt [Ca2+]i mobilization from the acinar ER stores in response to CCh was reflected as a fluorescence signal spike, that peaked for 12 s after the secretagogue application. This peak was then followed by a plateau phase, remarkably higher than the resting [Ca2+]i, which usually had Ca2+ oscillations superimposed on it (Fig. 6). The rapid initial increase in [Ca2+]i due to the activation of muscarinic receptors by agonists has been shown to be mediated through the release of IP3 and the subsequent mobilization of Ca2+ from internal stores [24]. Previous studies have shown that the early Ca2+ oscillations following CCh stimulation were originated from the ER, by the interplay of repetitive releases and re-uptake of Ca2+ by IP3-dependent Ca2+ channels and SERCA pump activity, respectively [7].
Figure 6. Analysis of calcium mobilization in mouse SMG acinar units.
FlexStation 3 was set-up to add CCh after 20 s of baseline measurement. Supraphysiological (200-2 µM) and physiological (1 µM) carbachol concentrations stimulated calcium release from the ER in a dose-dependent manner. Generally, the most prominent acinar responses were perceived with the supraphysiological CCh doses. Data represent the 340/380 ratios recorded for 90 s by FlexStation 3.
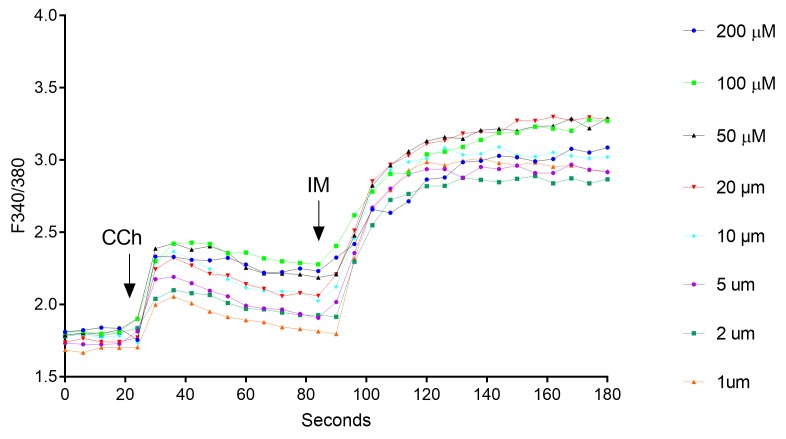
The Ca2+ ionophore ionomycin is a pharmacological tool with which to evoke changes in [Ca2+]i which bypass the receptor-operated mechanisms [25]. As a positive control, IM (6 µM) was added to the acinar units to demonstrate the global Ca2+ release from intracellular stores. As seen in Figure 7, addition of IM induced a fast F 340/380 peak followed by a rising plateau phase. Previous studies demonstrated that IM increases submandibular acinar [Ca2+]i via two pathways in a concentration-dependent manner. One is the Ca2+/H+ exchange, which is mediated by a high concentration of IM, such as 5 µM. The other is the store-operated Ca2+ entry channels (SOCs), which are activated by a low concentration of IM, such as 1 µM [24].
Figure 7. Representative graph showing enhancement of the 340/380 ratios in response to 6 µM ionomycin.
FlexStation 3 was set-up to add the IM 70 s after CCh application.
TROUBLESHOOTING
The present study has shown that a multimode plate reader with integrated fluidics (Flexstation 3) can be used to make multiple and repeated measurements of intracellular Ca2+ in order to determine the responsiveness of salivary gland acini to changing concentrations of autonomimetics. This approach allows the study of cells in their native conformation, avoiding the problems associated with single cell dispersions and immortalized cell lines. However, a limitation of acutely isolated cells of this type cannot be used over an extended period of time and experiments should be performed on the day of preparation. Future studies could be undertaken in order to determine the applicability of this protocol to other exocrine glands. Furthermore, changes to the tissue preparation protocol might enable use of the technique to organ cultures of embryonic salivary glands or salivary tissue grown in vitro on different scaffolds. Table 3 provides the most common problems that can encountered during performance of this protocol.
Table 3.
Troubleshooting.
| Step | Problems | Causes | Suggestions |
|---|---|---|---|
| Assay plate preparation |
|
|
|
| Isolation and preparation of the SMGs |
|
|
|
| Dye loading |
|
|
|
Acknowledgments
Abeer Shaalan was a self-funded PhD student and received additional funding from a King’s College London Dental Institute top-up grant.
References
- 1.Proctor GB, Carpenter GH. (2014) Salivary secretion: mechanism and neural regulation. Monogr Oral Sci 24: 14-29. doi: 10.1159/000358781. PMID: [DOI] [PubMed] [Google Scholar]
- 2.Berridge MJ. (1993) Inositol trisphosphate and calcium signalling. Nature 361: 315-325. doi: 10.1038/361315a0. PMID: [DOI] [PubMed] [Google Scholar]
- 3.Melvin JE, Yule D, Shuttleworth T, Begenisich T. (2005) Regulation of fluid and electrolyte secretion in salivary gland acinar cells. Annu Rev Physiol 67: 445-469. doi: 10.1146/annurev.physiol.67.041703.084745. PMID: [DOI] [PubMed] [Google Scholar]
- 4.Mikoshiba K. (2007) The IP3 receptor/Ca2+ channel and its cellular function. Biochem Soc Symp 74: 9-22. doi: 10.1042/BSS0740009. PMID: [DOI] [PubMed] [Google Scholar]
- 5.Putney JW., Jr (1990) Capacitative calcium entry revisited. Cell Calcium 11: 611-624. doi: 10.1016/0143-4160(90)90016-N. PMID: [DOI] [PubMed] [Google Scholar]
- 6.Dawson LJ, Fox PC, Smith PM. (2006) Sjogrens syndrome--the non-apoptotic model of glandular hypofunction. Rheumatology (Oxford) 45: 792-798. doi: 10.1093/rheumatology/kel067. PMID: [DOI] [PubMed] [Google Scholar]
- 7.Petersen OH, Tepikin AV. (2008) Polarized calcium signaling in exocrine gland cells. Annu Rev Physiol 70: 273-299. doi: 10.1146/annurev.physiol.70.113006.100618. PMID: [DOI] [PubMed] [Google Scholar]
- 8.Tepikin AV, Voronina SG, Gallacher DV, Petersen OH. (1992) Pulsatile Ca2+ extrusion from single pancreatic acinar cells during receptor-activated cytosolic Ca2+ spiking. J Biol Chem 267: 14073-14076. PMID: [PubMed] [Google Scholar]
- 9.Mogami H, Tepikin AV, Petersen OH. (1998) Termination of cytosolic Ca2+ signals: Ca2+ reuptake into intracellular stores is regulated by the free Ca2+ concentration in the store lumen. EMBO J 17: 435-442. doi: 10.1093/emboj/17.2.435. PMID: [DOI] [PMC free article] [PubMed] [Google Scholar]
- 10.Liu X, Ambudkar IS. (2001) Characteristics of a store-operated calcium-permeable channel: sarcoendoplasmic reticulum calcium pump function controls channel gating. J Biol Chem 276: 29891-29898. doi: 10.1074/jbc.M103283200. PMID: [DOI] [PubMed] [Google Scholar]
- 11.Paredes RM, Etzler JC, Watts LT, Zheng W, Lechleiter JD. (2008) Chemical calcium indicators. Methods 46: 143-151. doi: 10.1016/j.ymeth.2008.09.025. PMID: [DOI] [PMC free article] [PubMed] [Google Scholar]
- 12.Hirst RA, Harrison C, Hirota K, Lambert DG. (2005) Measurement of [Ca²+]i in whole cell suspensions using fura-2. Methods Mol Biol 312: 37-45. doi: 10.1385/1-59259-949-4:037. PMID: [DOI] [PubMed] [Google Scholar]
- 13.Kopp RF, Leech CA, Roe MW. (2013) Resveratrol interferes with fura-2 intracellular calcium measurements. J Fluoresc 24: 279-284. doi: 10.1007/s10895-013-1312-9. PMID: [DOI] [PMC free article] [PubMed] [Google Scholar]
- 14.Valentine WJ, Tigyi G. (2012) High-throughput assays to measure intracellular Ca²+ mobilization in cells that express recombinant S1P receptor subtypes. Methods Mol Biol 874: 77-87. doi: 10.1007/978-1-61779-800-9_7. PMID: [DOI] [PMC free article] [PubMed] [Google Scholar]
- 15.Liao B, Zheng Y, Yadav VR, Korde AS, Wang Y. (2010) Hypoxia induces intracellular Ca2+ release by causing reactive oxygen species-mediated dissociation of FK506-binding protein 12.6 from ryanodine receptor 2 in pulmonary artery myocytes. Antioxid Redox Signal 14: 37-47. doi: 10.1089/ars.2009.3047. PMID: [DOI] [PMC free article] [PubMed] [Google Scholar]
- 16.Alberto AV, Faria RX, Menezes JR, Surrage A, Rocha NC, et al. (2016) Role of P2 receptors as modulators of rat eosinophil recruitment in allergic inflammation. PLoS One 11:e0145392. Epub PubMed Central PMCID: doi: 10.1371/journal.pone.0145392. PMID: [DOI] [PMC free article] [PubMed] [Google Scholar]
- 17.Mason MJ, Grinstein S. (1993) Ionomycin activates electrogenic Ca2+ influx in rat thymic lymphocytes. Biochem J 296: 33-39. PMID: [DOI] [PMC free article] [PubMed] [Google Scholar]
- 18.Ambudkar IS. (2015) Calcium signalling in salivary gland physiology and dysfunction. J Physiol 594: 2813-2824. doi: 10.1113/JP271143. PMID: [DOI] [PMC free article] [PubMed] [Google Scholar]
- 19.Waite JH, Tanzer ML. (1981) Polyphenolic substance of mytilus edulis: Novel adhesive containing L-Dopa and hydroxyproline. Science 212: 1038-1040. doi: 10.1126/science.212.4498.1038. PMID: [DOI] [PubMed] [Google Scholar]
- 20.Waite JH. (1983) Evidence for a repeating 3,4-dihydroxyphenylalanine- and hydroxyproline-containing decapeptide in the adhesive protein of the mussel, Mytilus edulis L. J Biol Chem. 1983 258: 2911-2915. Epub 258: 2911-5. PMID: [PubMed] [Google Scholar]
- 21.Marshall ICB, Boyfield I, McNulty S. (2005) Ratiometric Ca2+ measurements using the FlexStation® Scanning Fluorometer. Methods Mol Biol 312: 119-124. doi: 10.1385/1-59259-949-4:119. PMID: [DOI] [PubMed] [Google Scholar]
- 22.Martinussen HJ, Waldenström A, Ronquist G. (1995) Carbachol-induced increase in inositol trisphosphate (IP3) content is attenuated by adrenergic stimulation in the isolated working rat heart. Acta Physiol Scand 153: 151-158. doi: 10.1111/j.1748-1716.1995.tb09846.x. PMID: [DOI] [PubMed] [Google Scholar]
- 23.Putney JW., Jr (1986) A model for receptor-regulated calcium entry. Cell Calcium 7: 1-12. doi: 10.1016/0143-4160(86)90026-6. PMID: [DOI] [PubMed] [Google Scholar]
- 24.Berridge MJ, Irvine RF. (1989) Inositol phosphates and cell signalling. Nature 341: 197-205. doi: 10.1038/341197a0. PMID: [DOI] [PubMed] [Google Scholar]
- 25.Yang CM, Chou SP, Wang YY, Hsieh JT, Ong R. (1993) Muscarinic regulation of cytosolic free calcium in canine tracheal smooth muscle cells: Ca2+ requirement for phospholipase C activation. Br J Pharmacol 110: 1239-1247. PMID: [DOI] [PMC free article] [PubMed] [Google Scholar]


