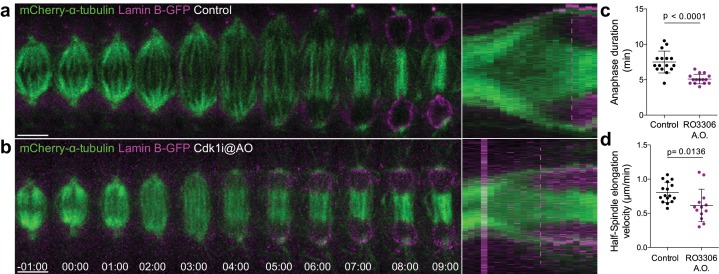
Figure 2. Cdk1 inhibition at anaphase onset accelerates NER.
(a) and (b) Control and Cdk1-inhibited Drosophila S2 cells at anaphase onset (A.O.) stably expressing Lamin B-GFP/mCherry-α-tubulin. Scale bars are 5 μm. Time is in min:sec. Panels on the right side show the corresponding collapsed kymographs. Dashed lines indicate the moment of NER. (c) and (d) Quantification of anaphase duration (control n=16 cells; Cdk1i n=15 cells) and half-spindle elongation velocity (control n=16 cells; Cdk1i, n=13 cells), respectively, in the conditions shown in (a) and (b). Statistical significance was tested with an unpaired t-test.


