

Abstract
Aims:
Current estimated glomerular filtration rate (eGFR) equations may be inaccurate in patients with spina bifida (SB) because of reduced muscle mass and stature. Cross-sectional and longitudinal variability of eGFR were analyzed in these patients across multiple equations, hypothesizing greater variability in creatinine-based than cystatin-C-based equations.
Methods:
This retrospective cohort study included children (ages 1–17.9 years) and adults (≥18 years) with SB from 2002–2017 at a large SB clinic. Those without all data needed to calculate eGFR were excluded. Four pediatric and three adult eGFR equations were compared for cross-sectional outcomes of eGFR and elevated office blood pressures using chronic kidney disease (CKD) stage classification, and for longitudinal outcome of eGFR slope over time using covariance pattern models accounting for repeated measures.
Results:
182 children and 75 adults had ≥1 set of data measurements; 118 and 52, respectively, had ≥2 sets. The pediatric bedside Schwartz equation had the highest median eGFR and coefficient of variation. CKD stage classification by eGFR showed large differences across equations in children, with rates of eGFR<60 and <90 mL/min/1.73m2 ranging from 2–9% and 5–69%, respectively. Only one equation showed a significant inverse association between eGFR and blood pressure. Longitudinally, eGFR slopes over time were different across pediatric equations (p<0.001) but not adult equations. The bedside Schwartz equation had a positive eGFR slope; the other cystatin-C-containing equations had negative slopes.
Conclusions:
Creatinine-based equations in children with SB vary considerably from cystatin-C-containing equations in calculating both single point-in-time eGFR values and eGFR trends over time.
Keywords: glomerular filtration rate, spina bifida, chronic kidney disease, myelomeningocele
Introduction:
Spina bifida (SB) is the most common, permanently disabling birth defect in the United States.1,2 Affected children are at lifetime risk for progressive multi-organ dysfunction. Chronic kidney disease (CKD) occurs in patients with SB because of neurogenic bladder dysfunction. Timely diagnosis of CKD is critical to prevent or delay associated complications, including cardiovascular disease,3 hypertension,4 fractures,5 impaired neurocognition,6 poor growth,7 progression to end stage renal disease, and death.8
The current standard of care for CKD detection relies on equations to calculate estimated glomerular filtration rate (eGFR). In children, equations frequently incorporate serum creatinine, which comes from muscle mass, and height.9 Because patients with SB may have abnormal muscle mass and height, such eGFR equations may not be accurate.10 Serum cystatin-C (Cys-C) is considered more sensitive in estimating kidney function in patients with SB, but is less available and is costlier than serum creatinine.10,11 Arm span is frequently used to approximate height in non-ambulatory patients, but may overestimate by 5–6%.12 Although several pediatric equations9,13 espoused by the National Kidney Foundation (NKF) incorporate creatinine, Cys-C, and/or height to calculate eGFR, they were not derived in patients with SB. One non-NKF-supported estimating equation was developed specifically for children with SB, but it was derived in 11 patients.14 None of three adult equations promoted by the NKF were derived in patients with SB.15,16
In this study, cross-sectional and longitudinal analyses were used to investigate whether the use of different eGFR equations results in different CKD staging of patients with SB and affects correlation with office-based blood pressure measurements. Creatinine-based eGFR equations were hypothesized to exhibit greater variability than those that incorporate Cys-C.
Materials and Methods:
Study Design and Population
A retrospective cohort study was conducted using data gathered from 2002–2017 at a large multi-disciplinary SB clinic at a free-standing children’s hospital. Patients were stratified into two age groups: children (ages 1–17.9 years) and adults (≥18 years). Patients with at least one set of data, including age, race, sex, height, serum creatinine, serum Cys-C, and serum blood urea nitrogen (BUN), were included in the cross-sectional analysis. For patients in whom standing height or length could not be obtained, arm span as measured from the back, fingertip to fingertip, with arms parallel to the ground, was used as a surrogate for height. Patients were excluded who did not have all measurements, were <1-year-old because of rapidly-changing eGFR, and were on renal replacement therapy.
Patients with at least two sets of data were included in the longitudinal analysis. The institutional review board approved this study as part of a larger prospective study, for which informed consent was obtained from all participants.
Outcomes
Cross-sectional Analysis:
The primary outcome was eGFR. In children9,13 and adults,15,16 respectively, the three and three equations (Supplemental Table 1) espoused by the NKF were used to calculate eGFR, incorporating creatinine-only, Cys-C-only, or both. For children, an additional fourth equation was used, the Zappitelli equation which incorporates creatinine and Cys-C and has a modifier term for SB.14
Secondary outcomes included systolic (SBP) and diastolic blood pressures (DBP). Automated blood pressures (BP) were measured in the office per standard clinical practice using an appropriately sized cuff; abnormal readings were checked manually. BP readings were derived from the same office visit as height measurements. In children, BP were converted to age-, sex-, and height-adjusted percentiles according to the Fourth Report17 and were assessed as continuous outcomes and binary outcomes, with elevated BP defined as either SBP or DBP >90th percentile and hypertension defined as >95th percentile. For adults, elevated BP was defined as SBP or DBP >120 mmHg or >80 mmHg, respectively. Hypertension was defined as SBP or DBP >140 mmHg or >90 mmHg, respectively.
Longitudinal Analysis:
The primary outcome was eGFR measured over time. The same four pediatric and three adult estimating equations were used to calculate eGFR. In primary analyses, patients at least 18 years old at any recorded visit were considered in adult models with eGFR calculated from the 3 adult equations.
Covariates
Additional variables were age at eGFR measurement (centered on date of laboratory values), sex, race, ethnicity, ambulatory status, and spina bifida type (myelomeningocele versus non-myelomeningocele). Ambulatory status was a binary covariate based on the Hoffer classification,18 with community ambulators classified as ambulatory and all other groups as non-ambulatory.
Statistical Analysis
Descriptive statistics were used to characterize the pediatric and adult cohorts. Mixed models with fixed effect for equation and random effect for subject were used to compare mean eGFR values. Variability in eGFR across estimating equations was analyzed using coefficients of variation (CV) and CKD stage classification with eGFR<60 and <90 mL/min/1.73m2, which correspond to at least CKD stages 3 and 2, respectively. A subgroup analysis considered similar methods stratified by spina bifida type and ambulatory status. Pairwise associations between eGFR values from equations were assessed via Spearman correlation and Bland-Altman plot analyses for visual differences in eGFR between equations. Spearman correlation was used to assess associations between eGFR and SBP/DBP percentiles. Logistic regression models fit associations between eGFR and presence of elevated BP or hypertension in children and adults.
Changes in eGFR over time were compared across equations using covariance pattern models with robust variance estimators, to account for repeated measures. Each model included fixed effects for time, equation, and their interaction, with a specified compound symmetry pattern. Time was considered as a continuous covariate, determined as the duration, in months, from the latest laboratory value of the first set of data (baseline) to the earliest laboratory value of the next set of data. The p-value for the interaction term indicates if the average eGFR slopes are significantly different across equations. Separate models were fit for children and adults. Estimated slopes for each equation were reported for a one-year increase in time, with corresponding 95% confidence intervals.
In sensitivity analyses, the longitudinal analysis was restricted to children and adults who had at least three sets of data, and patients who turned 18 years old during follow-up were re-categorized as children and used the pediatric eGFR equations for all timepoints.
All analyses were performed with SAS version 9 (SAS Institute, Inc., Cary, NC, USA), and all statistical tests assumed a two-sided type one error rate of 0.05.
Results:
Cohort characteristics
Out of ~600 total patients seen annually in clinic, 182 children (43% male with median (interquartile range [IQR]) age of 9.1 (5.2–13.2) years) and 75 adults (45% male with median (IQR) age of 20.2 (18.7–22.9) years) were included in the cross-sectional analysis (Table 1). Of these, 144 children (79%) and 62 adults (83%) had myelomeningocele. Most patients had all pertinent eGFR data collected on the same day.
Table 1.
Cohort characteristics.
| Variable | Children | Adult |
|---|---|---|
| No. | 182 | 75 |
| Age, year | 9.1 (5.2–13.2) | 20.2 (18.7–22.9) |
| Male | 79 (43) | 34 (45) |
| Race | ||
| White | 96 (53) | 44 (59) |
| Black | 19 (10) | 7 (9) |
| Other | 67 (37) | 24 (32) |
| Hispanic | 66 (36) | 24 (32) |
| Myelomeningocele | 144 (79) | 62 (83) |
| Blood pressure | ||
| Elevated blood pressure | 53 (29) | 23 (31) |
| Hypertension | 32 (18) | 7 (9) |
| No. of Sets of Data Timepoints | ||
| 1 | 64 (35) | 23 (31) |
| 2 | 52 (29) | 32 (43) |
| 3 | 49 (27) | 14 (19) |
| 4 | 17 (9) | 6 (8) |
All values are median (interquartile range) or number (%).
118 children (65%) and 52 adults (69%) were included in the longitudinal analysis. The median (range) time between the first and last sets of measurements were 24.6 (4.2–59.2) months for children and 22.0 (7.4–38.7) months for adults.
Cross-sectional Analysis
Mean values of eGFR were different across equations in children and adults (p<0.001). Among children, the median eGFR ranged from 83–144 mL/min/1.73m2 across equations (Table 2). The bedside Schwartz equation gave the highest median eGFR and the highest CV (31.0) when comparing to other pediatric equations. On CKD stage classification, the equations provided wide ranges of prevalence of CKD stages. The bedside Schwartz versus Zappitelli equations classified 5% versus 69% of the children as having eGFR <90 mL/min/1.73m2, respectively, and 2% versus 9% of the children as having eGFR <60 mL/min/1.73m2, respectively. Among adults, median eGFR ranged from 116–139 mL/min/1.73m2 with most CVs around 20. The proportions of CKD stages ranged from 4–17% for at least CKD stage 2 and 1–4% for at least CKD stage 3.
Table 2.
eGFR values (in mL/min/1.73m2) from various estimating equations among the same patients.
| Cr or Cys-C | Median | IQR | CV | eGFR <60, n (%) | eGFR <90, n (%) | |
|---|---|---|---|---|---|---|
| Children (n=182) | ||||||
| Bedside | Cr | 144 | 120–167 | 31.0 | 3 (2) | 9 (5) |
| Schwartz Cys-C | Cys-C | 86 | 78–96 | 22.3 | 8 (4) | 108 (59) |
| CKiD | Both | 109 | 97–121 | 19.8 | 4 (2) | 28 (15) |
| Zappitelli | Both | 83 | 70–93 | 21.8 | 17 (9) | 126 (69) |
| Adult (n=75) | ||||||
| CKD-EPI-Cr | Cr | 139 | 127–150 | 18.2 | 1 (1) | 3 (4) |
| CKD-EPI-Cys-C | Cys-C | 116 | 98–125 | 21.2 | 3 (4) | 13 (17) |
| CKD-EPI | Both | 129 | 113–141 | 20.0 | 2 (3) | 6 (8) |
CKiD = chronic kidney disease in children cohort study; CKD-EPI = chronic kidney disease-epidemiology collaboration study; Cr = creatinine; Cys-C = cystatin-C; IQR = interquartile range; CV = coefficient of variation; eGFR = estimated glomerular filtration rate
Greater variation was observed in CKD stage classification across equations in children with myelomeningocele versus those with non-myelomeningocele (Supplemental Table S2). The creatinine-only-based equations had higher CVs in the myelomeningocele versus non-myelomeningocele group. Greater variation was also observed in CKD stage classification across equations in children with non-ambulatory versus ambulatory status (Supplemental Table S3).
Pairwise Spearman correlation analyses showed most equations had positive correlation except for the pediatric Zappitelli equation, which had no correlation with the CKiD equation and negative correlation with the bedside Schwartz equation (Supplemental Table S4). Pairwise Bland-Altman plot analyses showed absolute value mean biases ranging from 5.3 to 65.0 for children and 13.2 to 28.5 for adults.
Of the 182 children, 53 (29%) had elevated BP and 32 (18%) had hypertension (Table 3). Of the 75 adults, 23 (31%) had elevated BP and 7 (9%) had hypertension. In children, significant negative correlation was found between eGFR and adjusted SBP/DBP percentiles only for the Zappitelli estimating equation (Supplemental Table S5). When BP was assessed as a dichotomous outcome, only the Zappitelli equation found an inverse association between eGFR and odds of both elevated BP and hypertension (Table 3). None of the adult eGFR equations were found to be associated with BP.
Table 3.
Association of eGFR and hypertension or elevated blood pressure in children and adults.
| Outcome | Odds Ratio | 95% CI | p-value | |
|---|---|---|---|---|
| Children | ||||
| Bedside Schwartz | Hypertension | 1.00 | 0.99–1.01 | 0.74 |
| Elevated Blood Pressure | 1.00 | 0.997–1.01 | 0.34 | |
| Schwartz Cys-C | Hypertension | 0.99 | 0.97–1.01 | 0.51 |
| Elevated Blood Pressure | 1.00 | 0.98–1.02 | 0.83 | |
| CKiD | Hypertension | 1.00 | 0.98–1.02 | 0.99 |
| Elevated Blood Pressure | 1.00 | 0.99–1.02 | 0.58 | |
| Zappitelli | Hypertension | 0.97 | 0.95–0.997 | 0.03 |
| Elevated Blood Pressure | 0.98 | 0.96–0.997 | 0.02 | |
| Adult | ||||
| CKD-EPI-Cr | Hypertension | 1.03 | 0.99–1.07 | 0.17 |
| Elevated Blood Pressure | 1.00 | 0.98–1.02 | 0.67 | |
| CKD-EPI-Cys-C | Hypertension | 0.99 | 0.96–1.02 | 0.41 |
| Elevated Blood Pressure | 0.99 | 0.97–1.01 | 0.41 | |
| CKD-EPI-both | Hypertension | 1.00 | 0.97–1.03 | 1.00 |
| Elevated Blood Pressure | 0.99 | 0.97–1.01 | 0.42 |
CI = confidence interval; CKiD = chronic kidney disease in children cohort study; CKD-EPI = chronic kidney disease-epidemiology collaboration study; Cr = creatinine; Cys-C = cystatin-C; eGFR = estimated glomerular filtration rate
Longitudinal Analysis
Among children, eGFR slopes over time were significantly different across equations (p<0.001; Figure 1 and Table 4), depending on whether creatinine, Cys-C, or both were included in the estimating equation. A positive eGFR slope (1.0 mL/min/1.73m2 per year) was estimated for the creatinine-only-based bedside Schwartz equation. When Cys-C was added to creatinine, the eGFR slope was negative (−1.7 mL/min/1.73m2 per year); when Cys-C alone was considered, the eGFR slope was the most negative (−5.0 mL/min/1.73m2 per year).
Figure 1.
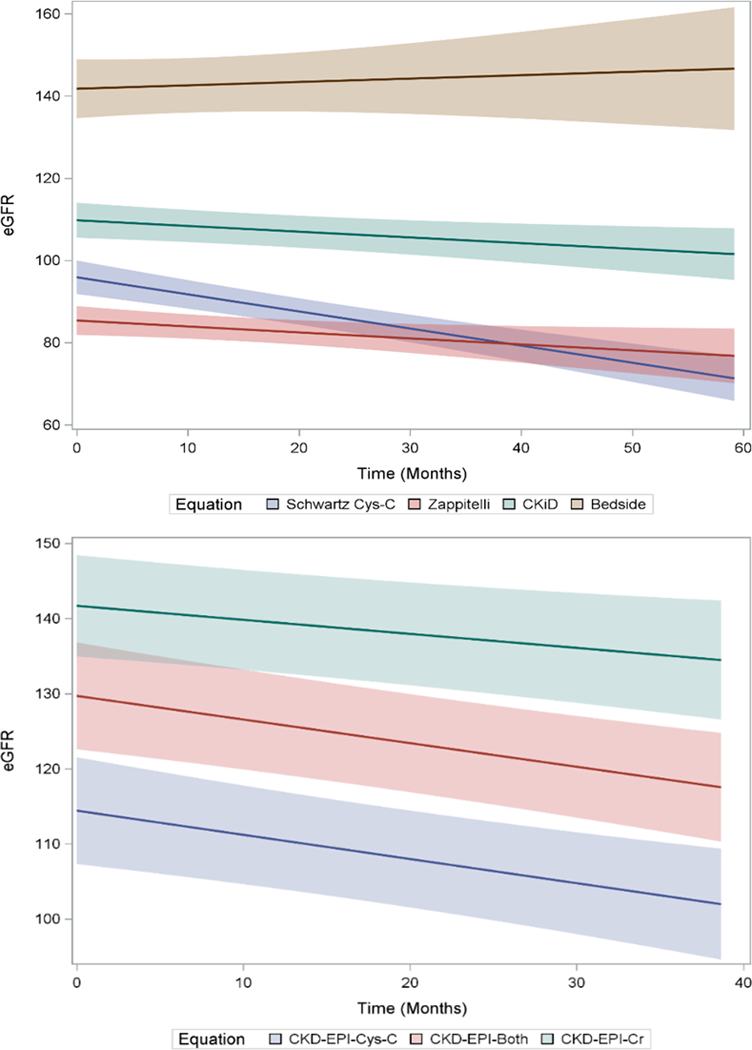
Longitudinal trends in eGFR by estimating equation in children and adults with 2+ timepoints.
Top: eGFR slopes in 118 children with 2+ time points.
Bottom: eGFR slopes in 52 adults with 2+ time points.
Table 4.
eGFR slope estimates among children and adults with 2+ timepoints.
| eGFR slope (mL/min/1.73m2 per year) | 95% CI | p-value | |
|---|---|---|---|
| Children (n=118) | |||
| Bedside Schwartz | 1.0 | (−2.3, 4.3) | <0.001 |
| Schwartz Cys-C | −5.0 | (−6.4, −3.6) | |
| CKiD | −1.7 | (−3.0, −0.3) | |
| Zappitelli | −1.7 | (−3.4, −0.1) | |
| Adult (n=52) | 0.22 | ||
| CKD-EPI-Cr | −2.2 | (−4.0, −0.5) | |
| CKD-EPI-Cys-C | −3.9 | (−5.9, −1.8) | |
| CKD-EPI-both | −3.8 | (−5.6, −1.9) |
P-value is a test for interaction between time and equation.
CI = confidence interval; CKiD = chronic kidney disease in children cohort study; CKD-EPI = chronic kidney disease-epidemiology collaboration study; Cr = creatinine; Cys-C = cystatin-C; eGFR = estimated glomerular filtration rate
Among adults, all eGFR slopes were negative; no significant differences were detected across equations (p=0.22).
The sensitivity analysis of children and adults with at least 3 timepoints provided similar results both in slope direction, magnitude, and in tests for interaction (Supplemental Figure S1 and Table S6). The sensitivity analysis where patients who aged into adulthood during follow-up were re-categorized as children also showed similar results to the primary analysis.
Discussion:
Considerable variation was observed in eGFR measurements across estimating equations in patients with SB. In children, creatinine-only-based eGFR estimating equations had the most variability in cross-sectional eGFR values. Creatinine-only-based estimating equations indicated a positive eGFR slope over time, while equations that incorporate Cys-C had negative slopes. In adults, eGFR equations were more consistent. These results suggest that the equation used to calculate eGFR affects how CKD is staged in children, which may influence medical management and surgical interventions.
Assessments of the clinical course of CKD rely on eGFR. In the present study, the creatinine-based pediatric bedside Schwartz equation had the highest coefficient of variation, the highest median eGFR value, and the lowest proportion of children categorized into at least CKD stages 2 and 3. Values from the Zappitelli equation categorized 69% and 9% of these same children into at least CKD stages 2 and 3, respectively. The discrepancy appears greater among patients with myelomeningocele compared to non-myelomeningocele diagnoses, and with non-ambulatory compared to ambulatory status, likely due to the higher inaccuracy of serum creatinine and height.19 For example, in the present study, 16% more children with non-ambulatory status would be upgraded to CKD stage 3 with the Zappitelli equation compared to the bedside Schwartz equation, compared to a corresponding increase of 4% in ambulatory children (Supplemental Table 3). These results confirm and support prior research on the variability of eGFR from current estimating equations in patients with SB. Two studies, one11 of which was a subset of the other with 131 children with SB,20 compared the creatinine-based bedside Schwartz equation against a different Zappitelli Cys-C-based equation (lacking the modifier term for SB). The authors found in both studies that mean eGFR was significantly higher with the creatinine-based than the Cys-C-based equation, with 26% upgrading of CKD stage with the latter equation. Taken together, the cross-sectional results from our and data from prior studies suggest there is wide variability in assessments of eGFR across existing formulas. Using different equations to calculate eGFR, especially in patients with myelomeningocele diagnosis or who are non-ambulatory, could have different implications for how a patient is treated.
As point-in-time estimates may be less reliable, the performance of equations was also considered using repeated measurements taken over time. The direction and magnitude of eGFR change over time were found to be significantly different across equations for children with SB. The creatinine-based pediatric bedside Schwartz equation was the only equation that conferred a positive slope in eGFR over time. Conversely, the other three pediatric equations that incorporate Cys-C conferred a negative slope in eGFR over time. The negative slopes exhibited a step-wise pattern, depending on whether creatinine was added to Cys-C in the equations. Thus, if only serum creatinine (and not Cys-C) were checked serially in children with SB, the bedside Schwartz equation would give the impression that overall kidney function was improving over time, when in fact the opposite may be true had Cys-C also been checked. Notably, the magnitudes of eGFR decline that were observed in the present study (−1.7 to −5.0 mL/min/1.73m2 per year) are larger than the mean eGFR decline (−1.3 mL/min/1.73m2 per year) reported in a cohort of children with non-glomerular CKD but without SB.21 The large magnitude of eGFR decline in children with SB in the present study requires validation and underscores the need to improve the diagnosis and prevention of CKD in this vulnerable population.
Hypertension is a well-known cause and downstream effect of CKD. In children without SB who have CKD, higher baseline BPs were associated with faster rates of eGFR decline.21 Patients with SB are also at elevated risk for developing hypertension.22,23 In the present study, 30% of children with SB were found to have elevated BP >90th percentile and 18% had >95th percentile. An association was found between eGFR and high BP using the only equation that was derived in children with SB, the Zappitelli equation. None of the other equations, including the CKiD equation that utilizes both creatinine and Cys-C, were associated with either BP percentile as a continuous outcome, nor elevated BP as binary outcomes. Although the derivation cohort for the Zappitelli equation contained only 11 patients with SB,14 that this equation was the only one correlated with elevated BP in our study population increases its potential validity relative to other equations, but requires additional study.
The present study has several strengths. The sample size of 182 children with SB is the largest pediatric cohort with eGFR values to date. In addition, eGFR equations were assessed in 75 adults with SB. Cross-sectional eGFR values and eGFR trends over time across equations were compared, which had not been previously studied. Fourth, eGFR equations were compared that incorporate creatinine-only, Cys-C-only, and both variables, including equations espoused by the NKF to be used in patients with CKD.
The present study has limitations. Data are retrospective, and there may be selection biases and unmeasured confounders. For example, compliance with and concurrent prescriptions for anti-hypertensive medications were not accurately captured. However, as an association between higher BP and lower eGFR is expected,4,21 the present study was seeking to test which eGFR equation was sensitive enough to detect this expected association. Healthier patients who did not undergo kidney function measurements were excluded. The subgroup analyses, however, suggest that patients with myelomeningocele diagnoses or who were non-ambulatory may be most vulnerable and should be targeted. Furthermore, since eGFR values were compared from different equations within the same patients, any bias should be uniform and non-differential. A gold-standard measure of kidney function was lacking, against which to compare the estimating equations, and the number of eGFR equations compared was not exhaustive. The goal of the present study was to compare existing, commonly-used, NKF-espoused estimating equations against one another and not to compare against a gold-standard, which requires future research. Third, the present study results did not adjust for any active urinary tract infections or dehydration which may occur frequently in patients with SB. However, as all results were derived from an outpatient clinic setting, the participants were not acutely ill with these possible conditions to require hospitalization. Lastly, as the data come from a single, large, tertiary referral center, the results are not necessarily generalizable and must be validated externally.
Conclusions:
In conclusion, significant variability was demonstrated in estimates of kidney function among children with SB using contemporary eGFR equations. The variability of current eGFR equations, and in particular creatinine-only-based equations, was notable on cross-sectional and longitudinal analyses. These results highlight the need to improve methods of accurately assessing kidney function and CKD in children with SB. Future studies with a gold standard are needed to determine the most accurate eGFR equation.
Supplementary Material
Acknowledgments
Funding source: Dr. Isakova was supported by R01DK110087 from the National Institutes of Health (NIH)/NIDDK. The NIH and NIDDK had no role in the design and conduct of the study; collection, management, analysis, and interpretation of the data; and preparation, review, or approval of the manuscript. The views expressed in this article are those of the authors and do not necessarily represent the official view of the NIDDK nor NIH.
Footnotes
Financial Disclosure: The authors have no financial relationships relevant to this article to disclose.
Potential Conflicts of Interest: The authors have no conflicts of interest relevant to this article to disclose.
References:
- 1.Atta CA, Fiest KM, Frolkis AD, et al. Global Birth Prevalence of Spina Bifida by Folic Acid Fortification Status: A Systematic Review and Meta-Analysis. Am J Public Health 2016;106(1):e24–34. [DOI] [PMC free article] [PubMed] [Google Scholar]
- 2.Shin M, Besser LM, Siffel C, et al. Prevalence of spina bifida among children and adolescents in 10 regions in the United States. Pediatrics 2010;126(2):274–279. [DOI] [PubMed] [Google Scholar]
- 3.Kupferman JC, Aronson Friedman L, Cox C, et al. BP control and left ventricular hypertrophy regression in children with CKD. J Am Soc Nephrol 2014;25(1):167–174. [DOI] [PMC free article] [PubMed] [Google Scholar]
- 4.Group ET, Wuhl E, Trivelli A, et al. Strict blood-pressure control and progression of renal failure in children. N Engl J Med 2009;361(17):1639–1650. [DOI] [PubMed] [Google Scholar]
- 5.Denburg MR, Kumar J, Jemielita T, et al. Fracture Burden and Risk Factors in Childhood CKD: Results from the CKiD Cohort Study. J Am Soc Nephrol 2016;27(2):543–550. [DOI] [PMC free article] [PubMed] [Google Scholar]
- 6.Hooper SR, Gerson AC, Butler RW, et al. Neurocognitive functioning of children and adolescents with mild-to-moderate chronic kidney disease. Clin J Am Soc Nephrol 2011;6(8):1824–1830. [DOI] [PMC free article] [PubMed] [Google Scholar]
- 7.Fine RN. Etiology and treatment of growth retardation in children with chronic kidney disease and end-stage renal disease: a historical perspective. Pediatr Nephrol 2010;25(4):725–732. [DOI] [PubMed] [Google Scholar]
- 8.Go AS, Chertow GM, Fan D, McCulloch CE, Hsu CY. Chronic kidney disease and the risks of death, cardiovascular events, and hospitalization. N Engl J Med 2004;351(13):1296–1305. [DOI] [PubMed] [Google Scholar]
- 9.Schwartz GJ, Munoz A, Schneider MF, et al. New equations to estimate GFR in children with CKD. J Am Soc Nephrol 2009;20(3):629–637. [DOI] [PMC free article] [PubMed] [Google Scholar]
- 10.Pham-Huy A, Leonard M, Lepage N, Halton J, Filler G. Measuring glomerular filtration rate with cystatin C and beta-trace protein in children with spina bifida. J Urol 2003;169(6):2312–2315. [DOI] [PubMed] [Google Scholar]
- 11.Fox JA, Dudley AG, Bates C, Cannon GM Jr. Cystatin C as a marker of early renal insufficiency in children with congenital neuropathic bladder. J Urol 2014;191(5 Suppl):1602–1607. [DOI] [PubMed] [Google Scholar]
- 12.Chhabra SK. Using arm span to derive height: impact of three estimates of height on interpretation of spirometry. Ann Thorac Med 2008;3(3):94–99. [DOI] [PMC free article] [PubMed] [Google Scholar]
- 13.Schwartz GJ, Schneider MF, Maier PS, et al. Improved equations estimating GFR in children with chronic kidney disease using an immunonephelometric determination of cystatin C. Kidney Int 2012;82(4):445–453. [DOI] [PMC free article] [PubMed] [Google Scholar]
- 14.Zappitelli M, Parvex P, Joseph L, et al. Derivation and validation of cystatin C-based prediction equations for GFR in children. Am J Kidney Dis 2006;48(2):221–230. [DOI] [PubMed] [Google Scholar]
- 15.Levey AS, Stevens LA, Schmid CH, et al. A new equation to estimate glomerular filtration rate. Ann Intern Med 2009;150(9):604–612. [DOI] [PMC free article] [PubMed] [Google Scholar]
- 16.Inker LA, Schmid CH, Tighiouart H, et al. Estimating glomerular filtration rate from serum creatinine and cystatin C. N Engl J Med 2012;367(1):20–29. [DOI] [PMC free article] [PubMed] [Google Scholar]
- 17.National High Blood Pressure Education Program Working Group on High Blood Pressure in C, Adolescents. The fourth report on the diagnosis, evaluation, and treatment of high blood pressure in children and adolescents. Pediatrics 2004;114(2 Suppl 4th Report):555–576. [PubMed] [Google Scholar]
- 18.Hoffer MM, Feiwell E, Perry R, Perry J, Bonnett C. Functional ambulation in patients with myelomeningocele. J Bone Joint Surg Am 1973;55(1):137–148. [PubMed] [Google Scholar]
- 19.Filler G, Lee M. Educational review: measurement of GFR in special populations. Pediatr Nephrol 2018;33(11):2037–2046. [DOI] [PubMed] [Google Scholar]
- 20.Dangle PP, Ayyash O, Kang A, et al. Cystatin C-calculated Glomerular Filtration Rate-A Marker of Early Renal Dysfunction in Patients With Neuropathic Bladder. Urology 2017;100:213–217. [DOI] [PubMed] [Google Scholar]
- 21.Fathallah-Shaykh SA, Flynn JT, Pierce CB, et al. Progression of pediatric CKD of nonglomerular origin in the CKiD cohort. Clin J Am Soc Nephrol 2015;10(4):571–577. [DOI] [PMC free article] [PubMed] [Google Scholar]
- 22.Stepanczuk BC, Dicianno BE, Webb TS. Young adults with spina bifida may have higher occurrence of prehypertension and hypertension. Am J Phys Med Rehabil 2014;93(3):200–206. [DOI] [PubMed] [Google Scholar]
- 23.Mazur L, Lacy B, Wilsford L. The prevalence of hypertension in children with spina bifida. Acta Paediatr 2011;100(8):e80–83. [DOI] [PubMed] [Google Scholar]
Associated Data
This section collects any data citations, data availability statements, or supplementary materials included in this article.