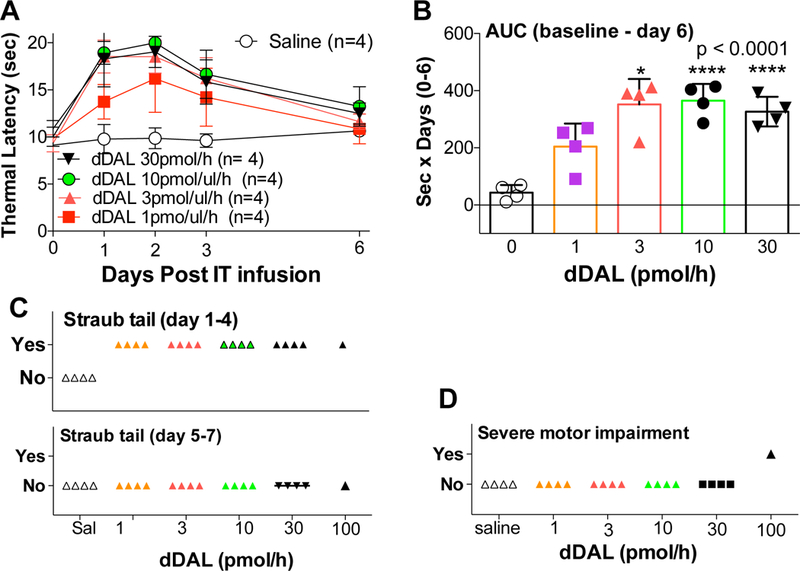
Figure 1.

(A): Dose response curve of thermal latencies (mean ± SD: seconds) vs. time post IT infusion of DMT-DALDA (dDAL) or saline vehicle. (B) Scatter graph of area under the time course of the thermal escape curve (AUC: 0–6 d) of IT doses of DMT-DALDA and saline vehicle. One-way ANOVA analysis was performed on AUC, with a Dunnett’s post hoc comparison test comparing drug effects to vehicle showed * p<0.05, **** p<0.0001. (C) Scatter graph of the observance of incidence of animals displaying Straub tail during the days 1–4 or 5–7 period. (D) Scatter graph of the incidence of animals displaying severe motor dysfunction at any time during the time course.
