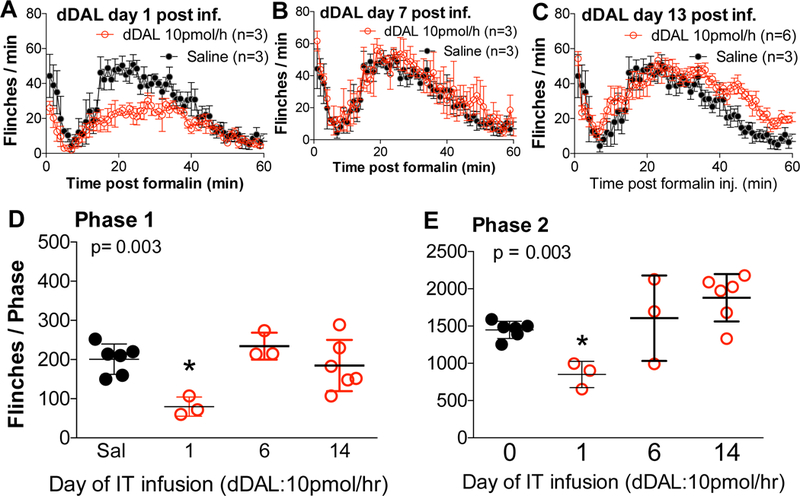
Figure 3:

(A, B, C) Minute by minute plot of formalin induced flinching (Flinch counts: mean ± SEM for clarity) in groups after infusion for 1 day or 7 days, and 13 days of intrathecal DMTDALDA (dDAL: 10 pmol/hour). Saline infusion group was for 1 day only. (D, E) Total flinch count of phase 1 (0–10 min) and phase 2 (11–60 min) on day 1, day 6, and day 13 (Mean ± SD). Total Flinch counts for phase 1 and phase 2 were analyzed with One-Way ANOVA and Dunnett’s test and compared to saline (*p<0.05).
