

Abstract
This research aimed to evaluate the influences of the pulsed electric field (PEF), ultrasound (US), and combination between them (PEF + US) on the quality of vinegar processed from date palm fruits compared with untreated vinegar (UT). Physicochemical properties, free amino acids (FAA), volatile components, organic acids, total phenolics and flavonoids, and sensory analysis were determined. The results showed that there were no significant differences in pH, total titratable acidity, ethanol content, and total sugar in all treated vinegar compared with UT. However, the values were found to be decreased (PEF + US < PEF < US < UT). Twenty-eight compounds were identified in the vinegar treated by PEF + US as the highest number of components, followed by PEF and US (23 and 22 components, respectively), compared with 19 compounds identified in UT. Compared with UT, there was a significant increase (p < 0.05) in the total FAA in dates vinegar among all treated samples (UT < US < PEF < PEF + US). Total phenolic and flavonoids contents results indicated that there was a significant increase (p < 0.05) in the treated vinegar compared with UT. Sensory analysis results indicated that no significant difference (p < 0.05) in all the parameters, except for a quite significant difference (p < 0.05) in the overall acceptability between the treated vinegar. In this study, vinegar was successfully produced from date palm fruits. Therefore, PEF + US are capable not only in enhancing the extraction process but also in the production of vinegar with good quality.
Keywords: Vinegar, Dates, PEF, Quality properties, Ultrasound, Fermentation
Introduction
Vinegar was defined as a condiment made from numerous sugary and starchy sources during alcoholic and following acetic fermentation (Matloob and Hamza 2013). Vinegar as an end-product is considered as a result of the conversion of ethyl alcohol into acetic acid by oxidation using Acetobacter bacteria and characterised by their ability to do that (Solieri and Giudici 2009). Ultrasound (US) as a green technology at different configurations status can be used in food production field, such as sterilisation, freezing, extraction, drying, etc. Wang et al. (2017) and it is widely noted that it improves the quality of fermented products. About fermented products processing, possible US treatments to wine aging and microbiology have been tinted (Matloob and Hamza 2013). The cavitation produced by US waves in liquid products can encourage special chemical reactions and accelerate rates like esterification and oxidation (Parrilla et al. 1999). The US can offer an instant relative high pressure and temperature, which accelerate vinegar reaction in the chemistry and physics characteristics, in addition to improving the sensory quality (Mason et al. 1996). In pulsed electric field (PEF) applications, the functional components isolated from food products can be improved, while the contaminations by microorganisms during processing of food products can be inhibited (Yang et al. 2016). Therefore, the PEF technique is considered an alternative to old-style food production because good quality and energy use efficiency can be ensuring in this technique (Buckow et al. 2013). Among the mechanisms of PEF extraction, the most popular and widely accepted is an electrical breakdown and electroporation membranes (Wang et al. 2016; Zhang et al. 2013). The cells of the plants, animals, or microorganisms are susceptible to high-voltage electric field (EF) pulses provisionally (Niu et al. 2019), which can induce the weakening of fat bilayer and the proteins of cell membranes (Zhang et al. 2017). Impacts of US combined with PEF on the quality characteristics of some fermented products processed from different kinds of fruits were studied (Garde-Cerdán et al. 2008; López et al. 2009; Vicaş et al. 2017; Yang et al. 2016) and found to improve the quality of end products and extraction process with negative effects. Most of the dates palm fruits varieties are rich in sugar, fibre and minerals (potassium, magnesium and calcium), but have a low content of protein, and lipids (Assirey 2015). Date fruit is a source of phenolics, flavonoids and carotenoids, antioxidant, antimutagenic, as well as it has medicinal values (Tang et al. 2013). The main target of this study was to assess the impacts of PEF, US, and PEF combined with US on the quality characteristics of the vinegar processed from date palm fruits including FAA profile, physicochemical characteristics, bioactive components, aroma compounds and sensory analysis.
Materials and methods
Date palm fruits sample and reagents
Dates (Sukkari variety) were grown in Iraq and bought as fresh fruits from a local market in Guangzhou City, People’s Republic of China, and then transported to the School of Food Science and Engineering Laboratory, South China University of Technology, Guangzhou, China. The fruits were free of physical damage, injury, or any other flaws and were of uniform size. The samples were cleaned manually and stored in polyethylene bags at 4 °C for further investigations. All reagents and chemicals were of the highest grades available commercially.
PEF treatment
To obtain the treated alcoholic beverages of date palm fruits, PEF extraction (SCUT-PEF Extraction group, South China University of Technology, Guangzhou, China) was performed for batches of 100 g of dates that were treated before the fermentation process. The maximum output voltage of the PEF was 15 kV, and the capacitance was 1.00 μF. The treatment was applied in a parallel plate electrode treatment chamber at 13 cm gaps with EF strengths of 3 kV/cm for 100 μs of total treatment time. Additionally, 40 μs pulse widths were applied with a frequency < 10 Hz. The specific energy (W) as kJ/kg was calculated by Eq. (1) as reported by Wiktor et al. (2016):
| 1 |
where V: voltage, C: capacitance of the energy storage capacitor, n: number of pulses and m: mass in the treatment cell. The specific energy was 85.30 kJ/kg.
Ultrasonic treatment
The same configuration of ultrasonic apparatus was applied for the sample treatment before fermentation (US) and for vinegar treated by PEF (PEF + US) by using an ultrasonic bath cleaner (SB-600DTY, Ningbo Scientz Biotechnology Co. Ltd., Ningbo, China) at a constant frequency of 40 kHz, power 200 W, and a constant temperature of 35 °C for 30 min. The samples were moved to the bath cleaner of US in the internal cistern. The temperatures of the samples were maintained by the water circulation (0.5 l/min), the flow rate, and the sonication density was 0.06 W/cm3.
Alcoholic fermentation
Five-litre glass fermenters (Zhilong Technology Co., Ltd., Hong Kong, China) were used for the fermentation process, and the glasses were incubated statically at a temperature of 29 °C. Five hundred grams date flesh was suspended in 2.80 l boiled distilled water and then cooled at room temperature (25 °C). The mixture was inoculated with 100 ml of Chinese active dry wine yeast (Saccharomyces cerevisiae; Angle yeast Co. Ltd., China) suspension (10:100 w/v at 38 °C). The fermentation was controlled daily to observe the production of CO2 and the end of the fermentation process through the stability of the consumption of sugars in °Brix, which was observed by using an Abbe refractometer (Fuzhou Centre Optoelectronics Technology Co., Ltd., China) after 23 days. Each sample was collected at the starting and the end of fermentation for further analysis. At the end of fermentation, the glass fermenters were placed in an incubator (Beijing Zhongxingweiye Instrument Co., Ltd., China) at 10 °C to facilitate the solid sedimentation in the alcoholic solution. After 10 days of incubation, the alcoholic mixture was moved to an Erlenmeyer flask to offer aeration and then was incubated at 10 °C for another 23 days. Subsequently, the alcoholic beverage of date palm fruits was filtered through diatomaceous earth and cellulose filters under a vacuum.
Acetic fermentation
After alcoholic fermentation was done, the wine was used to make vinegar by using Acetobacter aceti bacteria (GDMCC 1.152) which was brought from Guangdong Culture collection Centre, Guangzhou, China and then was subsequently inoculated onto a secondary culture plate, containing potato dextrose broth as the maintenance medium, and incubated at 35 °C; growth was observed within 48–72 h. After the incubation, the broth containing (25 ml) 106 CFU/ml was composed for use as acetic fermentation. The fermentation process was begun by adding 100 ml of the acholic mixture to the 25 ml acetic bacterial suspension of 106 CFU/ml. Then the mixture was incubated for 30 days at 25 °C. In the end, the vinegar samples were kept in the dark bottles and kept at 4 °C until use.
Free amino acids (FAA) determination
To detect the FAA of processed vinegar, an A300 amino acid analyser (Membra-Pure GmbH, Berlin, Germany) was used. The package of software used contained iPeak and iControl (Membra-Pure, Berlin, Germany). In brief, 4 ml of each sample complemented with 3,5-dinitrosalicylic acid (1 ml) was stored for 1 h at 4 °C to give a chance for reduction process and then centrifuged at 9000 rpm for 15 min twice. Diluents constituted with acetic acid, formic acid, trifluoroacetic acid lithium acetate, and ethanol to the final amino nitrogen of 0.008–0.01% was used to dilute the supernatant. Liquid chromatography with a column (TS263, membraPure) was used to separate the amino acids and detected by ninhydrin reaction, and then by the measure of absorbance at 570 and 440 nm for Pro. Each amino acid concentration was calculated using standards (Sigma-Aldrich, St. Louis, MO), the FAA concentrations were reported as mg/100 ml.
Measurement of physicochemical characteristics
The titratable acidity (TTA), total soluble solids (TSS), pH, volatile acidity (VA), electric conductivity (EC), total sugar, total SO2, relative density, and alcohol concentration of the processed vinegar treated by PEF, US, PEF + US, and UT were determined according to methods reported by Aadil et al. (2018) and Lopez et al. (2009). The TSS (°Brix) was determined by using an Abbe refractometer. The pH values of samples were detected by using a digital pH-meter (PHS-3E Model, Ningbo Biocotek Scientific Instrument Co., Ltd., China) which was already calibrated with buffers at pH 2, 4, and 7 before using. EC was measured with a conductivity meter. The TA was determined according to the method reported by Aadil et al. (2015). Colour parameters of the samples were determined using a Colorimeter (CR-400 Chroma-Meter, Osaka, Japan) at room temperature (Mtaoua et al. 2017). The total sugar content was evaluated during the whole fermentation process and after that by using Abbe refractometer (Fuzhou Centre Optoelectronics Technology Co. Ltd, China). The protein and fat contents in the processed vinegar were determined according to the method reported by Zhao et al. (2018).
Determination of volatile flavours compounds
The dates vinegar volatile flavour substances were detected using gas chromatography–mass spectrometry (GC–MS) coupled with the solid-phase microextraction (SPME) technique. Briefly, 8 ml of processed vinegar was placed in a 2.5 ml vial, and 1.2 μl cyclohexanone (internal standard) was added. The vinegar was saturated with NaCl (50 mg), after equilibrating for 10 min at 45 °C, this sample was extracted at 45 °C for 40 min at a constant temperature with stirring in a multipurpose sampler with SPME capability. A volume of 2 μl of the sample was used for GC/MS analysis. The analysis was performed on a GC/MS system (Mass Hunter GC/MS Acquisition, Agilent Technologies, Inc.). The GC was equipped with an HP-5 ms Ultra Inert column (15 mm × 250 μm × 0.25 μm). The carrier gas was helium set to flow at 1.5 ml/min. The injector was operated in a splitless mode at 250 °C temperature. The chromatographic working environments were adjusted for the complete separation of the main components. The oven was programmed from 120 °C (3.0 min) to 250 °C with 5 °C/min and maintained for 5.0 min. The MS was adjusted at the following situations: ion source temperature at 280 °C, electron impact ionisation at 70 eV, and current emission at 250 μA, whereas the SIM mode was used in the earlier reported method. The MS was functioned in the recent research in a full scan mode, taking advantage of the high sensitivity of the ion trap analyser in the full scan mode. In this way, possible chemical interferences were eliminated. The volatile compounds identification was detected by matching the compounds with the MS of standard.
Determination of organic acids of processed vinegar treated by PEF and US
The organic acid contents of processed vinegar were detected by using HPLC (Chinese National Standard: GB/T 18623-2011). Briefly, 2 ml potassium ferrocyanide (10.6%) and 2 ml zinc sulfate (30%) were added to 5 ml sample to deposit protein and centrifuged at 448g. The supernatant was filtered through a 0.22 μm membrane. Kromasil C18 chromatographic column (5 μm, 4.6 × 250 mm), at 35 °C. Mobile phase: 20 mmol/l NaH2PO4 (adjusted to pH 2.70 with H3PO4), with a flow speed of 0.9 mol/l. The UV absorption at 210 nm was performed for measuring the organic acids.
Determination of total phenolic content (TPC)
TPC of vinegar sample was conducted using the Folin–Ciocalteu method. Briefly, 200 mg of sample (equivalents/ml) was mixed with 1.0 ml of Folin–Ciocalteu reagent and 4 ml of ethanol solvent; the mixture was then shaken for 2 min. 3.0 ml of Na2CO3 (15%) was added, and the mixture was shaken again. The solution was then brought up to 20 ml with distilled water. The mixture was incubated for 20 min at 50 °C and centrifuged at 3000 rpm for 10 min. The absorbance was reported at 750 nm using spectrophotometer (TU-1810 series of UV–visible, General Analysis of General Instrument Co. Ltd., Beijing, China). Finally, TPC of the processed vinegar was calculated using Gallic acid equivalent as a standard.
Determination of total flavonoids content (TFC)
TFC of vinegar was determined as follows: 2 ml of each sample was added to 600 μl NaNO2 at a concentration of 5% solution, with also 600 μl AlCl3 (10%). All test tubes were incubated for 5 min at room temperature (24 °C), followed by addition of 4 ml of 1 mol/l NaOH, and then the reaction mixture volumes were immediately made to 20 ml distilled water. The mixture was then carefully vortexed. Finally, the mixture absorbance was recorded using spectrophotometer (TU-1810 series of UV–visible, General Analysis of General Instrument Co. Ltd., Beijing, China) at 510 nm. TFC of the processed vinegar were reported as mg catechin equivalents per 100 g dry weight.
Determination of total carotenoids and anthocyanin contents
Total carotenoids content (TCC) was measured by a previously reported method (Aadil et al. 2015), and the results were expressed as μg of β-carotene equivalent/ml of sample, while the total anthocyanin contents (TAC) was determined by using the pH-differential method (Lee et al. 2005).
Sensory analysis
Sensory evaluation of vinegar processed from date palm fruits under effects of PEF, US, and PEF + US compared with the control was conducted using a 30-members panel (trained) to evaluate colour, taste, flavour, taste and overall acceptability. A hedonic scale of 1–9 was used; 1: extremely bad, 2: very bad, 3: bad, 4: fairly bad, 5: satisfactory, 6: fairly good, 7: good, 8: very good, and 9: excellent.
Data analysis
Statistical analyses were conducted using Statistical Package for the Social Sciences (SPSS) software, version 16.0 for Windows (SPSS Inc., Chicago, IL). One-way analysis of variance was used to report significant differences between means, and Tukey’s test was used to carry out multiple comparisons between means. The significance level was defined as p < 0.05. Origin software version 8 (Microcal Software Inc., MA, USA) and Microsoft Office Excel® 2016 (Microsoft Corporations Redmond, WA, USA) were used for plotting the scientific graphs
Results and discussion
Effect of PEF and US on physicochemical properties of the processed dates vinegar
As illustrated in Table 1, TTA, pH, EC, total sugar, alcohol concentration, and density of dates vinegar treated by PEF and US and combined treatment were reported. Depending on the statistical analyses, there were no significant differences (p < 0.05) in pH, total titratable acidity, ethanol content, and total sugar in all treated vinegar when compared with the untreated vinegar (UT), however, the values were found to be decreased (PEF + US < PEF < US < UT). The ethanol content values of treated vinegar were 0.33, 0.31 and 0.30% for US, PEF, and PEF + US, respectively, compared with UT vinegar (0.51%) and were 1.73, 1.70, and 1.66% for sugar content in comparison to UT (1.95%). pH and total acidity were found to be decreased from 3.03 and 3.88% in UT sample to 2.75 and 3.56% in the vinegar treated by PEF + US, respectively. The same trend was detected on the results of electric conductivity and density of treated vinegar compared with the UT sample which has no significant differences between them. However, the values had increased. Generally, the EC of liquid food products is due to the presence of some nutrient components, such as vitamins, microelements, lipids, and amino acids (Aadil et al. 2015). Depending on the results of physicochemical characteristics of processed dates vinegar, US, PEF, and combined treatment had a positive impact on the fermentation process. The protein and fat contents also were found to be increased in the treated vinegar compared with untreated however were found in low concentration (Table 1).
Table 1.
Physicochemical characteristics of dates vinegar treated by PEF, US and PEF + US compared with UT
| Parameters | UT | Treated vinegar | ||
|---|---|---|---|---|
| US | PEF | PEF + US | ||
| Total titratable acidity(w/v) | 3.88 ± 0.18a | 3.79 ± 0.12a | 3.70 ± 0.09a | 3.56 ± 0.16a |
| Ethanol content (w/v) (%) | 0.51 ± 0.09a | 0.33 ± 0.10a | 0.31 ± 0.14a | 0.30 ± 0.10a |
| Total sugar content (%) | 1.95 ± 0.13a | 1.73 ± 0.09a | 1.70 ± 0.10a | 1.66 ± 0.13a |
| pH | 3.03 ± 0.06a | 2.93 ± 0.12a | 2.90 ± 0.08a | 2.75 ± 0.09a |
| Density (g/cm3) | 1.001 ± 0.10a | 1.002 ± 0.18a | 1.002 ± 0.16a | 1.003 ± 0.15a |
| Electrical conductivity(ms/cm) | 3.10 ± 0.15a | 3.21 ± 0.10a | 3.23 ± 0.11a | 3.31 ± 0.10a |
| Fat content (g/100 ml) | 0.65 ± 0.22c | 0.69 ± 0.19b | 0.77 ± 0.10b | 0.89 ± 0.17a |
| Protein content (g/100 ml) | 1.16 ± 0.12c | 1.29 ± 0.15b | 1.37 ± 0.17b | 1.45 ± 0.22a |
| Color parameters | ||||
| L* | 45.44 ± 0.17a | 45.40 ± 0.20a | 44.81 ± 0.44a | 44.17 ± 0.20a |
| a* | − 0.33 ± 0.34a | − 0.31 ± 0.21a | − 0.16 ± 0.33a | − 0.09 ± 0.12a |
| b* | 3.14 ± 0.33a | 3.17 ± 0.22a | 3.20 ± 0.51a | 3.24 ± 0.31a |
| ΔE | 0 | 0.05 | 0.66 | 1.30 |
All determinations were conducted in triplicates and mean value ± standard deviation. Mean values in a row with different letters are significantly different (p < 0.05) by Tukey’s multiple range test
UT untreated vinegar, US vinegar treated by ultrasonic, PEF vinegar treated by pulsed electric field and PEF+US vinegar treated by PEF and US
Effect of PEF and US on colour attributes of the processed dates vinegar
As also shown in Table 1, the colour difference (ΔE) was calculated. Depending on these values, the colour difference between vinegar treated by PEF, US, and PEF + US compared with UT can be evaluated as described by Hartyáni et al. (2013), such that (6.0–12.0) is great, (3.0–6.0) is well visible, (1.5–3.0) is noticeable, (0.5–1.5) is slightly noticeable, and (0–0.5) is not noticeable. Our results indicated that the colour difference was not noticeable in the vinegar treated by US, well visible in vinegar treated by PEF, and was slightly noticeable in the vinegar treated by combined treatment PEF + US compared with UT vinegar. There was no significant difference (p < 0.05) between all treated vinegar and UT. Therefore, the treatment by PEF and US under these conditions did not affect the colour of processed vinegar. Our results are agreed with those reported by Mtaoua et al. (2017), who detected significant variations after applying high-intensity PEF (35 kV/cm using pulses of 4 μs pulses for 1000 μs at 100 Hz) to date palm fruit juice. A study reported by Aadil et al. (2018) has suggested a minor change in the colour of grapefruits juice treated by PEF, US, and PEF + US which increased these effects increased with increasing voltage conditions.
Effect of PEF and US on volatile flavours compounds of the processed dates vinegar
The number of volatile flavours compounds in dates vinegar treated by US, PEF, and PEF + US compared with the UT using GC–MS was identified (Table 2). Twenty-eight compounds were identified in the vinegar treated by PEF + US as the highest number of components, followed by PEF and US (23 and 22 components, respectively), compared with the number of compounds identified in control (19 compounds). According to these results, treatment by PEF + US has a positive effect on the aroma compounds in the processed dates vinegar throughout increasing of total and number of volatile components. As can be seen in Table 2, compared with functional groups in all treated vinegar, acid compound groups, methyl, ethyl, and ester were found in higher proportions. Methyl, ethyl and esters are a significant aromatic group in aroma compounds which play an important role in the formation of sensory characteristics; these compounds are formed acids during and after fermentation (Tarko et al. 2008). These compounds are important even in minor quantities, for the formation of vinegar quality characteristics (Moreno-Pérez et al. 2013). In comparison with the UT, more components were identified in the processed vinegar treated by US, PEF, and PEF + US which were acid compounds group with their derivatives, which are considered important volatile compounds in vinegar. Acetic esters are formed during the forming and aging of vinegar in outstanding amounts (Morales et al. 2002). Therefore, the vinegar of these fruits can be treated by PEF, US, and even by a combination between them to improve the extraction of volatile compounds. The same trend in other kinds of vinegar produced from different raw materials has been reported by Wang et al. (2017) who obtained a significant effect on the volatile components of vinegar treated by ultrasonic compared with the UT. Notably, more volatile flavour compounds with higher levels were identified in the vinegar treated by PEF + US and PEF, followed by US compared with UT. Thus, this combined treatment can be used to enhance the production of this kind of vinegar. The main by-products of ethyl acetate and acetic bio-oxidation are observed from the reaction between ethanol and acetic acid, which is the major aim for ethanol and acetic acid (Ince et al. 2001). It was reported that the esterification reaction could be improved by green technology such as ultrasonic and PEF.
Table 2.
Aroma compounds (area %) of dates vinegar treated by PEF, US and PEF + US compared with UT
| UT | US | PEF | PEF + US | Component |
|---|---|---|---|---|
| 3.70 | 2.51 | 4.43 | 4.80 | Acetic acid |
| 4.67 | 2.22 | 5.58 | 3.69 | 1,3-Dioxolane, 2,4,5-trimethyl- |
| 12.6 | 21.38 | 29.63 | 17.49 | 1-Butanol, 3-methyl- |
| 6.01 | 8.72 | 13.04 | 8.24 | Formic acid, 2-methylbutyl ester |
| 1.13 | 1.05 | 1.09 | 1.25 | 3-Methyl-hexanoic acid |
| 1.66 | 1.50 | 1.89 | 1.78 | Butanoic acid, ethyl ester |
| 1.27 | 1.30 | 2.96 | 2.07 | Isobutyl acetate |
| 1.5 | 2.19 | 1.57 | 1.9 | Ammonium acetate |
| 14.62 | 13.46 | 1.18 | 1.19 | Butanoic acid, 3-methyl-, ethyl ester |
| 3.21 | 2.79 | 1.55 | 1.27 | Butanoic acid, 3-methyl- |
| 3.49 | 2.48 | 24.73 | 2.92 | 1-Butanol, 3-methyl-, acetate |
| 21.37 | 19.14 | 5.05 | 20.66 | 1-Butanol, 2-methyl-, acetate |
| 4.55 | 10.96 | 2.75 | 3.91 | Benzaldehyde |
| 3.87 | 20.11 | 97.32 | 100 | 2-Octanol |
| 3.85 | 1.61 | 15.16 | 26.61 | D-Limonene |
| 1.83 | 3.49 | 17.92 | 100 | Phenylethyl Alcohol |
| 3.11 | 2.59 | 3.03 | 100 | Succinic acid, butyl tridec-2-ynyl ester |
| 7.58 | 5.46 | 4.00 | 3.92 | Butanedioic acid, diethyl ester |
| 2.64 | 4.09 | 6.25 | 100 | Benzaldehyde, 3,4-dimethyl- |
| ND | 5.64 | 7.42 | 69.13 | Benzeneacetic acid, ethyl ester |
| ND | 1.38 | 7.33 | 94.74 | Acetic acid, 2-phenylethyl ester |
| ND | 1.49 | 1.28 | 96.6 | Benzaldehyde, 2,4,5-trimethyl- |
| ND | ND | 3.68 | 1.51 | Pentanoic acid, 5-hydroxy-, 2,4-di-t-butylphenyl esters |
| ND | ND | ND | 1.00 | 1-Butyn-3-one, 1-(6,6-dimethyl-1,2-epoxycyclohexyl)- |
| ND | ND | ND | 2.34 | Pentanoic acid, 5-hydroxy-, 2,4-di-t-butylphenyl esters |
| ND | ND | ND | 1.01 | Pentanoic acid, 2,2,4-trimethyl-3-carboxyisopropyl, isobutyl ester |
| ND | ND | ND | 1.11 | 1,2-Benzenedicarboxylic acid, bis(2-methylpropyl) ester |
| ND | ND | ND | 1.01 | Dibutyl phthalate |
UT untreated vinegar, US vinegar treated by ultrasonic, PEF vinegar treated by pulsed electric field, PEF+US vinegar treated by PEF and US and ND not detected
Effect of PEF and US on organic acids of the processed dates vinegar
As shown in Table 3, acetic acid content was the main group of components in the processed vinegar as a volatile acid (29.10, 30.30, 30.69 and 30.96 mg/ml, for UT, US, PEF, and PEF + US, respectively). Often the content of non-volatile acids had relevance with quality properties of the vinegar and might buffer the motivation of acetic acid. The treated vinegar also contained citric acid, α-ketoglutaric acid, succinic, focal glutamic acid, and lactic acid as non-volatile acids. The organic acids are considered the most important compounds that comprehensively the general appeal, flavour, and taste of vinegar (Wang et al. 2017). The organic acids were the highest (p < 0.05) in the treated vinegar PEF + US > PEF > US compared with the UT, however, there were no significant differences except in acetic acid content between the treated and UT. Succinate content (6.96 mg/ml) was found to be the highest content as non-volatile compound, which was reported under effect of combined treatment (PEF + US), followed by PEF treatment (6.62 mg/ml), and US treatment (6.56 mg/ml), compared with UT vinegar (6.43 mg/ml). The same trend was detected in citric acid, focal glutamic acid, and α-ketoglutaric acid which increased compared with untreated vinegar. The intensity of PEF and ultrasonic wave process might be generated from the intensity and circulated waves, producing chemical polymers and broken into numerous haze particles and combined. As the results of impacts of PEF, US, and PEF + US hydrolysis reaction were conducted between some esters and fatty acid components, subsequent in the organic acids, level increasing.
Table 3.
Effects of PEF, US, and PEF + US on the organic acids content (mg/ml) of dates vinegar compared with UT
| Organic acid | UT | Treated vinegar | ||
|---|---|---|---|---|
| US | PEF | PEF + US | ||
| α-Ketoglutaric acid | 0.12 ± 0.10a | 0.19 ± 0.13a | 0.25 ± 0.18a | 0.29 ± 0.10a |
| Citric acid | 0.14 ± 0.12a | 0.21 ± 0.11a | 0.24 ± 0.10a | 0.27 ± 0.09a |
| Succinate | 6.43 ± 0.09a | 6.56 ± 0.10a | 6.62 ± 0.09a | 6.69 ± 0.12a |
| Focal glutamic acid | 0.69 ± 0.15a | 0.74 ± 0.17a | 0.77 ± 0.13a | 0.83 ± 0.15a |
| Acetic acid | 29.10 ± 0.12b | 30.30 ± 0.40a | 30.69 ± 0.15a | 30.96 ± 0.13a |
All determinations were conducted in triplicates and mean value ± standard deviation. Mean values in a row with different letters are significantly different (p < 0.05) by Tukey’s multiple range test
UT untreated vinegar, US vinegar treated by ultrasonic, PEF vinegar treated by pulsed electric field and PEF+US vinegar treated by PEF and US
Effect of PEF and US on FAA of the processed dates vinegar
The FAA contents in the vinegar treated by PEF, US, and PEF + US compared with those in UT were reported in Table 4. Our results indicated that compared with the UT, there was a significant increase (p < 0.05) in the total FAA in dates vinegar among all treated samples (UT < US < PEF < PEF + US). Depending on these results, PEF, US, and the combined treatment are considered a useful application to increase the nutritional value of this vinegar throughout increasing the essential amino acids. Further studies are needed to explain the mechanism of the increases in the FAA concentration in dates vinegar caused by US, PEF, and even by PEF + US extraction treatment. PEF treatments were found to increase the total FAA in different kinds of food products (Garde-Cerdán et al. 2007; Soliva-Fortuny et al. 2009; Zhao et al. 2009), which was in agreement with our results. As illustrated in Table 4, the concentrations of the essential amino acids which were detected were highest in the vinegar treated by PEF and ultrasonic compared with the UT. As previously reported by Zhao et al. (2009), some amino acids are most likely released through the pores formed in the cell membrane of the indigenous juice yeasts. The results indicated that there are some amino acids (Cystine, isoleucine, leucine, tyrosine, phenylamine, arginine, and proline), while some of them were not detected (methionine and tryptophan).
Table 4.
Effect of PEF, US, and PEF + US treatments on the free amino acids content (mg/100 ml) of dates vinegar compared with UT
| Amino acid | UT | Treated vinegar | ||
|---|---|---|---|---|
| US | PEF | PEF + US | ||
| Aspartic acid | 0.67 ± 0.03b | 0.70 ± 0.04b | 0.93 ± 0.08a | 0.91 ± 0.06a |
| Threonine | 0.13 ± 0.09a | 0.14 ± 0.07a | 0.20 ± 0.06a | 0.22 ± 0.03a |
| Serine | 0.15 ± 0.01b | 0.16 ± 0.08b | 0.24 ± 0.04a | 0.25 ± 0.08a |
| Glutamic acid | 0.80 ± 0.08b | 0.83 ± 0.03b | 1.00 ± 0.01a | 0.99 ± 0.09a |
| Glycine | 0.60 ± 0.07c | 0.69 ± 0.02c | 1.04 ± 0.07b | 2.74 ± 0.02a |
| Alanine | 1.25 ± 0.09c | 1.27 ± 0.07c | 1.36 ± 0.03b | 1.48 ± 0.04a |
| Cystine | BDL | BDL | BDL | BDL |
| Valine | 0.10 ± 0.04a | 0.12 ± 0.01a | 0.19 ± 0.02a | 0.19 ± 0.03a |
| Isoleucine | BDL | BDL | BDL | BDL |
| Leucine | BDL | BDL | BDL | BDL |
| Tyrosine | BDL | BDL | BDL | BDL |
| Phenylamine | BDL | BDL | BDL | BDL |
| Histidine | 0.12 ± 0.01a | 0.14 ± 0.08a | 0.22 ± 0.04a | 0.20 ± 0.03a |
| Lysine | 0.39 ± 0.07d | 0.98 ± 0.03a | 0.51 ± 0.05c | 0.73 ± 0.09b |
| Arginine | BDL | BDL | BDL | BDL |
| Proline | BDL | BDL | BDL | BDL |
| Methionine | ND | ND | ND | ND |
| Tryptophan | ND | ND | ND | ND |
| Total amino acids | 4.24c | 5.03b | 5.69b | 7.71a |
All determinations were conducted in triplicates, and the mean values ± standard deviation were calculated. Mean values in a row with different letters are significantly different (p < 0.05) by Tukey’s multiple range test
UT untreated vinegar, US vinegar treated by ultrasonic, PEF vinegar treated by pulsed electric field, PEF+US vinegar treated by PEF and US, BDL below detectable level and ND not detected
Effect of PEF and US on TPC and TFC of the processed dates vinegar
The PEF and US extraction techniques support the intracellular contents extraction; therefore, the permeabilisation of cells is useful for more yields in fruit bioactive compounds such as TPF and TPC and enhancing the extraction of intracellular metabolites (Agcam et al. 2014; Mtaoua et al. 2017). Figure 1a, b shows the results of the TPC and TFC in the processed dates vinegar to evaluate whether there were any significant differences. Compared with the UT, TPC and TFC results indicated that there was a significant increase (p < 0.05). As shown in Fig. 1a, the highest value for TPC was found in the vinegar treated by PEF + US (610.10 mg GAE/l), which was significantly different (p < 0.05) compared with the TPC values in the UT (469.55 mg GAE/l), and even the vinegar treated by US and PEF (571.95 and 588.90 mg GAE/l, respectively), while there was no significant difference between the vinegar treated by US and PEF. In a study by Biglari et al. (2009), date varieties had been reported to exhibit higher TPC than soft varieties and indicated that dry dates had the highest TPC, followed by semidry and soft dates. The TPC can get affected by some enzymes, which are responsible for phenolic biosynthesis, and the induction of these enzyme activities can increase the TPC accumulation (Aguiló-Aguayo et al. 2009). As can be seen in Fig. 1b, the same trend obtained for the TPC results was found for the TFC. The results indicated the TFC increased from 43.11 mg CE/l for the UT to 78.82 mg CE/l in the vinegar treated by PEF + US. Our results are agreement with some studies, which obtained a significant increase in TFC in different fruit extracts and juices (Bhat et al. 2011; Mtaoua et al. 2017).
Fig. 1.
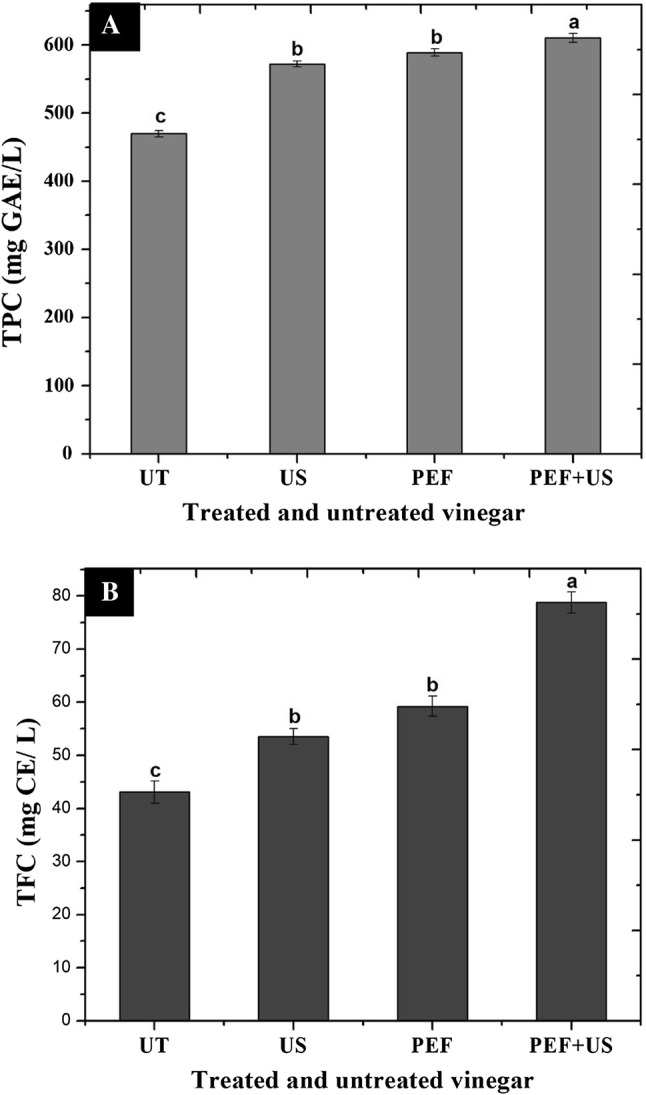
TPC and TFC in dates vinegar treated by PEF and US compared with untreated vinegar (UT). PEF: vinegar treated by pulsed electric field, US: vinegar treated by ultrasonic, PEF + US: vinegar treated by PEF and US. All determinations were conducted in triplicate, and the mean values ± standard deviation were calculated. Mean values with different letters are significantly different (p < 0.05) by Tukey’s multiple range test
Sensory evaluation of the processed vinegar treated by PEF and US
As shown in Table 5, the sensory analysis score was reported. The results indicated that no significant difference (p < 0.05) in all the parameters except a quite significant difference (p < 0.05) in the overall acceptability between the treated vinegar (PEF + US > PEF > US) compared with the UT. Meanwhile, this confirmed the impact of PEF and US producing dates vinegar, representing that the quality characteristics of the processed vinegar treated by PEF, US, and PEF + US have been improved. Many studies may be carried out to encourage further studies of the utilisation of combined PEF with US to enhance the quality of fermented products.
Table 5.
Sensory evaluation of dates vinegar treated by PEF, US and PEF + US compared with UT
| Parameters | Taste | Color | Flavor | Clarity | Overall acceptability |
|---|---|---|---|---|---|
| Control | 6.90a | 6.85a | 7.10a | 7.50a | 6.00b |
| US | 6.85a | 6.80a | 7.90a | 7.40a | 8.10a |
| PEF | 6.90a | 7.20a | 7.95a | 7.10a | 8.10a |
| PEF + US | 7.10a | 6.90a | 8.10a | 6.98a | 8.30a |
Mean values in a column with different letters are significantly different (p < 0.05) by Tukey’s multiple range test
UT untreated vinegar, US vinegar treated by ultrasonic, PEF vinegar treated by pulsed electric field and PEF+US vinegar treated by PEF and US
Conclusion
In the current study, the effects of PEF, US, and PEF + US on the quality of the vinegar of date palm fruits were studied. The results of this study indicated a notable increase in the FAA, TFC, TPC, and volatile components when PEF combined with US was used. A minor change in the physicochemical and colour parameters occurred after the treatment; however, there was no significant difference between the samples, including the control. PEF + US treatment was found to improve the bioactive components and the nutritional value of processed vinegar. Thus, according to the results of this study, treatment by a combination method (PEF + US) can be a better technique to enhance the quality and characteristics of dates vinegar, and even on a commercial basis.
Acknowledgements
This research was supported by the National Natural Science Foundation of China (21576099), the S&T projects of Guangdong Province (2017B020207001 and 2015A030312001), as well as the 111 Project (B17018).
Footnotes
Publisher's Note
Springer Nature remains neutral with regard to jurisdictional claims in published maps and institutional affiliations.
References
- Aadil RM, et al. A potential of ultrasound on minerals, micro-organisms, phenolic compounds and colouring pigments of grapefruit juice. Int J Food Sci Technol. 2015;50:1144–1150. doi: 10.1111/ijfs.12767. [DOI] [Google Scholar]
- Aadil RM, et al. Combined effects of pulsed electric field and ultrasound on bioactive compounds and microbial quality of grapefruit juice. J Food Process Preserv. 2018;42:e13507. doi: 10.1111/jfpp.13507. [DOI] [Google Scholar]
- Agcam E, Akyıldız A, Evrendilek GA. Comparison of phenolic compounds of orange juice processed by pulsed electric fields (PEF) and conventional thermal pasteurisation. Food Chem. 2014;143:354–361. doi: 10.1016/j.foodchem.2013.07.115. [DOI] [PubMed] [Google Scholar]
- Aguiló-Aguayo I, Soliva-Fortuny R, Martín-Belloso O. Avoiding non-enzymatic browning by high-intensity pulsed electric fields in strawberry, tomato and watermelon juices. J Food Eng. 2009;92:37–43. doi: 10.1016/j.jfoodeng.2008.10.017. [DOI] [Google Scholar]
- Assirey EAR. Nutritional composition of fruit of 10 date palm (Phoenix dactylifera L.) cultivars grown in Saudi Arabia. J Taibah Univ Sci. 2015;9:75–79. doi: 10.1016/j.jtusci.2014.07.002. [DOI] [Google Scholar]
- Bhat R, Kamaruddin NSBC, Min-Tze L, Karim A. Sonication improves kasturi lime (Citrus microcarpa) juice quality. Ultrason Sonochem. 2011;18:1295–1300. doi: 10.1016/j.ultsonch.2011.04.002. [DOI] [PubMed] [Google Scholar]
- Biglari F, AlKarkhi AF, Easa AM. Cluster analysis of antioxidant compounds in dates (Phoenix dactylifera): effect of long-term cold storage. Food Chem. 2009;112:998–1001. doi: 10.1016/j.foodchem.2008.06.063. [DOI] [Google Scholar]
- Buckow R, Ng S, Toepfl S. Pulsed electric field processing of orange juice: a review on microbial, enzymatic, nutritional, and sensory quality and stability. Compr Rev Food Sci Food Saf. 2013;12:455–467. doi: 10.1111/1541-4337.12026. [DOI] [PubMed] [Google Scholar]
- Garde-Cerdán T, Arias-Gil M, Marsellés-Fontanet AR, Ancín-Azpilicueta C, Martín-Belloso O. Effects of thermal and non-thermal processing treatments on fatty acids and free amino acids of grape juice. Food Control. 2007;18:473–479. doi: 10.1016/j.foodcont.2005.12.004. [DOI] [Google Scholar]
- Garde-Cerdán T, Marsellés-Fontanet AR, Arias-Gil M, Ancín-Azpilicueta C, Martín-Belloso O. Effect of storage conditions on the volatile composition of wines obtained from must stabilized by PEF during ageing without SO2. Innov Food Sci Emerg Technol. 2008;9:469–476. doi: 10.1016/j.ifset.2008.05.002. [DOI] [Google Scholar]
- Hartyáni P, Dalmadi I, Knorr D. Electronic nose investigation of Alicyclobacillus acidoterrestris inoculated apple and orange juice treated by high hydrostatic pressure. Food Control. 2013;32:262–269. doi: 10.1016/j.foodcont.2012.10.035. [DOI] [Google Scholar]
- Ince N, Tezcanli G, Belen R, Apikyan İG. Ultrasound as a catalyzer of aqueous reaction systems: the state of the art and environmental applications. Appl Catal B Environ. 2001;29:167–176. doi: 10.1016/S0926-3373(00)00224-1. [DOI] [Google Scholar]
- Lee J, Durst RW, Wrolstad RE. Determination of total monomeric anthocyanin pigment content of fruit juices, beverages, natural colorants, and wines by the pH differential method: collaborative study. J AOAC Int. 2005;88:1269–1278. [PubMed] [Google Scholar]
- Lopez N, Puertolas E, Condon S, Raso J, Alvarez I. Enhancement of the solid-liquid extraction of sucrose from sugar beet (Beta vulgaris) by pulsed electric fields. LWT-Food Sci Technol. 2009;42:1674–1680. doi: 10.1016/j.lwt.2009.05.015. [DOI] [Google Scholar]
- López N, Puértolas E, Hernández-Orte P, Álvarez I, Raso J. Effect of a pulsed electric field treatment on the anthocyanins composition and other quality parameters of Cabernet Sauvignon freshly fermented model wines obtained after different maceration times. LWT-Food Sci Technol. 2009;42:1225–1231. doi: 10.1016/j.lwt.2009.03.009. [DOI] [Google Scholar]
- Mason T, Paniwnyk L, Lorimer J. The uses of ultrasound in food technology. Ultrason Sonochem. 1996;3:S253–S260. doi: 10.1016/S1350-4177(96)00034-X. [DOI] [Google Scholar]
- Matloob MH, Hamza MB. Vinegar production from low cost Iraqi dates. J Kerbala Univ. 2013;11:29–35. [Google Scholar]
- Morales ML, Tesfaye W, García-Parrilla MC, Casas JA, Troncoso AM. Evolution of the aroma profile of sherry wine vinegars during an experimental aging in wood. J Agric Food Chem. 2002;50:3173–3178. doi: 10.1021/jf011313w. [DOI] [PubMed] [Google Scholar]
- Moreno-Pérez A, Vila-López R, Fernández-Fernández JI, Martínez-Cutillas A, Gil-Muñoz R. Influence of cold pre-fermentation treatments on the major volatile compounds of three wine varieties. Food Chem. 2013;139:770–776. doi: 10.1016/j.foodchem.2013.01.052. [DOI] [PubMed] [Google Scholar]
- Mtaoua H, Sánchez-Vega R, Ferchichi A, Martín-Belloso O. Impact of high-intensity pulsed electric fields or thermal treatment on the quality attributes of date juice through storage. J Food Process Preserv. 2017;41:e13052. doi: 10.1111/jfpp.13052. [DOI] [Google Scholar]
- Niu D, Wang L-H, Zeng X-A, Wen Q-H, Brennan CS, Tang Z-S, Wang M-S. Effect of ethanol adaption on the inactivation of Acetobacter sp. by pulsed electric fields. Innov Food Sci Emerg Technol. 2019;52:25–33. doi: 10.1016/j.ifset.2018.11.009. [DOI] [Google Scholar]
- Parrilla MGa, Heredia FJ, Troncoso AM. Sherry wine vinegars: phenolic composition changes during aging. Food Res Int. 1999;32:433–440. doi: 10.1016/S0963-9969(99)00105-2. [DOI] [Google Scholar]
- Solieri L, Giudici P (eds) (2009) Vinegars of the world. In: Vinegars of the world. Springer, Berlin, pp 1–16
- Soliva-Fortuny R, Balasa A, Knorr D, Martín-Belloso O. Effects of pulsed electric fields on bioactive compounds in foods: a review. Trends Food Sci Technol. 2009;20:544–556. doi: 10.1016/j.tifs.2009.07.003. [DOI] [Google Scholar]
- Tang ZX, Shi LE, Aleid SM. Date fruit: chemical composition, nutritional and medicinal values, products. J Sci Food Agric. 2013;93:2351–2361. doi: 10.1002/jsfa.6154. [DOI] [PubMed] [Google Scholar]
- Tarko T, Duda-Chodak A, Sroka P, Satora P, Jurasz E. Physicochemical and antioxidant properties of selected polish grape and fruit wines. Acta Sci Polon Technol Aliment. 2008;7:35–45. [Google Scholar]
- Vicaş SI, Bandici L, Teuşdea AC, Turcin V, Popa D, Bandici GE. The bioactive compounds, antioxidant capacity, and color intensity in must and wines derived from grapes processed by pulsed electric field. CyTA-J Food. 2017;15:553–562. doi: 10.1080/19476337.2017.1317667. [DOI] [Google Scholar]
- Wang L-H, Wang M-S, Zeng X-A, Zhang Z-H, Gong D-M, Huang Y-B. Membrane destruction and DNA binding of Staphylococcus aureus cells induced by carvacrol and its combined effect with a pulsed electric field. J Agric Food Chem. 2016;64:6355–6363. doi: 10.1021/acs.jafc.6b02507. [DOI] [PubMed] [Google Scholar]
- Wang Z, Li T, Liu F, Zhang C, Ma H, Wang L, Zhao S. Effects of ultrasonic treatment on the maturation of Zhenjiang vinegar. Ultrason Sonochem. 2017;39:272–280. doi: 10.1016/j.ultsonch.2017.04.020. [DOI] [PubMed] [Google Scholar]
- Wiktor A, Nowacka M, Dadan M, Rybak K, Lojkowski W, Chudoba T, Witrowa-Rajchert D. The effect of pulsed electric field on drying kinetics, color, and microstructure of carrot. Dry Technol. 2016;34:1286–1296. doi: 10.1080/07373937.2015.1105813. [DOI] [Google Scholar]
- Yang N, Huang K, Lyu C, Wang J. Pulsed electric field technology in the manufacturing processes of wine, beer, and rice wine: a review. Food Control. 2016;61:28–38. doi: 10.1016/j.foodcont.2015.09.022. [DOI] [Google Scholar]
- Zhang B, Zeng X-A, Lin WT, Sun D-W, Cai J-L. Effects of electric field treatments on phenol compounds of brandy aging in oak barrels. Innov Food Sci Emerg Technol. 2013;20:106–114. doi: 10.1016/j.ifset.2013.07.003. [DOI] [Google Scholar]
- Zhang Z-H, Han Z, Zeng X-A, Wang M-S. The preparation of Fe-glycine complexes by a novel method (pulsed electric fields) Food Chem. 2017;219:468–476. doi: 10.1016/j.foodchem.2016.09.129. [DOI] [PubMed] [Google Scholar]
- Zhao W, Yang R, Wang M, Lu R. Effects of pulsed electric fields on bioactive components, colour and flavour of green tea infusions. Int J Food Sci Technol. 2009;44:312–321. doi: 10.1111/j.1365-2621.2008.01714.x. [DOI] [Google Scholar]
- Zhao C, Xia T, Du P, Duan W, Zhang B, Zhang J, Zhu S, Zheng Y, Wang M, Yu Y. Chemical composition and antioxidant characteristic of traditional and industrial zhenjiang aromatic vinegars during the aging process. Molecules. 2018;23:2949. doi: 10.3390/molecules23112949. [DOI] [PMC free article] [PubMed] [Google Scholar]