

Abstract
There is growing public demand that research participants receive all their results regardless of whether clinical action is indicated. Instead of the standard practice of returning only actionable results, we propose a reconceptualization called “return of value” to encompass the varied ways in which research participants value specific results and more general information they receive beyond actionable results. Our proposal is supported by a national survey of a diverse sample, which found that receiving research results would be valuable to most (78.5%) and would make them more likely to trust researchers (70.3%). Respondents highly valued results revealing genetic effects on medication response and predicting disease risk as well as information about nearby clinical trials and updates on how their data was used. The information most valued varied by education, race/ethnicity, and age. Policies are needed to enable return of information in ways that recognize participants’ differing informational needs and values.
Introduction
There has been considerable debate about whether or not to return individual research results to participants. Because the purpose of research is to generate generalizable evidence and not to guide individual clinical care or health management, researchers historically have not been obliged to return individual results. Views on this have evolved, due to the increasing availability of genetic tests results as well as public demands for access to personal data.1–3 However considerations on whether or not to return results have largely focused on whether the results would impact clinical decision making. Little regard has often been paid to participants’ perspectives on the personal utility of the results.
Concerns about the validity and usefulness of research results is considered a primary reason for not returning results to participants.4–6 There is also concern for potential risks of returning results including the costs and burden of subsequent clinical evaluations, potential harm due to unnecessary procedures, emotional stress to the participant and family when results are uncertain, and privacy breaches.1,4,7 Primary care physicians may also be burdened with the responsibility of explaining research results of unclear significance.8 Consequently, many researchers have not returned results unless a clear and urgent action is warranted (duty to warn9 or inform) or the results can be easily interpreted and acted upon. Lack of training in how to effectively communicate results and limited resources to share results also contribute to researchers’ hesitance to return results.4
Public perceptions on who owns data10 and views that participants should be partners in research11 have called into question practices on return of results. Mounting evidence shows that participants want to learn their individual research results and that results are of value regardless of whether action is recommended.12 These findings helped inform a 2018 report from the National Academy of Medicine,4 which urges researchers to reconsider policies that limit participant access to research results and calls for more evidence on participants’ perspectives of what results are of value.
We propose the re-conceptualization of the return of results practice as “return of value,” to encompass ways in which participants may perceive benefit from myriad types of information. Use of the term “value” is deliberate and novel in this context and builds on evidence regarding personal value to individuals, which is distinct from financial value.13 This study intends to better understand how participants’ perceive value of different types of information, shifting focus from results deemed useful by researchers to what participants care about and what they might benefit from receiving. Our overarching goal is to inform recommendations for researchers seeking best practices in providing value to participants. We also seek to inform policies that will enable the return of information to individuals with differing needs and priorities.
Methods
Survey Development
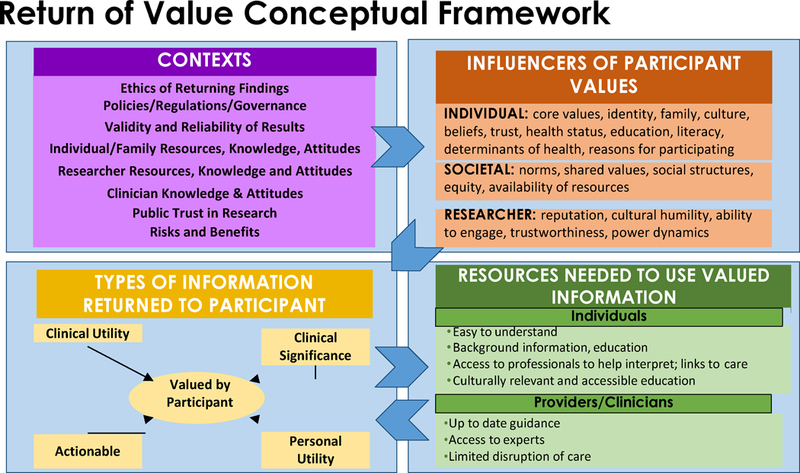
We developed a conceptual framework for return of value. This framework hypothesizes relationships between contextual effects (i.e., socio-economic, political, cultural, and geographical factors), influencers of participants’ values, and types of information that could be returned to research participants.14 The framework represents a synthesis of our review of existing literature on return of results.15 The framework was refined (Appendix Exhibit A1)16 using feedback from a diverse group of 125 individuals elicited during 15 Community Engagement Studios17 held in locations around the U.S. between April and October 2016.14
The survey (see Appendix Exhibit A2)16 incorporated the value-related concepts reflected in the conceptual framework, studio discussions, and the literature, including clinical results as well as access to non-clinical information. The opening questions explored participant experiences and expectations regarding return of results and related concepts (e.g., trust of researchers) using yes/no/not sure response options. Using a 7-point scale, participants were then asked to rate the perceived value of receiving lab tests, survey results, physical measurements, risks related to behaviors, genetic risks, pharmacogenomics, ancestry, and genetic traits. In addition to these types of data, participants also rated the value of information, not results, including access to medical records, clinical trials nearby, updates on how researchers used their information, comparisons to “people like me”, and opportunities to network with “others like me”.
Participants were also asked to rate which particular item would be the most and least valuable to them in an effort to discriminate among those items that might cluster based on ratings. To assess perceived value among less tangible types of research-related information, we did not include monetary compensation as an option among the choices for least and most valuable information types. Participants’ views on whether research results should be returned to participants and whether return of results would impact trust in researchers and willingness to participate in research were also assessed. The final survey included 29 questions and was purposefully brief to minimize burden to participants. The Flesch-Kincaid grade level score for the final survey was 6.6. We intentionally aimed for a low readability level in an effort to ensure valid comprehension of the language and concepts regardless of educational attainment. This study was approved by Vanderbilt’s Institutional Review Board (IRB # 180237).
Recruitment and Survey Deployment
Recruitment efforts took place between March and September 2018 using two sampling mechanisms: the ResearchMatch volunteer registry and Cint, a national survey audience platform.18 We sought to include a diverse group of 2,500 participants aged 18 and older of any age, race, ethnicity, ancestry, ability, gender, income level, and geographical location. Our aim was to develop an authentic picture of individual perspectives and preferences, with particular interest in how they may align or vary across racial and ethnic groups often underrepresented in research. Because of this, respondent demographics were closely monitored throughout the survey period to allow targeting of invitation waves to less represented populations. Additional information about recruitment efforts including compensation are available in Appendix Exhibit A3.16
Survey responses were captured online via REDCap, a secure web application developed by Vanderbilt University.19 We calculated response rate for the overall sample based on surveys with a minimum of 75% of questions answered among those who received the survey.
Data analysis
We used descriptive statistics (e.g., counts, percentages, mean and standard deviation (SD), median) to analyze participant demographics and responses regarding perceived value of various types of information, including summarization across the entire sample as well as relevant subgroups defined by demographic characteristics (e.g., self-reported race and ethnicity, educational attainment). We also used the x2 test to explore any differences in ratings or selections among demographic subgroups.
We used one-way ANOVA to explore differences in perceived value by sociodemographic variables (gender, race, education, income, age) and x2 tests to assess differences in the most and least valuable types of information. Due to the large number of comparisons, we used a Bonferroni corrected p-value threshold of 0.000055 for statistical significance. All analyses are available in Appendix Exhibits A4–A10.16 Analyses were conducted using SPSS v.25.
Limitations
Although we sought to recruit a sample reflecting the broad diversity of the U.S., we have small numbers of some populations including American Indians and Alaska Natives. We considered this in our analyses and would recommend that future studies specifically recruit those not well represented here. Our study is also at risk of selection bias because participants were recruited from existing platforms and the survey was only available electronically. We did, however, use sampling strategies to recruit a substantial number of racial and ethnic minorities as well as individuals with limited education and income. Additionally, this survey is not linked to a clinical study thus no outcomes are available related to perceived value of receiving actual information, though some in our sample with previous research participation may have used that experience to inform their responses. Finally, we did not provide information about the potential incompleteness or uncertainty of research results, which may have shaped participants’ responses. To maximize responses, especially among groups underrepresented in research, we did not attempt to communicate these complex terms and concepts.
Results
Response rate and respondents’ characteristics
Of the 5,218 individuals who were sent the survey, 48.9% responded. The 2,549 respondents included 60% women, 39% age 50 years or older, 58% racial/ethnic minorities, and 23% who had a high school education or less. Exhibit 1 shows the detailed sociodemographic characteristics of our sample. Respondents lived in 47 states, thus including a broader range of areas in the U.S. than that of previous investigations into return of results; see heat map based on respondent-reported zip codes in Exhibit 2.
Exhibit 1.
- Demographic characteristics of the sample (N= 2,549).
| n | % | ||
|---|---|---|---|
| Age | 18–29 years | 679 | 26.7% |
| 30–49 years | 875 | 34.4% | |
| 50–64 years | 580 | 22.8% | |
| 65–74 years | 306 | 12% | |
| 75 years or older | 103 | 4.1% | |
| Missing | 6 | ||
| Gender | Male | 980 | 38.6% |
| Female | 1515 | 59.7% | |
| Other gender | 15 | 0.6% | |
| Neither male nor female | 27 | 1.1% | |
| Missing | 12 | ||
| Race | American Indian or Alaska Native | 42 | 1.7% |
| Asian or Asian American | 307 | 12.1% | |
| Black, African American or African | 696 | 27.4% | |
| Hispanic, Latino, or Spanish | 327 | 12.9% | |
| Middle Eastern or North African | 22 | 0.9% | |
| Native Hawaiian or other Pacific Islander | 10 | 0.4% | |
| White or Caucasian | 1041 | 41% | |
| None of these fully describe me | 60 | 2.4% | |
| Prefer not to answer | 37 | 1.5% | |
| Missing | 7 | ||
| Education | High School or less | 569 | 22.3% |
| College 1 to 3 years (Some college, associate degree, or technical school) | 685 | 26.9% | |
| College 4 years or more (College graduate) | 688 | 27% | |
| Advanced degree (Master, doctorate, etc.) | 597 | 23.4% | |
| Missing | 10 | ||
| Income | Less than $24,999 | 514 | 22% |
| $25,000– $34,999 | 302 | 12.9% | |
| $35,000– $49,999 | 357 | 15.3% | |
| $50,000– $74,999 | 462 | 19.8% | |
| $75,000–$99,999 | 276 | 11.8% | |
| $100,000 or more | 424 | 18.2% | |
| Missing | 214 | ||
| Previous research participation | Yes | 55 | 11%* |
Note:
This question was queried only in the Cint portion of our survey sample; thus this data reflects the relative proportion of respondents in this subset who selected Yes for this question.
SOURCE: [“Authors’ analysis of data from the Return of Value survey, 2018”].
Exhibit 2.
Heat Map of Respondents.
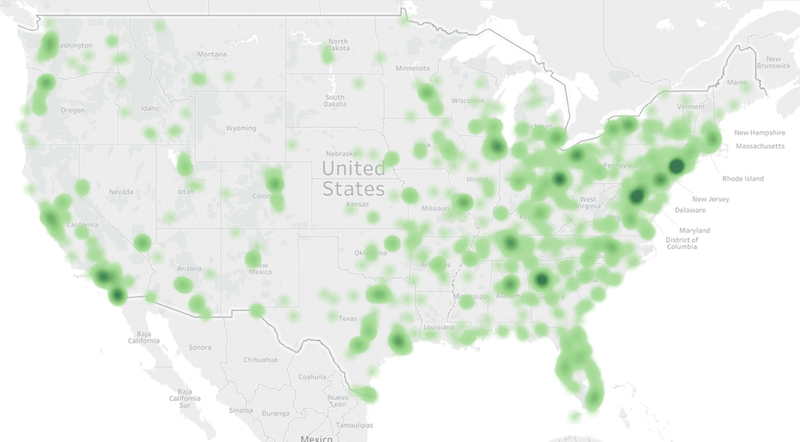
SOURCE: [Image generated using www.openheatmap.com using respondent-provided zip codes, Return of Value survey data, 2018].
NOTES: [Full list of zip codes available on request].
Perspectives on the value of receiving research results
Most respondents indicated that receiving research results would be valuable (78.5%) and should be expected (71.7%), and would make them more likely to participate in research (72.4%) and trust researchers (70.3%). Respondents under age 50 years were more likely to volunteer for research if they were going to receive results (χ2 = 91.23, p < 0.000055), while African Americans were less likely to volunteer (χ2 = 104.05, p < 0.000055). African Americans and Hispanics/Latinos were more likely to trust researchers if they received research results (χ2 = 125.76, p < 0.000055; see Appendix Exhibit A4).16
Of the 647 respondents reporting that they had received research results previously, 65.5% (n=424) received results from a survey or a health assessment; 46.4% (n= 300) received lab results; 42% (n=272) received physical measurements (height, weight, blood pressure, etc.); 16.4% (n=106) received genetic results; and 11.1% (n=72) received other types of results (see Appendix Exhibit A5 for comparisons of types of results received among different demographic groups).16 Free-text descriptions of other results included individual results (e.g., imaging, bone density, sleep studies), aggregate study data/results, comparison of participant data to others, and post-study unblinding of treatment group status (e.g., active or placebo); a small number of participants noted being notified of results requiring further clinical follow-up, such as a cyst, high intraocular pressure, or need to visit a cardiologist.
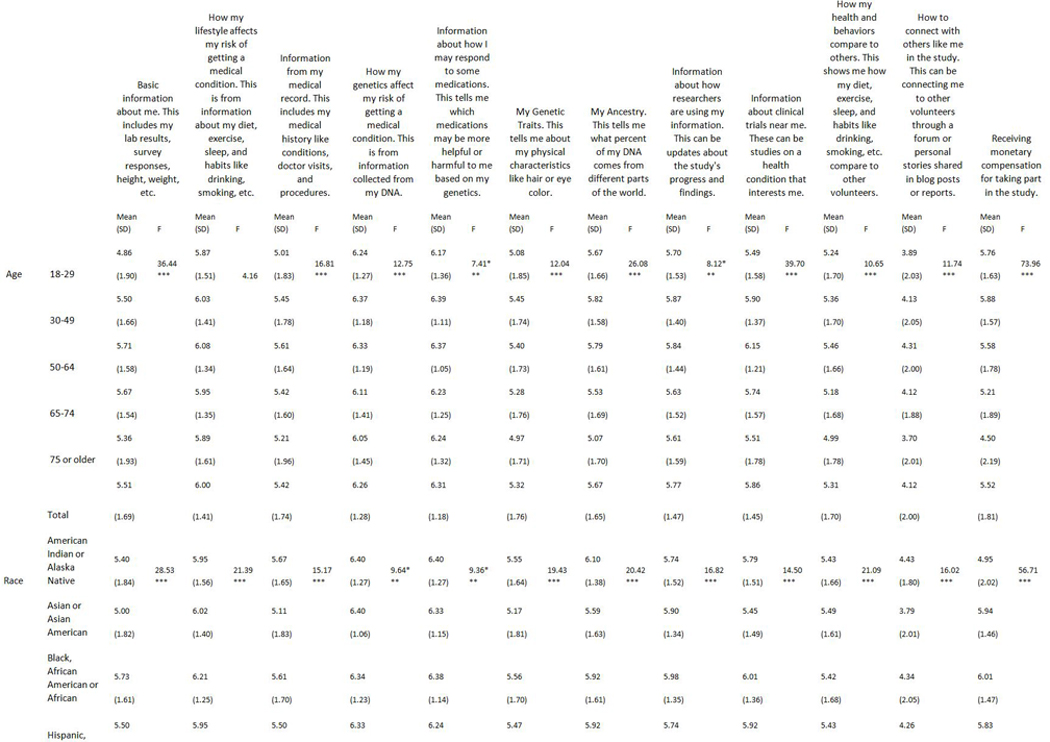
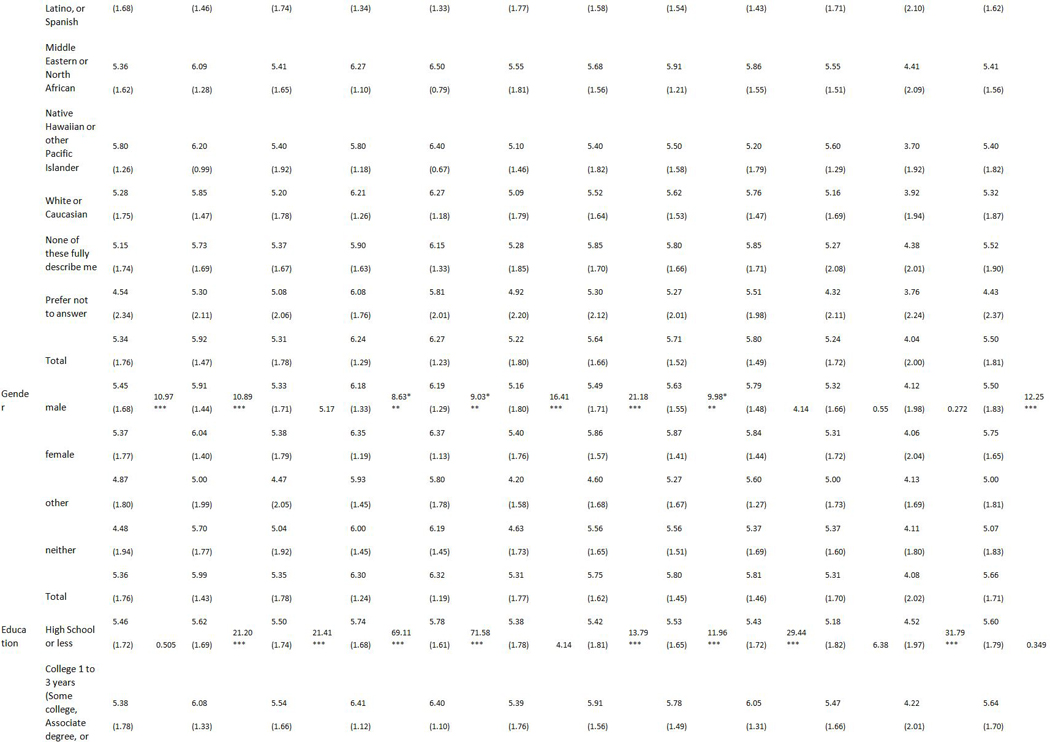
The value of specific types of information
The types of information respondents rated the highest value (mean (SD); using a 7-point scale: 1 being “not valuable” and 7 being “very valuable”) were “information about how I may respond to medications based on genetics” 6.30 (SD 1.21), “how genetics may affect the risk of getting a medical condition” 6.28 (SD 1.26), “how my lifestyle affects my risk of getting a medical condition” 5.98 (SD 1.43), and “clinical trials of interest near me” 5.81 (SD 1.47). Respondents assigned the lowest value to “how to connect with others like me in a study” 4.09 (SD 2.02), “my genetic traits” 5.29 (SD 1.78), “how my health and behaviors compare to others” 5.31 (SD 1.70), and “information from my medical records” 5.36 (SD 1.77). See Exhibit 3 for average ratings of each item.
Exhibit 3:
Respondents ratings of the value of items that could be returned from a study; compared by educational attainment
| Mean value ratings | ||||||
|---|---|---|---|---|---|---|
| All participants n= 2549 | High School or less n= 569 | Some College n= 685 | College Degree n= 688 | Advanced Degree n= 597 | P value | |
| How I may respond to medications based on my genetics | 6.3 | 5.78 | 6.4 | 6.5 | 6.44 | *** |
| How genetics affect my risk of getting a medical condition | 6.28 | 5.74 | 6.41 | 6.44 | 6.46 | *** |
| How my lifestyle affects my risk of getting a medical condition | 5.98 | 5.62 | 6.08 | 6.12 | 6.06 | *** |
| Information about clinical trials near me | 5.81 | 5.43 | 6.05 | 5.92 | 5.8 | *** |
| Information about how researchers are using my data | 5.77 | 5.53 | 5.78 | 5.84 | 5.92 | *** |
| My Ancestry | 5.7 | 5.42 | 5.91 | 5.74 | 5.69 | *** |
| Monetary compensation for participating in the study | 5.64 | 5.6 | 5.64 | 5.67 | 5.64 | |
| Basic information such as labs, survey responses, etc | 5.39 | 5.46 | 5.38 | 5.36 | 5.37 | |
| Information from my medical record | 5.35 | 5.5 | 5.54 | 5.28 | 5.09 | *** |
| How my health and behaviors compare to others | 5.31 | 5.18 | 5.47 | 5.32 | 5.25 | |
| My Genetic Traits | 5.29 | 5.38 | 5.39 | 5.2 | 5.23 | |
| How to connect with others like me in the study | 4.08 | 4.52 | 4.22 | 3.89 | 3.76 | *** |
SOURCE: [“Authors’ analysis of data from the Return of Value survey, 2018”].
Ratings used a 7-point scale: “not valuable” = 1 to “very valuable” = 7. P values are from F test for Analysis of Variance for differences in means.
P < 0.000055
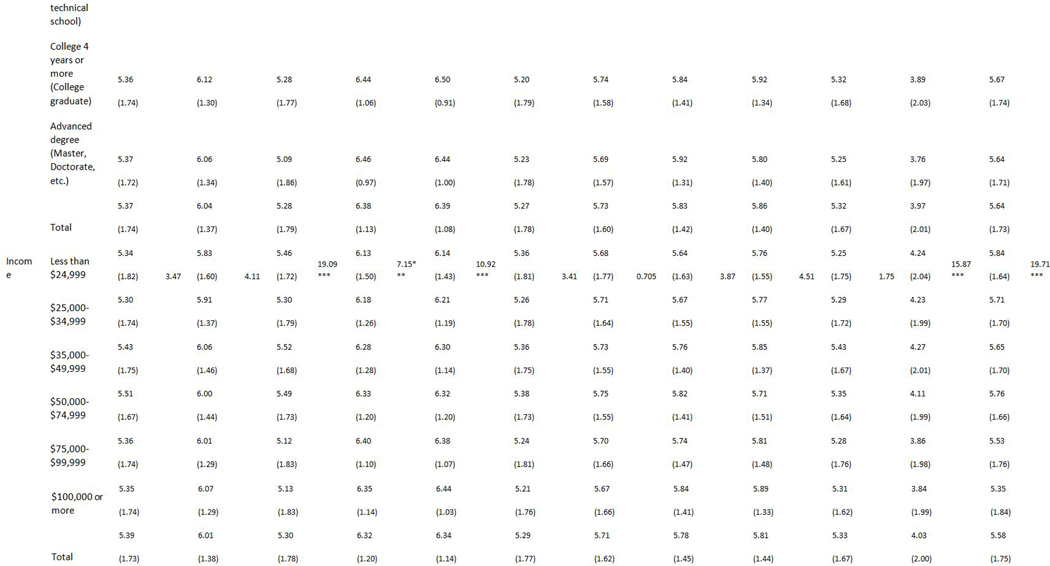
There were differences in perceived value among some demographic groups (see Appendix Exhibit A6 for all demographic comparisons),16 most notably when comparing by educational attainment (see Exhibit 3). Respondents with a college degree or more education assigned higher value to pharmacogenomics results (F=71.58, p<0.000055); genetic risk of disease (F=69.11, p<0.000055); and how lifestyle affects risk of disease (F=21.2, p<0.000055), compared to those with less years of education. Individuals with a high school diploma or less education assigned higher value to receiving information from their medical records (F=21.41, p<0.000055) and how to connect with others like me (F=31.79, p<0.000055) compared to those with more years of education. Additional analyses of value
The most and least valuable types of information
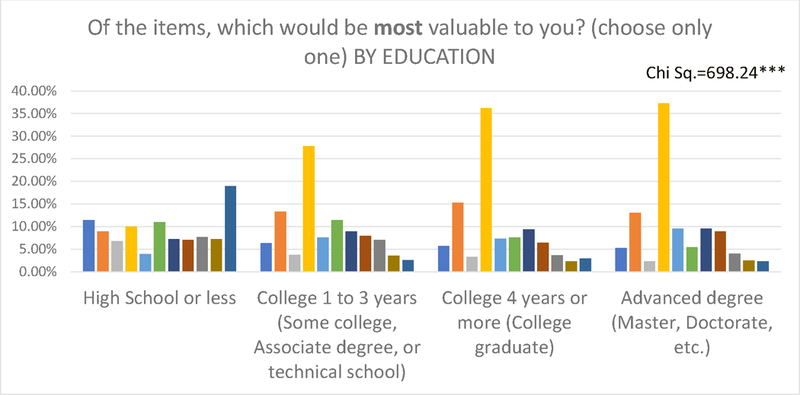
When asked to choose the single most valuable type of information, most respondents indicated “how genetics may affect the risk of getting a medical condition” (28%) and “how my lifestyle affects my risk of getting a medical condition” (13%). Responses for the single least valuable type of information included “how to connect with others like me in a study” (34%) and “basic information about me such as lab tests and survey responses (20%).
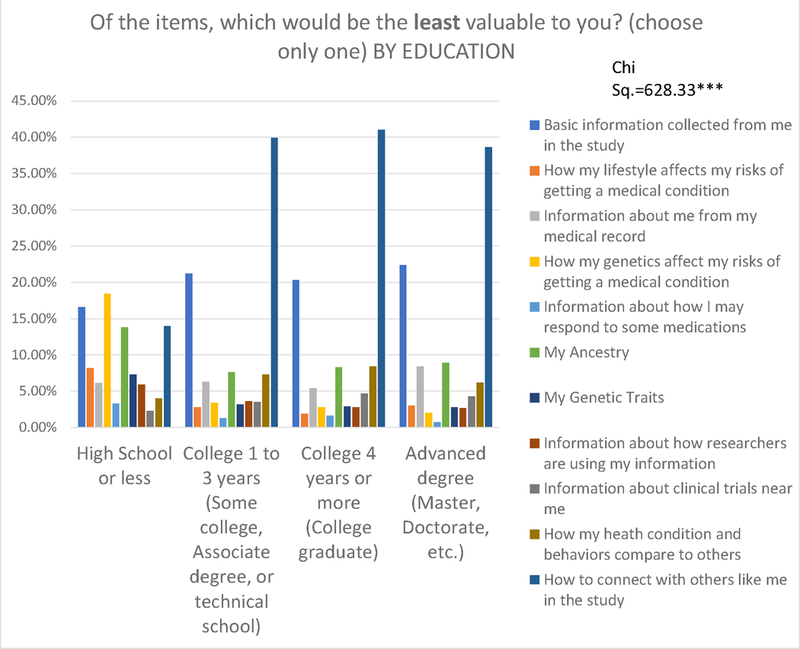
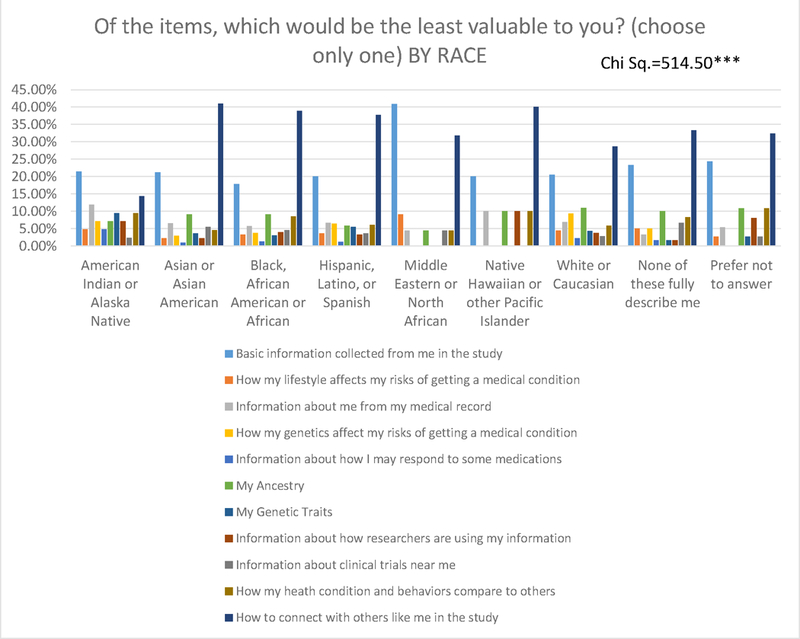
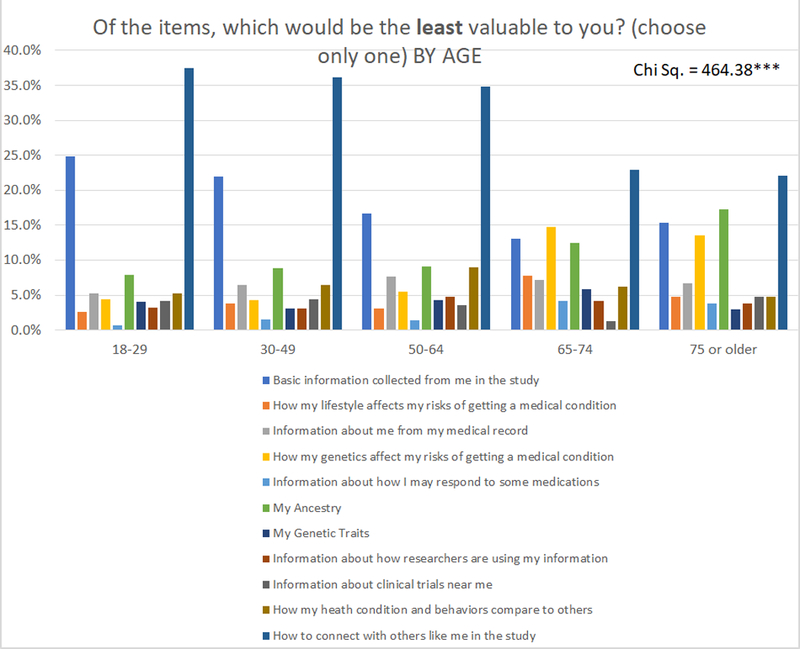
The types of information rated least and most valuable (see Exhibit 4, Exhibit 5, and Appendix Exhibit A716) were similar across most demographic groups except among those with a high school education or less. Respondents with a high school diploma or less education indicated genetic risk of a medical condition as the least valuable item, while all groups with more than a high school education identified this as the most valuable (see Exhibit 4, Exhibit 5, and Appendix Exhibit A8).16 Those with a high school education or less identified “connecting with others like me” as most valuable.
Exhibit 4.
Least valuable type of information by educational attainment.*
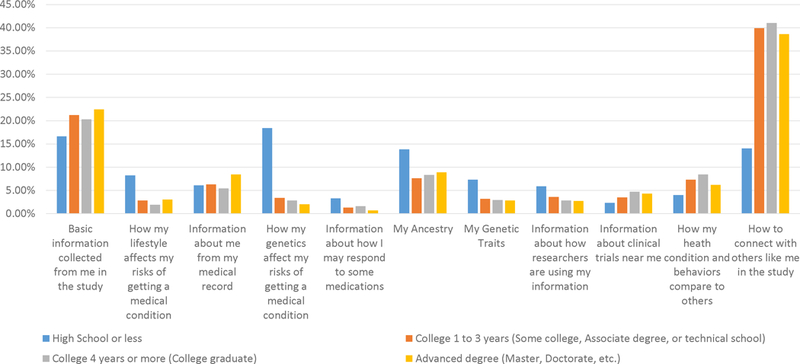
* Survey question: Of the items, which would be the least valuable to you? (choose only one).
SOURCE: Authors’ analysis of data from the Return of Value survey, 2018.
Exhibit 5.
Most valuable type of information by educational attainment.*
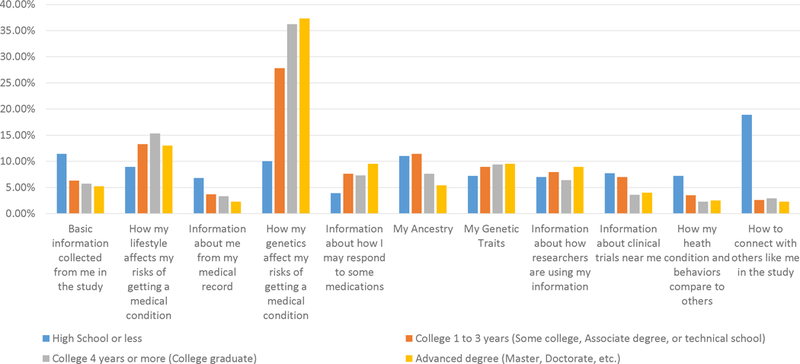
* Survey question: Of the items, which would be most valuable to you? (choose only one)
SOURCE: Authors’ analysis of data from the Return of Value survey, 2018.
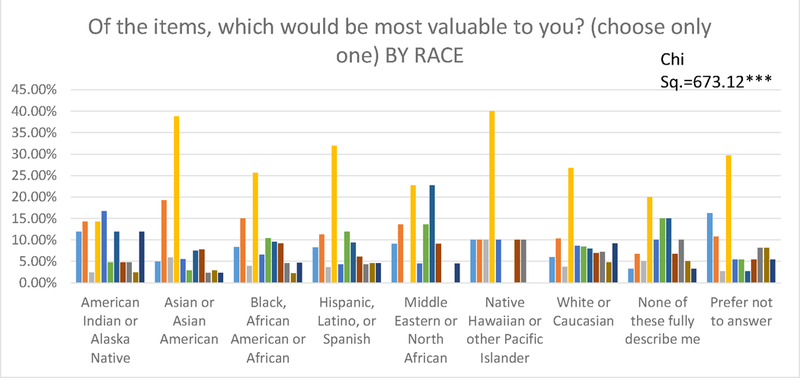
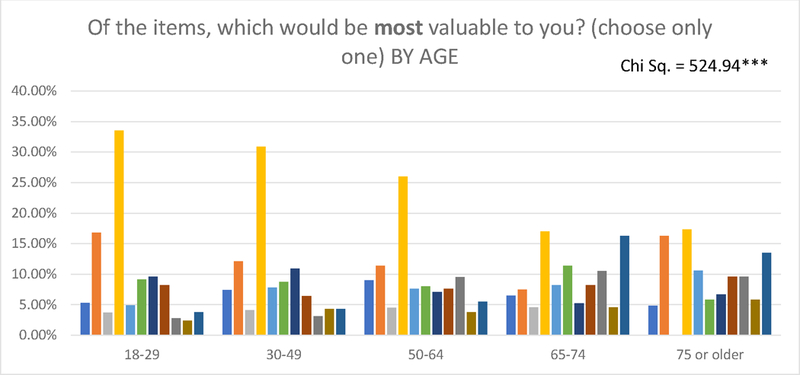
Other differences were found among American Indians and Alaska Natives, who identified pharmacogenomics information as most valuable (see Appendix Exhibit A9),16 as compared with the preference within the overall sample toward genetic effects on risk of a condition. Among individuals over age 65 years, similar proportions selected three items as most valuable - risk of disease based on lifestyle, genetic risk of disease, and connecting with others like me (see Appendix Exhibit A10).16
The value of financial incentives for participation
Overall, receiving money for participating in a study received a mean rating of 5.64 (SD 1.73), which was the seventh highest of the twelve items (see Appendix Exhibit A6 for overall ratings and subgroup comparisons).16 No demographic group rated the value of monetary compensation highest; however, there were differences among some groups. Younger respondents rated the mean value of monetary compensation higher as compared with the oldest respondent group: 5.76 (SD 1.63) for those 18–29 years, 5.88 (SD 1.57) for those 30–49 years, and 4.5 (SD 2.19) for those 75 years and older (F=73.96, p<0.000055). The mean value of monetary compensation for African Americans was 6.01 (SD 1.47), Asians/Asian Americans 5.94 (SD 1.46) and Hispanics/Latinos 5.83 (SD 1.62), which were higher than Caucasians/Whites 5.32 (SD 1.87) and American Indians/Alaska Natives 4.95 (SD 2.02), (F=56.71, p<0.000055).
Discussion
In this diverse national sample, we found that participants across all demographics highly valued receiving information from research studies and were more likely to trust researchers and to volunteer if research information were returned. Results of pharmacogenomics studies and genetic risk of disease had the highest value; however, respondents highly valued information beyond research results including information on “clinical trials near me” and “how researchers are using my data.” Receiving information beyond clinically actionable results was more highly valued than monetary compensation by all ages, races/ethnicities, educational levels, genders and income levels.
We intentionally recruited a sample with a range of racial, ethnic, educational and geographic diversity to include groups often underrepresented in research. Genomic research studies, in particular, often lack racial and ethnic diversity among participants.20 We considered this in our recruitment strategy, which yielded a sample more diverse across many demographic characteristics than previous work in this area, especially with regards to race and ethnicity.1,21,22 As hypothesized, we found notable differences in types of information deemed most valuable by some underrepresented groups. Individuals with lower educational attainment, high school or less, identified information on genetic risk of disease as least valuable, while all other educational categories viewed this as most valuable. This has important implications for addressing the varying informational needs of individuals with limited health literacy and numeracy who may have difficulty interpreting results that are out of range23 or require visual aids to understand information.24,25
Although we found substantial interest in receiving research results among racial and ethnic minorities, their preferences and perceived value of specific types of information varied. This may reflect differences in culture, societal norms, perceptions of researchers’ trustworthiness, and prior experiences with research and health care. In prior work, African Americans, regardless of socioeconomic status, were less likely to access study results in a genetic study of smoking, even after they previously indicated interest in receiving the results.26 Policies and practices related to return of information must recognize these differences and use culturally appropriate messaging as well as avoid reliance on strategies with limited uptake in these groups, such as use of electronic portals.27
Our study goes beyond existing evidence on participants’ views on receiving study results, which has primarily focused on genetic findings and return of results based on clinical utility, actionability and secondary findings.28,29 Some studies have considered the personal utility of results, though this is often framed from the view of researchers or ethicists, who have sought to limit information returned to participants.5,6,10 Our focus on the term value, referring to the perceived worth, usefulness or benefit of the information, is novel and aligns with an emerging focus on patient values in health care decision-making.
Our findings provide new evidence to inform the policies needed to meet the considerable demand for return of information. Research institutions and funders should consider investments in programs that allow return of valued information beyond research results (e.g., study updates on use of data and clinical trial information). Such programs could be used by a large number of researchers and would provide options for return of value when the types of results most valued by participants are not related to the aims of the research study (e.g., genetic results) or when results could impact the study (e.g., unblind the study or change participant behavior).
Because returning results to research participants is not widely practiced, researchers need guidance to systematically implement return of information. Notably, receiving information about individualized medication response based on genetics (i.e. pharmacogenomics) was rated numerically highest of all choices. Given this finding along with the widely established pharmacogenetic associations for drug interactions, which have led to black box warnings30 and drug dosing guidelines31, this is a potential priority area for research that includes pharmacogenetics information. These results are considerably more actionable than disease risk, and therefore do not necessarily trigger the need for genetic counseling that other results might (putting such practices out of range of many individual study budgets). Further, there are tools for reporting these results to patients in understandable ways as well as recommendations on report content.32 Using these existing resources would limit burden and costs to both researchers and participants and enable clinicians to use results in ways that minimize disruptions to workflow.
Our findings support that a proactive approach is required to engage participant groups and understand varying preferences for return of value. For example, the All of Us Research Program, which intends to share information with at least 1 million participants, will need to implement strategies that tailor and adapt information for more precise communication with its diverse participants33 and allows participants to select their most valuable information. Researchers will also need to anticipate the resources needed for everyone to understand and use the information. Policies should promote access to relevant and easy-to-understand information for all demographic categories, especially individuals who socially disadvantaged.
Conclusions
The majority of research participants expect to receive information from studies and they find value in information beyond laboratory test results such as study progress and where to find clinical trials. If implemented broadly, the return of valued information could improve trust in research and increase individuals’ willingness to volunteer for studies. Policies and practices are needed to enable the return of value to individuals with differing backgrounds and resources.
Acknowledgements:
The findings presented in this publication were developed in work supported by the National Institutes of Health under the following Award Numbers: U24TR001579, U54MD010722, UL1-TR000445 and U54MD007593. The content is solely the responsibility of the authors and does not necessarily represent the official views of the National Institutes of Health.
The authors express their sincere gratitude to Meredith O’Brien for her help in formatting the manuscript for publication, Nancy Kennedy for her literature searching aid, and Douglas Conway for his assistance in developing the graphical representation of respondent-provided zip codes.
Appendix
Appendix Exhibit A1: Return of Value Conceptual Framework
Appendix Exhibit A2: Return of Value Survey Instrument
Would you like to help researchers learn more about how to give back to research participants?
Are you interested in helping researchers who are trying to figure out better ways to give back to participants in their research studies? Researchers at Vanderbilt are looking for volunteers to complete a short survey. The survey will ask your opinion about different types of information that researchers may share back with participants.
You may be eligible for this study if:
You are 18 years or older
You are a healthy volunteer OR if you have one or more medical conditions
You are willing to complete a short web-based survey, estimated to take about 10 minutes.
If you are interested in participating in this study, please complete the questions below.
If you have questions about this study, please contact our Recruitment Innovation Center at 1–888-798–0885.
Please tell us a little bit about yourself.
Which term best describes your gender identity?
Male
Female
Neither
Other
Prefer not to answer
Please specify.
What is the highest grade or year of school you completed?
Never attended school or only attended kindergarten Grades 1 through 4 (Primary)
Grades 5 through 8 (Middle school) Grades 9 through 11 (Some high school) Grade 12 or GED (High school graduate)
College 1 to 3 years (Some college, Associate’s degree, or technical school) College 4 years or more (College graduate)
Advanced degree (Master’s, Doctorate, etc.) Prefer not to answer
Are you:
18–29
30–49
50–64
65–74
75 or older
Prefer not to answer
Which group(s) best describe you? Select all that apply.
American Indian or Alaska Native Asian or Asian American
Black, African American or African Hispanic, Latino, or Spanish Middle Eastern or North African
Native Hawaiian or other Pacific Islander White or Caucasian
None of these fully describe me Prefer not to answer
Please specify.
What is your annual household income from all sources?
Less than $10,000
$10,000– $24,999
$25,000– $34,999
$35,000– $49,999
$50,000– $74,999
$75,000–$99,999
$100,000– $149,999
$150,000– $199,999
$200,000 or more Prefer not to answer
What is your zip code?
Click here to enter a response Prefer not to answer
Please enter your zip code.
Research studies often look for how health can be affected by differences in people’s genes, lifestyle, and medical history. They collect this information using lab tests, medical records, and surveys. Sometimes they also collect DNA.
There are many ways that this information can be shared back with the volunteers in the study. A team of researchers at Vanderbilt University Medical Center is interested in learning about the types of information most important to volunteers. If you would like to participate, please complete the questions below.
If you were in a study like this, would getting your results be valuable to you or your family?
Yes
No
I’m not sure
Prefer not to answer
Should volunteers expect to receive research results when they agree to be in a study?
Yes
No
I’m not sure
Prefer not to answer
Have you ever participated in a medical research study (for example, a clinical trial, survey, etc.) before? *
Yes
No
I’m not sure
Prefer not to answer
Have you ever received results from a research study?
Yes No
I’m not sure
Prefer not to answer
What kind of results did you receive? Please check all that apply.
Survey or health assessment results
Genetic results
Lab results
Measurements (height, weight, blood pressure, etc.) Other
Please specify the ‘other’ results you received.
Would you be more likely to volunteer for a study if you were going to receive research results?
Yes
No
I’m not sure
Prefer not to answer
Would you be more likely to trust researchers if you received research results?
Yes
No
I’m not sure
Prefer not to answer
If you were in a study like this, how valuable would these types of information be to you? For each item below, please select a number from 1 to 7, with 1 being “not valuable” and 7 being “very valuable.”
Basic information about me. This includes my lab results, survey responses, height, weight, etc.
1 (not valuable)
2
3
4
5
6
7 (very valuable)
How my lifestyle affects my risk of getting a medical condition. This is from information about my diet, exercise, sleep, and habits like drinking, smoking, etc.
1 (not valuable)
2
3
4
5
6
7 (very valuable)
Information from my medical record. This includes my medical history like conditions, doctor visits, and procedures.
1 (not valuable)
2
3
4
5
6
7 (very valuable)
How my genetics affect my risk of getting a medical condition. This is from information collected from my DNA.
1 (not valuable)
2
3
4
5
6
7 (very valuable)
Information about how I may respond to some medications. This tells me which medications may be more helpful or harmful to me based on my genetics.
1 (not valuable)
2
3
4
5
6
7 (very valuable)
My Ancestry. This tells me what percent of my DNA comes from different parts of the world.
1 (not valuable)
2
3
4
5
6
7 (very valuable)
My Genetic Traits. This tells me about my physical characteristics like hair or eye color.
1 (not valuable)
2
3
4
5
6
7 (very valuable)
Information about how researchers are using my information. This can be updates about the study’s progress and findings.
1 (not valuable)
2
3
4
5
6
7 (very valuable)
Information about clinical trials near me. These can be studies on a health condition that interests me.
1 (not valuable)
2
3
4
5
6
7 (very valuable)
How my health and behaviors compare to others. This shows me how my diet, exercise, sleep, and habits like drinking, smoking, etc. compare to other volunteers.
1 (not valuable)
2
3
4
5
6
7 (very valuable)
How to connect with others like me in the study. This can be connecting me to other volunteers through a forum or personal stories shared in blog posts or reports.
1 (not valuable)
2
3
4
5
6
7 (very valuable)
Receiving monetary compensation for taking part in the study.
1 (not valuable)
2
3
4
5
6
7 (very valuable)
If you have a certain US dollar amount in mind, please share.
Of the items, which would be most valuable to you? (choose only one)
Basic information collected from me in the study
How my lifestyle affects my risks of getting a medical condition Information about me from my medical record
How my genetics affect my risks of getting a medical condition Information about how I may respond to some medications
My Ancestry
My Genetic Traits
Information about how researchers are using my information Information about clinical trials near me
How my heath condition and behaviors compare to others How to connect with others like me in the study
Of the items, which would be the least valuable to you? (choose only one)
Basic information collected from me in the study
How my lifestyle affects my risks of getting a medical condition Information about me from my medical record
How my genetics affect my risks of getting a medical condition Information about how I may respond to some medications
My Ancestry
My Genetic Traits
Information about how researchers are using my information Information about clinical trials near me
How my heath condition and behaviors compare to others How to connect with others like me in the study
Thank you for your feedback.
*Note: The question “Have you ever participated in a medical research study (for example, a clinical trial, survey, etc.) before?” was added to the survey for the Cint sample.
Appendix Exhibit A3: Additional Recruitment Information
ResearchMatch, a Vanderbilt-led collaboration, includes a national volunteer registry designed to help ‘match’ interested volunteers with eligible researchers from a large consortium of participating institutions. This resource served as the primary mechanism of recruitment between March through August 2018, leading to completion of roughly 80% of our overall sample target. ResearchMatch includes a total membership of ~130,000, and 59% of members have agreed to be contacted by a researcher about a study at least once through this mechanism, indicating that at least half ResearchMatch members have some degree of familiarity with research studies. As ResearchMatch demographics do not include measures of income or level of education, our survey approach included zip code-based recruitment using U.S. Census tract data to aid in reaching individuals with lower educational attainment. Participants identified via ResearchMatch were offered the option to enter a drawing to receive a $50 gift card; gift cards were sent to 20 randomly selected participants after the survey was closed to responses.
We deployed the survey via Cint between August and September 2018 to complement the ResearchMatch recruitment strategy. The survey invitation was sent to men older than age 65 and individuals with a high school education/equivalent or less, two groups less represented in the initial waves of ResearchMatch sampling. Approximately 10% of this portion of our sample indicated they had participated in a medical research study before. Respondents from the Cint platform were compensated by Cint using its existing mechanism, which includes a small monetary incentive (~$1.50 per participant for a completed survey).
Appendix Exhibit A4: Adjusted Standardized Residuals and Chi Square Tests
| If you were in a study like this, would getting your results be valuable to you or your family? | Should volunteers expect to receive research results when they agree to be in a study? | Would you be more likely to volunteer for a study if you were going to receive research results? | Would you be more likely to trust researchers if you received research results? | ||||||||||
|---|---|---|---|---|---|---|---|---|---|---|---|---|---|
| No | Yes | not sure | No | Yes | not sure | No | Yes | not sure | No | Yes | not sure | ||
| Age group | 18–29 | 5.4 | −1.6 | −1 | 3.9 | −2.3 | −1.1 | −3.1 | 3.4 | −1.3 | −2.6 | 1.2 | 1 |
| 30–49 | −1.8 | 5.6 | −5.1 | 3.6 | −1.6 | −1.7 | −0.6 | 5.4 | −6.3 | −1 | 3.7 | −3.8 | |
| 50–64 | −4 | 7.1 | −5.7 | −1.1 | 1 | −0.1 | 2.1 | −1.8 | 0.2 | 1.3 | −2 | 1.2 | |
| 65–74 | −0.4 | −7.5 | 8.2 | −3.7 | 2.2 | 1 | 1 | −3.6 | 3.6 | −0.3 | −0.9 | 1.4 | |
| 75 or older | 3.9 | −8.1 | 6.8 | −3.1 | 0.5 | 2.7 | −0.3 | −4.5 | 6 | 2.9 | −3.1 | 1 | |
| Ch. Sq. (d.f. = 8) | 199.41*** | 49.21*** | 91.23*** | 32.71*** | |||||||||
| Self-identified Race | American Indian or Alaska Native | n<5 | 0.1 | 0.2 | 0.2 | 1 | n<5 | −0.2 | 1.2 | n<5 | −0.2 | 1.3 | n<5 |
| Asian or Asian American | 1.2 | 1.2 | −1.9 | 0.9 | −0.4 | −0.4 | −2.2 | 0.8 | 1.1 | −4.1 | 1.1 | 2.7 | |
| Black, African American or African | −1 | 5.3 | −5.3 | 1.2 | 0.9 | −2.5 | 7.1 | −4.5 | −0.9 | −1.8 | 3.9 | −3.2 | |
| Hispanic, Latino, or Spanish | 2.9 | −2.3 | 1 | 2.8 | −1 | −1.6 | 1.6 | 1.2 | −3.1 | −1.5 | 3.9 | −3.5 | |
| Middle Eastern or North African | n<5 | 3.3 | −2.4 | −1.9 | 3.5 | −2.7 | −1.2 | 4.3 | n<5 | −0.5 | 4 | n<5 | |
| Native Hawaiian or other Pacific Islander | n<5 | 2.3 | −1.6 | n<5 | −0.3 | 3.9 | n<5 | 2.7 | −0.7 | n<5 | 0.2 | 3 | |
| White or Caucasian | −0.1 | −3.2 | 3.6 | −0.4 | 0.1 | 0.2 | −4.4 | 0.8 | 3.1 | 5.7 | −6.5 | 2.6 | |
| None of these fully describe me | −1 | 1.2 | −0.8 | −4.4 | −0.7 | 5.7 | −1.8 | 1.1 | 0.3 | −1.2 | 0.5 | 0.6 | |
| Prefer not to answer | −1.2 | −4.3 | 5.3 | −0.4 | −1.5 | 2.4 | 1 | −0.8 | 0.1 | −1.7 | −1.7 | 3.8 | |
| Ch. Sq. (d.f.=16) | 91.24*** | 100.73*** | 104.05*** | 125.76*** | |||||||||
| Gender | male | 0.3 | −1.2 | 1.1 | −1.1 | 1.5 | −0.8 | −1.2 | −0.4 | 1.7 | −0.7 | 0.8 | −0.3 |
| female | −0.9 | 1.4 | −1.1 | 0.4 | 0.4 | −1.1 | 1.1 | 0.1 | −1.2 | 1.1 | 0.2 | −1.3 | |
| other | 3 | −2 | 0.6 | 3.2 | −3.6 | 1.5 | 2.9 | −0.2 | n<5 | −0.3 | −2.4 | 3.3 | |
| neither | n<5 | 0.5 | −0.4 | −0.2 | −3 | 4.4 | −1.8 | 1 | 0.5 | −0.9 | −1 | 2.2 | |
| Ch. Sq. (d.f.=6) | 11.6 | 34.89*** | 19.63 | 17.4 | |||||||||
| Education | High School or less | 7.2 | −5 | 1.9 | −3 | 2.5 | 0.0 | 2.7 | −5.7 | 4.7 | −3.1 | −0.5 | 3.8 |
| College 1 to 3 years (Some college, Associate degree, or technical school) | 0.1 | −0.6 | 0.6 | −1.1 | −1 | 2.7 | −1.2 | 0 | 1.1 | −0.7 | 1.2 | −0.8 | |
| College 4 years or more (College graduate) | −1.2 | 3.7 | −3.4 | 2.6 | −2.6 | 0.7 | −0.3 | −0.8 | 1.3 | 2 | −1.2 | −0.5 | |
| Advanced degree (Master, Doctorate, etc.) | −3.2 | −0.1 | 1.7 | 0.2 | 2 | −2.9 | −0.3 | 4 | −5 | 0.5 | 0.4 | −1 | |
| Chi Sq. (d.f.=6) | 69.79*** | 25.72 | 50.09*** | 23.34 | |||||||||
| Income | Less than $24,999 | 3 | −2.5 | 1.2 | −1.4 | 0.4 | 1 | −0.7 | −0.3 | 1.1 | −2.3 | 0.7 | 1.4 |
| $25,000– $34,999 | 4.6 | −1.1 | −1.1 | 0.1 | −1.1 | 1.4 | 1.3 | −1.9 | 1.2 | −1.9 | 0.2 | 1.7 | |
| $35,000– $49,999 | −2.1 | 1.3 | −0.3 | −0.4 | −2.2 | 3.5 | −0.1 | 1 | −1.3 | 1 | 1.2 | −2.6 | |
| $50,000– $74,999 | −2.9 | 1.7 | −0.3 | 0.4 | −1.4 | 1.5 | 2.9 | −4 | 2.3 | −1.8 | 1.2 | 0.3 | |
| $75,000–$99,999 | 2.1 | −2.7 | 1.9 | 2 | −0.4 | −1.7 | −0.7 | −0.7 | 1.5 | 0.1 | 0.1 | −0.3 | |
| $100,000 or more | −1.8 | 1.6 | −0.8 | −1.1 | 3.7 | −4 | −2.5 | 4.8 | −3.7 | 3.1 | −2.6 | 0.2 | |
| Ch Sq. (d.f.=10) | 51.23*** | 34.65 | 36.9 | 26.9 | |||||||||
Absolute values of 2 represent proportions significantly above or below the expected.
Grey fill indicates those groups that have significant positive perceptions compared to the expected number of observations.
Bonferroni p<0.000055
Appendix Exhibit A5: Adjusted Standardized Residuals and Chi Square Tests: People who have received results
| Survey or Health Assessment | Genetic results | Lab results | Vital Signs (height, weight, blood pressure, etc.) | Other | ||
|---|---|---|---|---|---|---|
| Age | 18–29 | −3.2 | −0.5 | −2.1 | −0.5 | −1.3 |
| 30–49 | 1.9 | 0.4 | 5.1 | 5.6 | −1.2 | |
| 50–64 | −0.2 | 1.2 | 3.2 | 2.7 | 1.2 | |
| 65–74 | −2.4 | −0.5 | −6.2 | −7.2 | 1.3 | |
| 75 or older | 4.3 | −1.5 | −2.1 | −2.6 | −0.2 | |
| Ch. Sq. (d.f.=4) | 33.65*** | 3.58 | 63.90*** | 74.77*** | 4.87 | |
| Race | American Indian or Alaska Native | 0 | n<5 | n<5 | 0.4 | n<5 |
| Asian or Asian American | −1.7 | 0.5 | 1.9 | 0.6 | 1.6 | |
| Black, African American or African | 5.6 | −2.1 | 4.6 | 7.6 | −1.3 | |
| Hispanic, Latino, or Spanish | −5.4 | −3.7 | −2.6 | −3.8 | −1.7 | |
| Middle Eastern or North African | −2.1 | n<5 | −2.3 | n<5 | 1 | |
| Native Hawaiian or other Pacific Islander | −1.4 | 2.1 | −0.3 | 2.6 | n<5 | |
| White or Caucasian | 2.1 | 1.1 | −3.2 | −2.6 | 3.1 | |
| None of these fully describe me | −1.9 | 2.4 | −0.9 | −1.2 | n<5 | |
| Prefer not to answer | −2.8 | 5.7 | 4.4 | −1.2 | −0.2 | |
| Ch. Sq. (d.f.=8) | 74.27*** | 63.85*** | 57.98*** | 85.11*** | 28.57 | |
| Gender | male | 1.8 | 0.9 | −0.5 | −0.8 | −1.9 |
| female | −3.6 | −3.6 | −0.8 | −0.3 | 0.3 | |
| other | 0.6 | 3.1 | 0.3 | 0.6 | n<5 | |
| neither | 4.8 | 5.6 | 3.4 | 2.6 | 4.9 | |
| Ch. Sq. (d.f.=3) | 28.54*** | 44.07*** | 11.53 | 7.52 | 27.90*** | |
| Education | High School or less | −8 | −2.2 | −7.2 | −7 | n<5 |
| College 1 to 3 years (Some college, Associate degree, or technical school) | −3.4 | −0.1 | −2.9 | −3 | −4 | |
| College 4 years or more (College graduate) | 3.4 | 0.2 | 4.3 | 3.8 | 1.7 | |
| Advanced degree (Master, Doctorate, etc.) | 4.2 | 1.2 | 2.6 | 3 | 4 | |
| Ch. Sq. (d.f.=3) | 86.37*** | 5.37 | 70.04*** | 66.43*** | 37.52*** | |
| Income | Less than $24,999 | −1.8 | −1.4 | −1.4 | −1.2 | −0.8 |
| $25,000– $34,999 | −2.9 | −3 | −5.7 | −4 | −3.6 | |
| $35,000– $49,999 | −3.4 | −0.8 | 1.5 | −1.5 | −1 | |
| $50,000– $74,999 | −0.6 | −0.7 | −0.5 | 1 | 1.1 | |
| $75,000–$99,999 | 3 | 2.5 | 2.6 | −0.6 | 0 | |
| $100,000 or more | 3.5 | 1.8 | 1.5 | 3.8 | 2.4 | |
| Ch. Sq. (d.f.=5) | 36.90*** | 18.43 | 40.82*** | 28.88*** | 18.19 |
Bonferroni p<0.000055
Grey fill for those groups that have significant positive perceptions compared to the expected number of observations.
Appendix Exhibit A6: ANOVA Results
Bonferroni p<0.000055
Appendix Exhibit A7: Most and least valuable types of information, by demographic groups
| Of the items, which would be the least valuable to you? (choose only one): Analysis by age | |||||||||||
|---|---|---|---|---|---|---|---|---|---|---|---|
| Basic information collected from me in the study | How my lifestyle affects my risks of getting a medical condition | Information about me from my medical record | How my genetics affect my risks of getting a medical condition | Information about how I may respond to some medications | My Ancestry | My Genetic Traits | Information about how researchers are using my information | Information about clinical trials near me | How my heath condition and behaviors compare to others | How to connect with others like me in the study | |
| 18–29 | 24.9% | 2.6% | 5.3% | 4.4% | 0.7% | 7.9% | 4.00% | 3.20% | 4.10% | 5.30% | 37.50% |
| 30–49 | 21.9% | 3.8% | 6.4% | 4.3% | 1.5% | 8.9% | 3.10% | 3.10% | 4.40% | 6.50% | 36.10% |
| 50–64 | 16.7% | 3.1% | 7.6% | 5.5% | 1.4% | 9.1% | 4.30% | 4.80% | 3.60% | 9.00% | 34.80% |
| 65–74 | 13.1% | 7.8% | 7.2% | 14.7% | 4.2% | 12.4% | 5.90% | 4.20% | 1.30% | 6.20% | 22.90% |
| 75 or older | 15.40% | 4.80% | 6.70% | 13.50% | 3.80% | 17.30% | 2.90% | 3.80% | 4.80% | 4.80% | 22.10% |
| Of the items, which would be most valuable to you? (choose only one): Analysis by age | |||||||||||
| Basic information collected from me in the study | How my lifestyle affects my risks of getting a medical condition | Information about me from my medical record | How my genetics affect my risks of getting a medical condition | Information about how I may respond to some medications | My Ancestry | My Genetic Traits | Information about how researchers are using my information | Information about clinical trials near me | How my heath condition and behaviors compare to others | How to connect with others like me in the study | |
| 18–29 | 5.30% | 16.80% | 3.70% | 33.50% | 4.90% | 9.10% | 9.60% | 8.20% | 2.80% | 2.40% | 3.80% |
| 30–49 | 7.40% | 12.10% | 4.10% | 30.90% | 7.80% | 8.70% | 10.90% | 6.40% | 3.10% | 4.30% | 4.30% |
| 50–64 | 9.00% | 11.40% | 4.50% | 26.00% | 7.60% | 8.00% | 7.10% | 7.60% | 9.50% | 3.80% | 5.50% |
| 65–74 | 6.50% | 7.50% | 4.60% | 17.00% | 8.20% | 11.40% | 5.20% | 8.20% | 10.50% | 4.60% | 16.30% |
| 75 or older | 4.80% | 16.30% | 17.30% | 10.60% | 5.80% | 6.70% | 9.60% | 9.60% | 5.80% | 13.50% | |
| Of the items, which would be the least valuable to you? (choose only one): Analysis by race/ethnicity | |||||||||||
| Basic information collected from me in the study | How my lifestyle affects my risks of getting a medical condition | Information about me from my medical record | How my genetics affect my risks of getting a medical condition | Information about how I may respond to some medications | My Ancestry | My Genetic Traits | Information about how researchers are using my information | Information about clinical trials near me | How my heath condition and behaviors compare to others | How to connect with others like me in the study | |
| American Indian or Alaska Native | 21.40% | 4.80% | 11.90% | 7.10% | 4.80% | 7.10% | 9.50% | 7.10% | 2.40% | 9.50% | 14.30% |
| Asian or Asian American | 21.20% | 2.30% | 6.50% | 2.90% | 1.00% | 9.10% | 3.60% | 2.30% | 5.50% | 4.60% | 41.00% |
| Black, African American or African | 17.80% | 3.30% | 5.70% | 3.70% | 1.30% | 9.10% | 3.00% | 4.00% | 4.60% | 8.50% | 38.90% |
| Hispanic, Latino, or Spanish | 20.10% | 3.60% | 6.70% | 6.40% | 1.20% | 5.80% | 5.50% | 3.30% | 3.60% | 6.10% | 37.70% |
| Middle Eastern or North African | 40.90% | 9.10% | 4.50% | 4.50% | 4.50% | 4.50% | 31.80% | ||||
| Native Hawaiian or other Pacific Islander | 20.00% | 10.00% | 10.00% | 10.00% | 10.00% | 40.00% | |||||
| White or Caucasian | 20.50% | 4.50% | 6.90% | 9.30% | 2.30% | 11.00% | 4.30% | 3.80% | 2.80% | 5.90% | 28.60% |
| None of these fully describe me | 23.30% | 5.00% | 3.30% | 5.00% | 1.70% | 10.00% | 1.70% | 1.70% | 6.70% | 8.30% | 33.30% |
| Prefer not to answer | 24.30% | 2.70% | 5.40% | 10.80% | 2.70% | 8.10% | 2.70% | 10.80% | 32.40% | ||
| Of the items, which would be most valuable to you? (choose only one): Analysis by race/ethnicity | |||||||||||
| Basic information collected from me in the study | How my lifestyle affects my risks of getting a medical condition | Information about me from my medical record | How my genetics affect my risks of getting a medical condition | Information about how I may respond to some medications | My Ancestry | My Genetic Traits | Information about how researchers are using my information | Information about clinical trials near me | How my heath condition and behaviors compare to others | How to connect with others like me in the study | |
| American Indian or Alaska Native | 11.90% | 14.30% | 2.40% | 14.30% | 16.70% | 4.80% | 11.90% | 4.80% | 4.80% | 2.40% | 11.90% |
| Asian or Asian American | 4.90% | 19.20% | 5.90% | 38.80% | 5.50% | 2.90% | 7.50% | 7.80% | 2.30% | 2.90% | 2.30% |
| Black, African American or African | 8.30% | 15.00% | 3.90% | 25.60% | 6.50% | 10.40% | 9.60% | 9.20% | 4.60% | 2.20% | 4.70% |
| Hispanic, Latino, or Spanish | 8.20% | 11.20% | 3.60% | 31.90% | 4.30% | 11.90% | 9.40% | 6.10% | 4.30% | 4.60% | 4.60% |
| Middle Eastern or North African | 9.10% | 13.60% | 22.70% | 4.50% | 13.60% | 22.70% | 9.10% | 4.50% | |||
| Native Hawaiian or other Pacific Islander | 10.00% | 10.00% | 10.00% | 40.00% | 10.00% | 10.00% | 10.00% | ||||
| White or Caucasian | 6.00% | 10.30% | 3.70% | 26.80% | 8.60% | 8.40% | 8.00% | 6.90% | 7.20% | 4.80% | 9.20% |
| None of these fully describe me | 3.30% | 6.70% | 5.00% | 20.00% | 10.00% | 15.00% | 15.00% | 6.70% | 10.00% | 5.00% | 3.30% |
| Prefer not to answer | 16.20% | 10.80% | 2.70% | 29.70% | 5.40% | 5.40% | 2.70% | 5.40% | 8.10% | 8.10% | 5.40% |
| Of the items, which would be the least valuable to you? (choose only one): Analysis by gender | |||||||||||
| Basic information collected from me in the study | How my lifestyle affects my risks of getting a medical condition | Information about me from my medical record | How my genetics affect my risks of getting a medical condition | Information about how I may respond to some medications | My Ancestry | My Genetic Traits | Information about how researchers are using my information | Information about clinical trials near me | How my heath condition and behaviors compare to others | How to connect with others like me in the study | |
| male | 19.90% | 4.20% | 6.30% | 7.40% | 2.00% | 11.30% | 4.60% | 4.40% | 3.20% | 6.60% | 30.10% |
| female | 20.50% | 3.60% | 6.40% | 5.60% | 1.50% | 8.20% | 3.50% | 3.00% | 4.20% | 6.70% | 36.90% |
| other | 6.70% | 6.70% | 6.70% | 20.00% | 13.30% | 6.70% | 6.70% | 6.70% | 26.70% | ||
| neither | 22.20% | 14.80% | 11.10% | 3.70% | 11.10% | 3.70% | 3.70% | 29.60% | |||
| Of the items, which would be most valuable to you? (choose only one): Analysis by gender | |||||||||||
| Basic information collected from me in the study | How my lifestyle affects my risks of getting a medical condition | Information about me from my medical record | How my genetics affect my risks of getting a medical condition | Information about how I may respond to some medications | My Ancestry | My Genetic Traits | Information about how researchers are using my information | Information about clinical trials near me | How my heath condition and behaviors compare to others | How to connect with others like me in the study | |
| male | 7.10% | 12.10% | 4.30% | 25.40% | 6.90% | 10.30% | 7.20% | 6.90% | 8.20% | 3.90% | 7.60% |
| female | 7.10% | 13.20% | 3.80% | 30.10% | 6.90% | 8.00% | 10.00% | 7.80% | 3.70% | 3.70% | 5.70% |
| other | 6.70% | 6.70% | 40.00% | 20.00% | 6.70% | 6.70% | 6.70% | 6.70% | |||
| neither | 3.70% | 22.20% | 3.70% | 22.20% | 18.50% | 7.40% | 11.10% | 7.40% | 3.70% | ||
| Of the items, which would be the least valuable to you? (choose only one): Analysis by educational attainment | |||||||||||
| Basic information collected from me in the study | How my lifestyle affects my risks of getting a medical condition | Information about me from my medical record | How my genetics affect my risks of getting a medical condition | Information about how I may respond to some medications | My Ancestry | My Genetic Traits | Information about how researchers are using my information | Information about clinical trials near me | How my heath condition and behaviors compare to others | How to connect with others like me in the study | |
| High School or less | 16.60% | 8.20% | 6.10% | 18.40% | 3.30% | 13.80% | 7.30% | 5.90% | 2.30% | 4.00% | 14.00% |
| College 1 to 3 years (Some college, Associate degree, or technical school) | 21.20% | 2.80% | 6.30% | 3.40% | 1.30% | 7.60% | 3.20% | 3.60% | 3.50% | 7.30% | 39.90% |
| College 4 years or more (College graduate) | 20.30% | 1.90% | 5.40% | 2.80% | 1.60% | 8.30% | 2.90% | 2.80% | 4.70% | 8.40% | 41.00% |
| Advanced degree (Master, Doctorate, etc.) | 22.40% | 3.00% | 8.40% | 2.00% | 0.70% | 8.90% | 2.80% | 2.70% | 4.30% | 6.20% | 38.60% |
| Of the items, which would be most valuable to you? (choose only one) : Analysis by educational attainment | |||||||||||
| Basic information collected from me in the study | How my lifestyle affects my risks of getting a medical condition | Information about me from my medical record | How my genetics affect my risks of getting a medical condition | Information about how I may respond to some medications | My Ancestry | My Genetic Traits | Information about how researchers are using my information | Information about clinical trials near me | How my heath condition and behaviors compare to others | How to connect with others like me in the study | |
| High School or less | 11.40% | 8.90% | 6.80% | 10.00% | 3.90% | 11.00% | 7.20% | 7.00% | 7.70% | 7.20% | 18.90% |
| College 1 to 3 years (Some college, Associate degree, or technical school) | 6.30% | 13.30% | 3.70% | 27.80% | 7.60% | 11.40% | 8.90% | 7.90% | 7.00% | 3.50% | 2.60% |
| College 4 years or more (College graduate) | 5.70% | 15.30% | 3.30% | 36.20% | 7.30% | 7.60% | 9.40% | 6.40% | 3.60% | 2.30% | 2.90% |
| Advanced degree (Master, Doctorate, etc.) | 5.20% | 13.00% | 2.30% | 37.30% | 9.50% | 5.40% | 9.50% | 8.90% | 4.00% | 2.50% | 2.30% |
| Of the items, which would be the least valuable to you? (choose only one): Analysis by income | |||||||||||
| Basic information collected from me in the study | How my lifestyle affects my risks of getting a medical condition | Information about me from my medical record | How my genetics affect my risks of getting a medical condition | Information about how I may respond to some medications | My Ancestry | My Genetic Traits | Information about how researchers are using my information | Information about clinical trials near me | How my heath condition and behaviors compare to others | How to connect with others like me in the study | |
| Less than $24,999 | 22.30% | 3.50% | 5.40% | 7.00% | 2.50% | 10.90% | 4.50% | 4.70% | 2.70% | 6.80% | 29.80% |
| $25,000– $34,999 | 19.50% | 4.30% | 7.30% | 6.30% | 1.30% | 13.50% | 5.90% | 4.60% | 3.30% | 5.30% | 28.70% |
| $35,000– $49,999 | 20.20% | 5.60% | 7.80% | 6.20% | 1.70% | 10.10% | 3.10% | 1.70% | 2.50% | 7.80% | 33.30% |
| $50,000– $74,999 | 16.40% | 4.10% | 5.40% | 9.30% | 0.60% | 8.00% | 4.30% | 5.40% | 5.40% | 6.90% | 34.10% |
| $75,000–$99,999 | 20.70% | 4.30% | 7.20% | 8.00% | 2.50% | 8.00% | 2.20% | 2.90% | 5.40% | 3.60% | 35.10% |
| $100,000 or more | 22.40% | 2.60% | 7.50% | 3.50% | 1.40% | 7.10% | 4.50% | 1.70% | 3.50% | 6.10% | 39.60% |
| Of the items, which would be most valuable to you? (choose only one): Analysis by income | |||||||||||
| Basic information collected from me in the study | How my lifestyle affects my risks of getting a medical condition | Information about me from my medical record | How my genetics affect my risks of getting a medical condition | Information about how I may respond to some medications | My Ancestry | My Genetic Traits | Information about how researchers are using my information | Information about clinical trials near me | How my heath condition and behaviors compare to others | How to connect with others like me in the study | |
| Less than $24,999 | 7.90% | 12.40% | 5.20% | 23.30% | 5.80% | 12.20% | 9.70% | 7.00% | 5.40% | 3.90% | 7.20% |
| $25,000– $34,999 | 8.00% | 12.00% | 4.30% | 25.90% | 4.00% | 7.30% | 8.30% | 8.60% | 7.00% | 4.30% | 10.30% |
| $35,000– $49,999 | 6.70% | 15.70% | 2.50% | 28.60% | 5.90% | 9.20% | 9.50% | 6.40% | 5.00% | 3.90% | 6.40% |
| $50,000– $74,999 | 6.30% | 13.40% | 4.50% | 27.60% | 8.00% | 8.40% | 8.20% | 6.00% | 6.00% | 4.30% | 7.10% |
| $75,000–$99,999 | 8.00% | 10.50% | 1.40% | 28.60% | 6.20% | 10.10% | 11.60% | 7.20% | 4.30% | 5.10% | 6.90% |
| $100,000 or more | 7.10% | 13.40% | 5.00% | 35.60% | 9.70% | 5.90% | 6.40% | 7.80% | 4.50% | 2.60% | 2.10% |
Appendix Exhibit A8. Most and least valuable types of information, by education.
***Bonferroni p<0.000055
***Bonferroni p<0.000055
Appendix Exhibit A9. Most and least valuable types of information, by race.
***Bonferroni p<0.000055
***Bonferroni p<0.000055
Appendix Exhibit A10. Most and least valuable types of information, by age.
***Bonferroni p<0.000055
References
- 1.Mello MM, Lieou V, Goodman SN. Clinical Trial Participants’ Views of the Risks and Benefits of Data Sharing. N Engl J Med 2018. 07;378(23):2202–11. [DOI] [PMC free article] [PubMed] [Google Scholar]
- 2.Shalowitz DI, Miller FG. Disclosing individual results of clinical research: implications of respect for participants. JAMA 2005. August 10;294(6):737–40. [DOI] [PubMed] [Google Scholar]
- 3.Kaufman DJ, Baker R, Milner LC, Devaney S, Hudson KL. A Survey of U.S Adults’ Opinions about Conduct of a Nationwide Precision Medicine Initiative® Cohort Study of Genes and Environment. PLoS ONE 2016;11(8):e0160461. [DOI] [PMC free article] [PubMed] [Google Scholar]
- 4.Botkin J, Mancher M, Busta E, Downey A. Returning Individual Research Results to Participants: Guidance for a New Research Paradigm [Internet] The National Academies Press; 2018. [cited 2018 Aug 17]. Available from: https://www.nap.edu/read/25094/chapter/1 [PubMed] [Google Scholar]
- 5.Middleton A, Morley KI, Bragin E, Firth HV, Hurles ME, Wright CF, et al. Attitudes of nearly 7000 health professionals, genomic researchers and publics toward the return of incidental results from sequencing research. Eur J Hum Genet 2016. January;24(1):21–9. [DOI] [PMC free article] [PubMed] [Google Scholar]
- 6.Bunnik EM, Janssens ACJW, Schermer MHN. Personal utility in genomic testing: is there such a thing? J Med Ethics 2015. April;41(4):322–6. [DOI] [PubMed] [Google Scholar]
- 7.Klitzman R, Appelbaum PS, Fyer A, Martinez J, Buquez B, Wynn J, et al. Researchers’ views on return of incidental genomic research results: qualitative and quantitative findings. Genet Med 2013. November;15(11):888–95. [DOI] [PMC free article] [PubMed] [Google Scholar]
- 8.Hauser D, Obeng AO, Fei K, Ramos MA, Horowitz CR. Views Of Primary Care Providers On Testing Patients For Genetic Risks For Common Chronic Diseases. Health Aff (Millwood) 2018;37(5):793–800. [DOI] [PMC free article] [PubMed] [Google Scholar]
- 9.Shah SK, Hull SC, Spinner MA, Berkman BE, Sanchez LA, Abdul-Karim R, et al. What Does the Duty to Warn Require? Am J Bioeth 2013;13(10):62–3. [DOI] [PMC free article] [PubMed] [Google Scholar]
- 10.Wong CA, Hernandez AF, Califf RM. Return of Research Results to Study Participants: Uncharted and Untested. JAMA 2018. August 7;320(5):435–6. [DOI] [PubMed] [Google Scholar]
- 11.Goytia CN, Kastenbaum I, Shelley D, Horowitz CR, Kaushal R. A Tale of 2 Constituencies: Exploring Patient and Clinician Perspectives in the Age of Big Data. Medical Care 2018. August;1. [DOI] [PMC free article] [PubMed]
- 12.Halverson CM, Clift KE, McCormick JB. Was it worth it? Patients’ perspectives on the perceived value of genomic-based individualized medicine. J Community Genet 2016. April;7(2):145–52. [DOI] [PMC free article] [PubMed] [Google Scholar]
- 13.Witteman HO, Scherer LD, Gavaruzzi T, Pieterse AH, Fuhrel-Forbis A, Chipenda Dansokho S, et al. Design Features of Explicit Values Clarification Methods: A Systematic Review. Med Decis Making 2016;36(4):453–71. [DOI] [PubMed] [Google Scholar]
- 14.Wilkins C. Precision Medicine for Everyone [Internet]. NEJM Catalyst. 2018 [cited 2018 Aug 17]. Available from: https://catalyst.nejm.org/precision-medicine-initiative-everyone/
- 15.Eckstein L, Garrett JR, Berkman BE. A Framework for Analyzing the Ethics of Disclosing Genetic Research Findings. J Law Med Ethics 2014. June;42(2):190–207. [DOI] [PMC free article] [PubMed] [Google Scholar]
- 16. To access the Appendix, click on the Appendix link in the box to the right of the article online.
- 17.Joosten YA, Israel TL, Williams NA, Boone LR, Schlundt DG, Mouton CP, et al. Community Engagement Studios: A Structured Approach to Obtaining Meaningful Input From Stakeholders to Inform Research. Acad Med 2015. December;90(12):1646–50. [DOI] [PMC free article] [PubMed] [Google Scholar]
- 18.Harris PA, Scott KW, Lebo L, Hassan N, Lightner C, Pulley J. ResearchMatch: a national registry to recruit volunteers for clinical research. Acad Med 2012. January;87(1):66–73. [DOI] [PMC free article] [PubMed] [Google Scholar]
- 19.Harris PA, Taylor R, Thielke R, Payne J, Gonzalez N, Conde JG. Research electronic data capture (REDCap)--a metadata-driven methodology and workflow process for providing translational research informatics support. J Biomed Inform 2009. April;42(2):377–381. [DOI] [PMC free article] [PubMed] [Google Scholar]
- 20.Popejoy AB, Fullerton SM. Genomics is failing on diversity. Nature 2016. 13;538(7624):161–4. [DOI] [PMC free article] [PubMed] [Google Scholar]
- 21.Bollinger J, Scott J, Dvoskin R, Kaufman D. Public preferences regarding the return of individual genetic research results: findings from a qualitative focus group study. Genet Med 2012. April;14(4):451–7. [DOI] [PMC free article] [PubMed] [Google Scholar]
- 22.Garrison NA, Sathe NA, Antommaria AHM, Holm IA, Sanderson SC, Smith ME, et al. A systematic literature review of individuals’ perspectives on broad consent and data sharing in the United States. Genet Med 2016. July;18(7):663–71. [DOI] [PMC free article] [PubMed] [Google Scholar]
- 23.Zikmund-Fisher BJ, Exe NL, Witteman HO. Numeracy and literacy independently predict patients’ ability to identify out-of-range test results. J Med Internet Res 2014. August 8;16(8):e187. [DOI] [PMC free article] [PubMed] [Google Scholar]
- 24.Sharit J, Lisigurski M, Andrade AD, Karanam C, Nazi KM, Lewis JR, et al. The Roles of Health Literacy, Numeracy, and Graph Literacy on the Usability of the VA’s Personal Health Record by Veterans. J Usability Studies 2014. August;9(4):173–193. [Google Scholar]
- 25.Zikmund-Fisher BJ, Scherer AM, Witteman HO, Solomon JB, Exe NL, Tarini BA, et al. Graphics help patients distinguish between urgent and non-urgent deviations in laboratory test results. J Am Med Inform Assoc 2017. May 1;24(3):520–8. [DOI] [PMC free article] [PubMed] [Google Scholar]
- 26.Hartz SM, Quan T, Ibiebele A, Fisher SL, Olfson E, Salyer P, et al. The significant impact of education, poverty, and race on Internet-based research participant engagement. Genet Med 2017;19(2):240–3. [DOI] [PMC free article] [PubMed] [Google Scholar]
- 27.Sarkar U, Karter AJ, Liu JY, Adler NE, Nguyen R, López A, et al. Social disparities in internet patient portal use in diabetes: evidence that the digital divide extends beyond access. J Am Med Inform Assoc 2011. May 1;18(3):318–21. [DOI] [PMC free article] [PubMed] [Google Scholar]
- 28.Knoppers BM, Zawati MH, Sénécal K. Return of genetic testing results in the era of whole-genome sequencing. Nature Reviews Genetics 2015. September;16(9):553–9. [DOI] [PubMed] [Google Scholar]
- 29.Wolf SM, Burke W, Koenig BA. Mapping the Ethics of Translational Genomics: Situating Return of Results and Navigating the Research-Clinical Divide. J Law Med Ethics 2015;43(3):486–501. [DOI] [PMC free article] [PubMed] [Google Scholar]
- 30.FDA. Reduced effectiveness of Plavix (clopidogrel) in patients who are poor metabolizers of the drug [Internet] [cited 2018. Oct 2]. Available from: https://www.fda.gov/Drugs/DrugSafety/PostmarketDrugSafetyInformationforPatientsandProviders/ucm203888.htm
- 31.Guidelines [Internet] [cited 2018. Oct 2]. Available from: https://cpicpgx.org/guidelines/
- 32.Jones LK, Rahm AK, Gionfriddo MR, Williams JL, Fan AL, Pulk RA, et al. Developing Pharmacogenomic Reports: Insights from Patients and Clinicians [Internet] [cited 2018. October 2]. Available from: https://www.ncbi.nlm.nih.gov/pmc/articles/PMC5944570/ [DOI] [PMC free article] [PubMed]
- 33.Zikmund-Fisher BJ. The right tool is what they need, not what we have: a taxonomy of appropriate levels of precision in patient risk communication. Med Care Res Rev 2013. February;70(1 Suppl):37S–49S. [DOI] [PubMed] [Google Scholar]