

Abstract
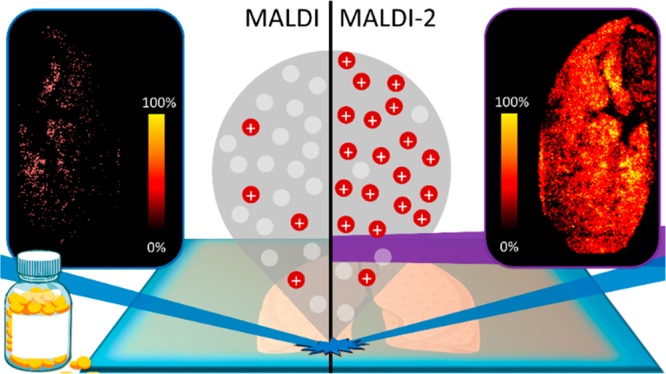
Visualizing the distributions of drugs and their metabolites is one of the key emerging application areas of matrix-assisted laser desorption/ionization–mass spectrometry imaging (MALDI-MSI) within pharmaceutical research. The success of a given MALDI-MSI experiment is ultimately determined by the ionization efficiency of the compounds of interest, which in many cases are too low to enable detection at relevant concentrations. In this work we have taken steps to address this challenge via the first application of laser-postionisation coupled with MALDI (so-called MALDI-2) to the analysis and imaging of pharmaceutical compounds. We demonstrate that MALDI-2 increased the signal intensities for 7 out of the 10 drug compounds analyzed by up to 2 orders of magnitude compared to conventional MALDI analysis. This gain in sensitivity enabled the distributions of drug compounds in both human cartilage and dog liver tissue to be visualized using MALDI-2, whereas little-to-no signal from tissue was obtained using conventional MALDI. This work demonstrates the vast potential of MALDI-2-MSI in pharmaceutical research and drug development and provides a valuable tool to broaden the application areas of MSI. Finally, in an effort to understand the ionization mechanism, we provide the first evidence that the preferential formation of [M + H]+ ions with MALDI-2 has no obvious correlation with the gas-phase proton affinity values of the analyte molecules, suggesting, as with MALDI, the occurrence of complex and yet to be elucidated ionization phenomena.
Determining the distributions of pharmaceutical compounds and their metabolites within tissues is an important step in drug development. Mass spectrometry imaging (MSI) is playing an increasing role in drug development owing to its ability to simultaneously detect and differentiate the spatial distributions of both drugs and their metabolites while simultaneously imaging endogenous biomolecules such as lipids, metabolites, and proteins.1 Various desorption/ionization methods, including desorption electrospray ionization (DESI)2,3 and secondary ionization mass spectrometry (SIMS),4−6 have been deployed for drug and metabolite imaging in tissues and even individual cells.7−9 Of these, matrix-assisted laser/desorption ionization (MALDI) has been most widely utilized. Nowadays, imaging for pharmaceutical compounds is one of the emerging applications of MSI,10,11 which enables monitoring both drug metabolism and pharmacokinetics (DMPK), even with absolute quantification.12−14 MALDI-MSI typically offers the capability to detect many molecular classes depending on the employed sample preparation methods and spatial resolutions which can be as low as 10 μm for commercial instruments15 and down to ∼1 μm for prototype systems.16,17 In addition to pharmaceutical imaging, MALDI-MSI has been applied successfully in different fields where both spatial and spectral information are needed, such as pathology,18 clinical applications,19 biomarker discovery,20 and forensics.21
MSI of pharmaceuticals (or any analyte) is not without challenges. MALDI, like all ionization methods, suffers from a low ionization efficiency for many analytes. Ionization efficiencies (i.e., the ratio of MALDI-generated ions to desorbed neutrals) are estimated to be on the order of 1 × 10⁻⁴ and lower.22−24 This imposes a significant sensitivity limit as many molecules are not detected by mass spectrometry at relevant concentrations. Furthermore, ionization efficiencies can vary by orders of magnitude for different compounds and it is often difficult to predict whether a given analyte will have a higher ionization efficiency than another, thereby making the success of a given MSI experiment hard to predict a priori. This effect is augmented further in MSI studies where tissue-dependent ion suppression effects can additionally inhibit sensitivity heterogeneously within a sample.25,26 Given the fact that ionization efficiency is a key factor in determining the limit of detection, it is an important metric for quantitative pharmaceutical-focused MSI studies.
Selective chemical derivatization of specific functional groups of target analyte(s) is one strategy to improve ionization efficiency. The most common approach is to introduce a fixed-charge quaternary nitrogen group to the analyte.27−29 However, derivatization also has drawbacks like long reaction times (up to several hours for completion) and potential delocalization masking the true distribution of target compounds. Online derivatization methods, such as reactive DESI, can help ameliorate these effects but typically has lower spatial resolution than MALDI.30 An alternative method to enhance MALDI ionization efficiencies is the use of postionization strategies. These methods deploy a second ionization event spatially and temporally separated from the primary laser desorption event to increase the overall yield of ions.31 Unlike derivatization, postionization does not require additional sample preparation steps and can be performed directly on samples prepared for conventional MALDI analysis. For example, Lu et al. reported postionization using 118 nm photons coupled with 532 nm direct laser desorption and demonstrated significant sensitivity improvements for folic acid detection in mouse tumor tissue.32 More recently, plasma ionization coupled with atmospheric pressure MALDI also revealed significant gains in sensitivity for a number of lipid and drug species.33 Alternatively, Soltwisch et al. combined laser postionization with MALDI using a UV OPO laser, emitting photons capable of inducing two-photon ionization of desorbed matrix molecules.34 To explain the enhancement of ion yield, it is hypothesized that matrix radical cations formed by photoionization interact with themselves and neutral molecules in the still relatively dense MALDI plume. These interactions form intermediate reactive species capable of ionizing neutral molecules via protonation/deprotonation processes (Supporting Information, Figure 1). This process also shares many similarities with conventional MALDI in that ionization is driven by initial ionization of the matrix and subsequent ion/molecule reactions. This method, termed MALDI-2, was shown to provide increased sensitivity, of up to 2 orders of magnitude, for many lipid species.34,35 In this work, we report the first application of MALDI-2 for the enhanced detection and imaging of pharmaceutical compounds. We demonstrate that the sensitivity for a variety of tested compounds poorly ionized by MALDI was substantially improved by MALDI-2 in the positive-ion mode. Combined, this work represents a substantial leap in the analytical capabilities of MALDI-MSI for studying drug metabolism in tissues.
Materials and Methods
Reagents and Solvents
2,5-Dihydroxybenzoic acid (DHB) and trifluoroacetic acid (TFA) were purchased from Sigma-Aldrich (Zwijndrecht, The Netherlands). Ultrapure water (LC-MS grade) and methanol (MeOH; HPLC grade) were purchased from Fisher Scientific (Loughborough, Leicestershire, U.K.). Ketoconazole, terfenadine, haloperidol, doxorubicin, paclitaxel, kynurenine, triamcinolone acetonide (TAA), caffeine, fluoxetine, and ibuprofen standards were originally purchased from Fisher Scientific (Loughborough, Leicestershire, U.K.). Dulbecco’s modified Eagle’s medium (DMEM) and penicillin/streptomycin (P/S) were purchased from Thermo Fisher Scientific (Waltham, MA, U.S.A.). Fetal bovine serum (FBS) was purchased from HyClone (Eindhoven, The Netherlands) and ammonium acetate was purchased from AMRESCO (Solon, OH, U.S.A.). Hematoxylin solution modified according to Gill and Entellan new was purchased from Merck KGaA (Darmstadt, Germany). Safranin-O and Fast Green were purchased from Sigma-Aldrich (Zwijndrecht, The Netherlands). Eosine-Y, alcoholic, was purchased from Avantor Performance Materials B.V. (Deventer, The Netherlands), and coverslips were purchased from Thermo Scientific (Waltham, Massachusetts, U.S.A.).
Tissue Collection
Cartilage
The cartilage was obtained from an osteoarthritic patient undergoing total knee arthroplasty and rinsed with PBS containing 1% P/S. Explants from cartilage tissue (5 × 5 mm) were placed in a 24-well plate and incubated with TAA (43.5 ng/μL) at a total volume of 500 μL for 48 h in a humidified incubator in an environment of 5% CO2 and 37 °C. After the incubation, cartilage chips were rinsed with ice-cold ammonium acetate buffer (150 mM, pH 7.3), snap-frozen in liquid nitrogen, and stored at −80 °C until analysis.
Liver
Janssen R&D (Beerse, Belgium) provided canine liver tissue dosed with drug compound A at 65 mg/kg. Liver was resected, snap-frozen on aluminum foil floating on liquid nitrogen, and subsequently stored at −80 °C until sectioning and analysis. For confidentiality reasons, structural information on the drug cannot be revealed and only nominal mass information can be supplied.
All tissues were sectioned at 12 μm thickness and −20 °C using a Leica cryostat (Leica Microsystems, Wetzlar, Germany) and thaw mounted onto indium tin oxide (ITO)-coated glass slides (4–8 Ω resistance, Delta Technologies, U.S.A.) and stored at −80 °C until analysis.
MALDI Sample Preparation
Single Standard Analysis
Ten compounds (ketoconazole, terfenadine, haloperidol, doxorubicin, paclitaxel, kynurenine, triamcinolone acetonide, caffeine, fluoxetine, and ibuprofen) were separately prepared and mixed with DHB matrix solution (20 mg/mL, 70% MeOH, + 0.2% TFA) obtaining a final drug concentration of 0.5 mg/mL. The full list of drugs can be found in the Supporting Information, Table 1. The drug-matrix solution was sprayed onto an ITO-coated glass slide using a TM-Sprayer (HTX Technologies, U.S.A.) to obtain a homogeneous coating of each drug/matrix mixture. The spraying parameters were as follows: flow rate, 0.11 mL/min; velocity, 1200 mm/min; temperature of the nozzle, 85 °C; track spacing, 2 mm; and pressure, 10 psi. Diluted solutions were also prepared for doxorubicin, paclitaxel (0.05 mg/mL), ketoconazole, terfenadine, and haloperidol (0.05 and 0.001 mg/mL) and sprayed onto the glass slide using the same protocol.
Triamcinolone Acetonide Sensitivity Evaluation
A dilution series was prepared and mixed with DHB (20 mg/mL prepared in 70% MeOH, 30% water, and 0.2% TFA) to give final solution concentrations of 0.005, 0.01, 0.02, 0.05, 0.1, 0.2, 0.5, 1.0, 1.5, and 2.5 ng/μL. Each solution was sprayed onto a separate glass slide. Ten layers of the matrix/TAA solution were applied on the slide using the TM-Sprayer with the same parameters described above.
Tissue Imaging
For tissue imaging experiments, 12 layers of DHB (20 mg/mL prepared in 70% MeOH with 0.2% TFA) were sprayed onto the tissue sections using the TM-sprayer: flow rate, 0.11 mL/min; velocity, 1200 mm/min; temperature of the nozzle, 75 °C; track spacing, 2 mm; and pressure, 10 psi.
Mass Spectrometry and Laser Postionization
An Orbitrap Elite mass spectrometer (Thermo Fisher Scientific, Bremen, Germany) coupled to an intermediate pressure MALDI/ESI interface (Spectroglyph LLC, Kennewick, WA, U.S.A.) was used for all experiments.36 Data were acquired in the positive-ion mode at a mass resolution setting of 120000 or 240000 when mentioned (fwhm @ m/z 400) and an ion injection time of 250 ms. Automatic gain control was disabled in all experiments. Laser postionization (MALDI-2) was performed as previously described.35 Unless reported otherwise, all experiments were performed using a repetition rate of 100 Hz, a MALDI-2 wavelength in the 260–280 nm range, a pulse energy of 500 μJ and a pulse delay time of 5 μs. Further details are provided in the Supporting Information.
Data Acquisition
Drug Profiling
Each drug standard and mixture was analyzed sequentially with MALDI-2 (100 Hz repetition rate) and conventional MALDI (100 and 1000 Hz repetition rate). Data were acquired by setting up a rectangular scan area (50 μm step size) within which MALDI-2 data were acquired for three rows after which the MALDI-2 laser was disabled and MALDI data acquired. For data analysis, 50 scans in each row were averaged to compare the signal intensity from each experiment, while error bars were determined from the standard deviation acquired from three consecutive rows. In the case that analyte signals were unresolved from isotopes of lower m/z fragments (e.g., [the M – H2 + H]+ ion of terfenadine) isotope correction of ion intensities was performed. The sensitivity evaluation only took in consideration the concentrations presenting a signal-to-noise (S/N) superior to 3 when averaging 50 scans. The S/N values were provided by Thermo Xcalibur 3.0.63 software. To calculate the concentration density per surface area, the values were extracted from the HTX imaging software and converted in ng/mm2.
Imaging Experiments
MSI data from human cartilage was acquired across half the tissue using MALDI-2, after which the MALDI-2 laser was disabled and MALDI-MSI data acquired. For the dog liver sample, first 1 cm2 of tissue was acquired with both MALDI and MALDI-2 to evaluate the postionization benefits. Then, a consecutive full section was acquired at a pixel size of 30 × 30 μm2. Data from cartilage was acquired at a pixel size of 50 × 50 μm2. Tandem mass spectrometry (MS/MS) was performed directly on tissue to identify triamcinolone acetonide using resonance collision-induced dissociation in the ion trap with a normalized collision energy of 30. An isolation window of 1 m/z unit was employed.
Data Analysis
Spectral analysis and visualization were performed using Thermo Xcalibur 3.0.63 and mMass 5.5.0.37 MSI data was reconstructed and visualized using in-house developed software written in MATLAB (Matlab; Mathworks, Natick, MA, U.S.A.; R2014a) as previously described.38 All images are generated following total-ion-count normalization.
Tissue Staining
The intestine sections were stained with hematoxylin and eosin (H&E). Cartilage tissue was stained using safranin-O for 2 min and Fast Green. For more details, please see Supporting Information.
Calculation of Gas-Phase Proton Affinities
Details on gas-phase proton affinity calculations are provided in the Supporting Information.
Results and Discussion
Proof-of-Concept: Triamcinolone Acetonide
Triamcinolone acetonide (TAA), a corticosteroid used to treat pain and inflammation, was chosen to evaluate the analytical merit of MALDI-2. Previous studies required TAA derivatization using Girard’s reagent T for detection of the drug from cartilage tissues using MALDI-MSI.27 For analysis of the TAA standard, the matrix-drug solution was sprayed onto an ITO-coated slide. Using this standard, the alignment and timing of the MALDI-2 laser were optimized to maximize the signal for the [TAA + H]+ ion at m/z 435.2184. Regarding alignment, practically, optimal MALDI-2 signal was obtained by bringing the MALDI-2 laser as close as possible to the surface without touching it (∼200–400 μm). Contact between the MALDI-2 laser and the sample surface can be observed by the presence of matrix and/or drug signal when the desorption (MALDI) laser is disabled. The highest TAA signal was achieved using a delay time (the time between the MALDI and MALDI-2 laser pulse) of 5–10 μs (Supporting Information, Figure 2A), consistent with previous observations for small molecules (Supporting Information, Figure 2B,C).34 The optimal delay time is governed by the velocity of the desorbed analyte ions and neutrals, which is largely determined by ion mobility-related effects in this pressure regime (10 mbar). Figure 1 shows representative MALDI (bottom, blue trace) and MALDI-2 spectra (top, red trace) acquired from the deposited TAA standard. Using conventional MALDI, the [M + H]+ ion of TAA observed at m/z 435.2184 was barely detectable while the corresponding [M + Na]+ ion at m/z 457.2198 was detected with a 42-fold higher intensity. Using MALDI-2, the [M + H]+ ion was preferentially formed and exhibited 460- and 11-fold higher signals than the corresponding protonated and sodiated molecules detected using conventional MALDI, respectively. The formation of predominantly protonated analyte (rather than alkali adducted species) using MALDI-2 is consistent with earlier reports on the use of MALDI-2 for lipid imaging.34,35
Figure 1.
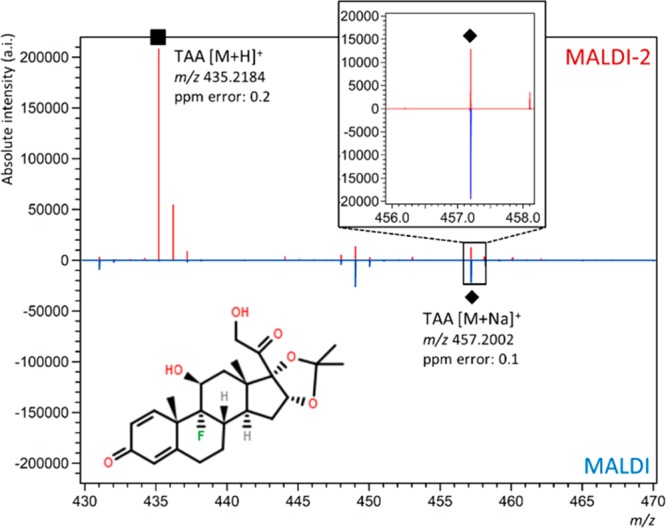
Postionization-MALDI for TAA. MALDI (bottom, blue trace) and MALDI-2 spectra (top, red trace) of triamcinolone acetonide (TAA) standard (0.5 mg/mL). The [M + H]+ ion is marked with a (■). Inset shows the m/z range where the [M + Na]+ ion of TAA is observed (indicated with a (◆)).
Enhanced Detection of Multiple Drug Standards Using MALDI-2
We next compared the signal intensities generated from 10 different pharmaceutical compounds (including TAA) analyzed using both MALDI and MALDI-2. The full list of compounds is provided in Supporting Information, Table 1. Prior to measurements, each drug was individually mixed with DHB matrix solution to give a final concentration of 0.5 mg/mL and sprayed onto separate slides. The results from these experiments are provided in Figure 2, while representative single-scan spectra and signal-to-noise (S/N) values are provided in Supporting Information, Figure 3. Figure 2A shows the comparative signal intensities generated from the corresponding protonated molecules (with the exception of ibuprofen, see below), produced using both MALDI and MALDI-2.
Figure 2.

Sensitivity of MALDI-2 over MALDI for a panel of ten different compounds. (A) Absolute intensities for the [M + H]+ ([M]•+ for ibuprofen) ions generated by MALDI (blue) and MALDI-2 (red) for 10 compounds at 0.5 mg/mL concentration. Error bars correspond to standard deviation. Please note the logarithmic scale. (B) Representative MALDI (bottom, blue trace) and MALDI-2 (top, red trace) single scan spectra for each compound shown in (A). Protonated species are marked with a (■) and radical cations indicated with a (●).
Three compounds, ketoconazole (m/z 531.1556, [M + H]+), terfenadine (m/z 472.3207, [M + H]+), and haloperidol (m/z 376.1469, [M + H]+) produced the highest signal intensities with conventional MALDI and the smallest fractional improvement with MALDI-2 improvements of ∼4-, 1.3-, and 2-fold, respectively. Terfenadine produced an abundant fragment ion at m/z 470.3065 assigned to a [M – H2 + H]+ fragment (2.2 ppm mass error). This fragment was only observed with MALDI-2 and was present at approximately twice the intensity of the [M + H]+ ion (Supporting Information, Figure 4). The observed MALDI-2-specific fragmentation alludes to differences in the ionization mechanisms of MALDI and MALDI-2.
A second regime of six compounds (doxorubicin, paclitaxel, kynurenine, TAA, caffeine, and fluoxetine) exhibited greater fractional enhancements using MALDI-2, with a signal improvement for the [M + H]+ ions of at least 1 order of magnitude observed for each compound. Kynurenine, TAA, and caffeine showed, respectively, a 140-, 130-, and 380-fold increase in signal for the [M + H]+ ion. As mentioned above, MALDI-2-induced fragmentation was also apparent for terfenadine. A fragment ion at m/z 286.1083 was observed for paclitaxel and detected with comparable signal intensity as the corresponding [M + H]+ ion generated using MALDI-2 (Supporting Information, Figure 5). This fragment is assigned to the loss of the pentadecene ring-functionality forming a [M + H – C31H37O10]+ ion. Analogous fragment ions generated from the deprotonated species have previously been reported using MALDI and MS/MS in negative-ion mode.39,40 A ∼15-fold gain was recorded for doxorubicin (m/z 544.1829; [M + H]+).
While the above comparisons were focused on the relative increase in protonated species, it is a common observation that many compounds ionize more efficiently as [M + Na]+ ions. Of these 10 compounds, four compounds produced more abundant [M + Na]+ ions than [M + H]+ ions using conventional MALDI (doxorubicin, paclitaxel, kynurenine, and TAA). Thus, we compared the [M + Na]+ intensity of MALDI with that of the [M + H]+ ion formed by MALDI-2. MALDI-2 still yielded overall higher intensities for these compounds, as demonstrated in Supporting Information, Figure 6A.
We acknowledge the high concentration of drug standards used to generate the data shown in Figure 2. For well-ionizable compounds, this high concentration could potentially result in signals that exceed the single-scan dynamic range of the Orbitrap analyzer.41 We therefore analyzed five of the same drug compounds following dilutions of between 10- and 500-fold to evaluate the gain in signal for lower concentrations. As shown in Figure 2, terfenadine, haloperidol, and ketoconazole produced the highest MALDI and MALDI-2 signal intensities and the lowest fractional improvement using MALDI-2. At a 500-fold dilution (0.001 mg/mL), the [M + H]+ signal acquired using MALDI was twice higher than for MALDI-2 in the case of terfenadine and 3× higher for haloperidol and near-identical for ketoconazole (Supporting Information, Figure 7). This shift in the preferred ionization mode can possibly be explained by the dramatically higher matrix:analyte ratio of these diluted solutions, which could alter the relative efficiencies of the MALDI and MALDI-2 processes. Nonetheless, and in line with Figure 2, these three compounds still gave the most similar ion intensities for MALDI and MALDI-2. Doxorubicin and paclitaxel were analyzed at a 10-fold dilution (0.05 mg/mL) and showed similar gains in signal intensity observed for MALDI-2 as those provided in Figure 2 (Supporting Information, Figure 7). For these diluted standards, we also compared the MALDI [M + Na]+ ion formation with the [M + H]+ intensity from MALDI-2 showing that the protonated molecules obtained with MALDI-2 presented higher signal than the MALDI-generated sodiated ions (Supporting Information, Figure 7).
One compound, ibuprofen, was not detectable at all using regular MALDI in the positive-ion mode. Interestingly MALDI-2 analysis yielded higher signal for the corresponding radical species (M+•) than for the closed-shell protonated species. The latter observation is unsurprising given the acidic nature of ibuprofen and the expectation that such species would form deprotonated, negatively charged species with a far greater efficiency. However, this observation also highlights a second advantage of MALDI-2 with the ability to access photoionization channels that are independent of typical cationization/deprotonation ionization processes for analytes that absorb the MALDI-2 laser light. It also highlights how molecules can be liberated into the gas-phase by the primary MALDI pulse but not ionized, such that they remain undetected. In this case the formation of the [M]+• ion of ibuprofen can be explained by a 2-photon resonance enhanced multiphoton photoionization (REMPI) process. Ibuprofen exhibits a peak UV-absorption at 263 nm, hence radical cation formation can be attributed to absorption of the MALDI-2 laser light (λ = 260 nm)42 by ibuprofen and subsequent absorption of a second photon ionizes the molecules. Radical cations were also detected in the MALDI-2 analysis of aromatic ketoconazole, doxorubicin, and caffeine (Figure 2B, circle labels).
The ion generation rate of MALDI-2 is currently limited by the relatively low repetition rate of the postionization laser (100 Hz in our experimental setup). For typical MSI applications the MALDI laser is operated at 1 kHz, which enables total depletion of a sampling spot within the 250 ms ion injection time. Therefore, we also compared the signal intensity of MALDI-2 with the protonated and sodiated molecules generated by conventional MALDI operating at 1 kHz. Overall, MALDI data generated with a laser repetition rate of 1 kHz resulted in <1 order of magnitude gain compared to 100 Hz (1.3-fold gain for ketoconazole to 8.1-fold gain for ibuprofen; Supporting Information, Figure 6B). In this analysis, MALDI-2 still provided higher signals for the protonated species than MALDI, but for several species that formed more abundant sodium adducts, MALDI generated slightly higher intensities (e.g., ibuprofen and doxorubicin; Supporting Information, Figure 6C).
MALDI-2 Sensitivity Evaluation
To test the sensitivity of both conventional MALDI and MALDI-2, a range of TAA concentrations were prepared and analyzed using both methods by mixing TAA with a DHB matrix solution to give final concentrations of 0.005–2.5 ng/μL sprayed on glass slides (corresponding to 2.29 × 10⁻³–1.15 ng/mm2). Overall, MALDI-2 produced higher signal for every concentration for the protonated form of TAA, with up to a 13-fold higher signal compared to the sodiated form. After averaging 50 consecutive scans we were able to detect the protonated TAA down to 4.58 × 10⁻¹ ng/mm2 with MALDI and 2.29 × 10⁻³ ng/mm2 with MALDI-2, a 200-fold difference (Figure 3). For sodiated TAA, MALDI-2 presented an overall higher signal. These results indicate that MALDI-2 provides a higher analytical sensitivity for TAA.
Figure 3.
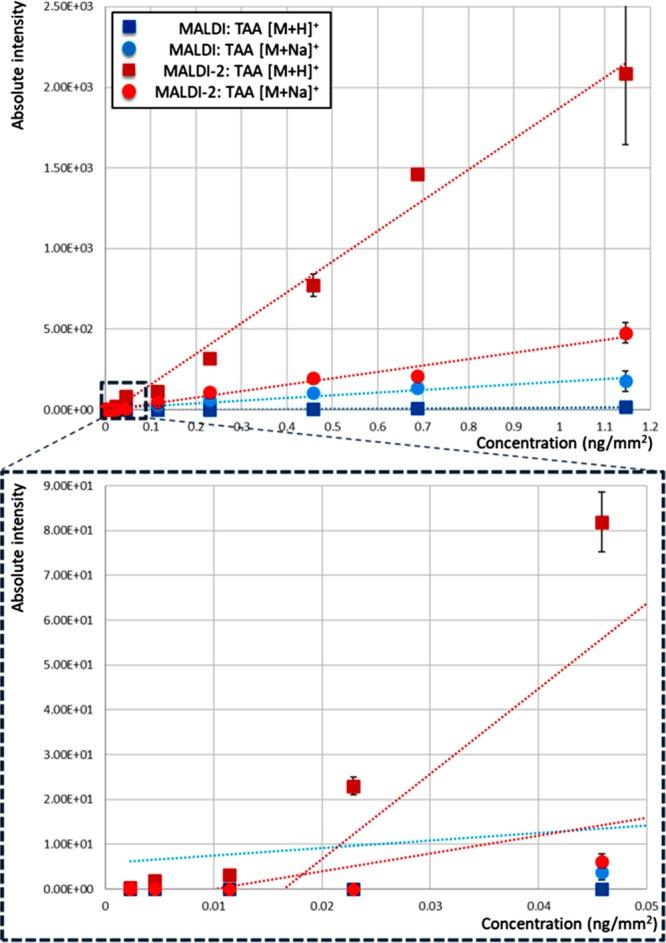
Sensitivity comparison for TAA using both MALDI (blue: squares, TAA [M + H]+; circles, TAA [M + Na]+) and MALDI-2 (red: squares, TAA [M + H]+; circles, TAA [M + Na]+).
MALDI-2 Imaging of Pharmaceutical Compounds in Tissue
Following the experiments on drug standards, we evaluated the use of MALDI-2 for MSI applications, specifically its ability to detect the distribution of two different pharmaceutical compounds in two different tissues. First, we investigated the ability to detect TAA in human cartilage tissues following their incubation for 48 h in a 24-well plate containing a TAA solution. Previous work demonstrated that MSI analysis of TAA in similar tissues was only possible after chemical derivatization.43Figure 4A shows that the [TAA + H]+ ion from tissue was readily detected by MALDI-2, whereas no [TAA + H]+ or [TAA + Na]+ signals were observed using MALDI. Importantly, the acquired MALDI-2 signal intensity was sufficient to study the distribution of TAA (Figure 4B,C) and confirmed its identity using tandem mass spectrometry (MS/MS; Supporting Information Figure 8).44 Consistent with earlier reports using MALDI coupled with derivatization, a relatively homogeneous distribution of the drug throughout the tissue was observed.43
Figure 4.

MALDI-2-MSI. (A) MALDI (left, bottom) and MALDI-2 (left, top) MSI image of TAA distribution in cartilage. (B) The Safranin-O and Fast green stained tissue section. (C) Average spectra obtained using MALDI-2 (top, red trace) and blue (bottom, blue trace) obtained from TAA-dosed cartilage tissue. (D) MALDI-2 (top, red trace) and MALDI (bottom, blue trace) spectra obtained for dosed dog liver tissue but not by MALDI (bottom). MALDI-2-MSI data for Compounds A, [M + H]+ (E), cholesterol, [M + H – H2O]+ (F), and vitamin E, [M]•+ (G). (H) H&E staining of dog liver tissue obtain following MSI data acquisition. All MSI data are generated following total ion current normalization.
In addition, MALDI-2 was used to evaluate the liver distribution of a drug under development, here referred to as compound A. As an important candidate pharmaceutical designed for the treatment of prostate cancer, it was canceled due to toxicity issues observed in the form of fibrotic lesions in the livers of treated dogs. Recently, compound A (the exact identity and mass cannot be provided due to confidentiality reasons) was visualized in canine liver tissue using desorption electrospray ionization (DESI) imaging and multiple reaction monitoring (MRM).45 Using both MALDI and MALDI-2, we first screened a ∼ 1 cm2 of tissue obtained from a treated dog which developed lesions. MALDI revealed a very low signal intensity for the drug compound (for the expected [M + H]+ ion at m/z 502 and was not detected at all for [M + Na]+ ion) after inspection of the averaged spectra across the analyzed tissue regions. By contrast, MALDI-2 resulted in a 270-fold improvement in signal of the [M + H]+ ion (Figure 4D). Following this preliminary test, a full consecutive tissue section was analyzed using MALDI-2, which enabled the ion distribution to be studied throughout the tissue (Figure 4E,H). The identity of the drug has been validated by MS/MS and high mass resolution experiments (data not shown). In addition to the drug distribution signal, numerous endogenous lipid compounds were also observed, including a variety of species not observed with MALDI (the full mass range spectrum is provided in Supporting Information, Figure 9). For example, the [M + H – H2O]+ ion of cholesterol observed at m/z 369.3521 (0.2 ppm mass error) was observed throughout the entire tissue, but with higher ion intensities in the lesions (Figure 4F). The ability of MALDI-2 to access direct photoionization channels was demonstrated as well as for the radical cation of vitamin E at m/z 430.3812 (Figure 4G). This ion signal was observed at far lower intensity in the lesions compared to the surrounding tissue when compared to stained tissue (Figure 4G,H).
Link between MALDI-2 Increased Signal and Proton Affinity?
The above results confirm previous reports that MALDI-2 favors the formation of [M + H]+ ions,34,35 presumably through a proton transfer process initiated by photoexcitation of matrix molecules. If it is assumed that the source of the protons in these aforementioned experiments is the same, then the gas-phase proton affinity of the analyte species might be a key factor in dictating the efficiency of the MALDI-2 process. To explore this, we calculated the gas-phase proton affinities of each of the nine compounds for which protonated signals were obtained and attempted to compare this with the acquired MALDI and MALDI-2 data. For each compound, multiple protonation sites are possible, and thus, we considered the site with the largest affinity. The full list of considered sites and calculated proton affinities is provided in the Supporting Information Figures 10 and 11, as well as the Supporting Information, Annex for more details.
No obvious correlation was apparent between the calculated analyte proton affinities and either MALDI-2 signal intensity or the fractional enhancement of MALDI-2 over MALDI, suggesting the mechanism of protonation in MALDI-2 cannot be explained by simple thermodynamically driven gas-phase proton transfer (Supporting Information, Figure 12). This is perhaps unsurprising, as the mechanisms of even conventional MALDI remain poorly understood and an area of active discussion in the literature.46−51 It is possible that MALDI-2 is capable of protonating different functional groups than conventional MALDI and that this contributes to the observed signal enhancements. The coupling of MALDI-2 with ion mobility to investigate the possible generation of different protomer populations with MALDI and MALDI-2 could provide an exciting avenue of future research to investigate such effects.
There are several key differences between MALDI and MALDI-2 that could potentially explain their ability to better ionize different compounds. The higher energy photons used for MALDI-2 are sufficient for direct two-photon ionization of matrix molecules, which is believed to initiate the MALDI-2 ionization process. This is evidenced by the ≥2 order of magnitude increase in signal intensity for the radical cation of the matrix monomer observed with MALDI-2 (data not shown). By contrast, MALDI typically uses photons in the 337–355 nm range, insufficient for direct two-photon ionization of DHB52 and other common MALDI matrices. In this case, photoionization of the matrix is thought to occur either by energy-pooling processes or other complex mechanisms involving close interactions between multiple matrix and/or analyte molecules.46 Second, MALDI is performed on a solid, crystalline sample whereas MALDI-2 is performed on a desorbed, dense gas-phase matrix/analyte containing plume. This likely presents a lower density reaction plume than expected for MALDI. Moreover, in light of the above results it is possible that proton transfer rates in the still relatively dense MALDI plume ionized by MALDI-2 are not dictated by gas-phase PA values. Moreover, there is no obvious correlation between the presence of certain functional groups and the signal enhancements observed using MALDI-2. Combined with the likelihood of complex cluster chemistry, it is clear there is much to unravel regarding the similarities and differences in MALDI and MALDI-2 ionization mechanisms and analyte-dependent ionization efficiencies. Thorough evaluation of these parameters fall outside the scope of this study.
Conclusions
The present study reports for the first time that the detection and imaging of many pharmaceutically relevant compounds can be significantly improved using MALDI-2. We demonstrated that MALDI-2 can provide 1–2 orders of magnitude improvement in sensitivity and signal intensity for a variety of model compounds. Importantly, this sensitivity increase can negate the need for time-consuming derivatization protocols needed for certain compounds. As such MALDI-2 provides a powerful a new tool enabling the MSI analysis of a variety of compounds that are difficult to observe with MALDI. It can offer benefits not only in the study of drug metabolism and drug development, but also in studying the effects of pharmaceuticals on endogenous metabolism by exploiting the parallel increase in sensitivity provided by MALDI-2 for many endogenous metabolites.34,35
As a first step toward rationalizing the observed differences between MALDI and MALDI-2 we investigated the correlation between analyte proton affinities and the signal gain realized by MALDI-2 but no obvious correlation was found. A solid understanding of the involved processes in MALDI-2 ionization, allowing prediction of optimal use of MALDI or MALDI-2, remains so-far elusive. Nevertheless, the examples clearly show the huge potential of using MALDI-2 for improved sensitivity and further research will focus on better understanding of underlying processes to better exploit its abilities. Finally this work, in combination with other recent studies31 highlights the vast potential of postionization methods when coupled with modern MSI technologies in overcoming the still low ionization efficiencies of most compounds. Continued development and mechanistic understanding of such approaches has the potential of further increasing efficiencies by several orders of magnitude.
Acknowledgments
This work was performed in the M4I research program that was financially supported by the Dutch Province of Limburg as part of the “LINK” program. F.P.Y.B. received funding from the European Union’s Horizon 2020 research and innovation program under the Marie Sklodowska-Curie Program, TargetCare (ITN-2014-ETN 642414). B. McKinnon and S. Marlton (UOW) assisted with some of the calculations and, along with P.D.K., are supported by Australian Government Research Training Program Scholarships. Calculations were performed using the NCI National Facility (Canberra, Australia) supported by the Australian Government. We gratefully acknowledge the support of Dr. Bhanu Singh and Dr. Heng Keang Lim (Janssen R&D, Springhouse, PA, U.S.A.) and Dr. Marjolein van Heerden (Janssen R&D, Beerse, Belgium) for supplying dog specimens (dosed with Compound A). Doxorubicin standards were kindly provided by Dr Roel Deckers (University Medical Center Utrecht, The Netherlands).
Supporting Information Available
The Supporting Information is available free of charge on the ACS Publications website at DOI: 10.1021/acs.analchem.9b02495.
The authors declare no competing financial interest.
Supplementary Material
References
- Chughtai K.; Heeren R. M. A. Chem. Rev. 2010, 110, 3237–3277. 10.1021/cr100012c. [DOI] [PMC free article] [PubMed] [Google Scholar]
- Bruinen A. L.; van Oevelen C.; Eijkel G. B.; Van Heerden M.; Cuyckens F.; Heeren R. M. A. J. Am. Soc. Mass Spectrom. 2016, 27, 117–123. 10.1007/s13361-015-1254-3. [DOI] [PMC free article] [PubMed] [Google Scholar]
- Wiseman J. M.; Ifa D. R.; Zhu Y. X.; Kissinger C. B.; Manicke N. E.; Kissinger P. T.; Cooks R. G. Proc. Natl. Acad. Sci. U. S. A. 2008, 105, 18120–18125. 10.1073/pnas.0801066105. [DOI] [PMC free article] [PubMed] [Google Scholar]
- Smith D. R.; Chandra S.; Barth R. F.; Yang W. L.; Joel D. D.; Coderre J. A. Cancer Res. 2001, 61, 8179–8187. [PubMed] [Google Scholar]
- Newman C. F.; Havelund R.; Passarelli M. K.; Marshall P. S.; Francis I.; West A.; Alexander M. R.; Gilmore I. S.; Dollery C. T. Anal. Chem. 2017, 89, 11944–11953. 10.1021/acs.analchem.7b01436. [DOI] [PubMed] [Google Scholar]
- Vanbellingen Q. P.; Castellanos A.; Rodriguez-Silva M.; Paudel I.; Chambers J. W.; Fernandez-Lima F. A. J. Am. Soc. Mass Spectrom. 2016, 27, 2033–2040. 10.1007/s13361-016-1485-y. [DOI] [PMC free article] [PubMed] [Google Scholar]
- Bruinen A. L.; Fisher G. L.; Balez R.; van der Sar A. M.; Ooi L.; Heeren R. M. A. J. Am. Soc. Mass Spectrom. 2018, 29, 1571–1581. 10.1007/s13361-018-1979-x. [DOI] [PMC free article] [PubMed] [Google Scholar]
- Chandra S.; Ahmad T.; Barth R. F.; Kabalka G. W. J. Microsc. 2014, 254, 146–156. 10.1111/jmi.12126. [DOI] [PMC free article] [PubMed] [Google Scholar]
- Passarelli M. K.; Newman C. F.; Marshall P. S.; West A.; Gilmore I. S.; Bunch J.; Alexander M. R.; Dollery C. T. Anal. Chem. 2015, 87, 6696–6702. 10.1021/acs.analchem.5b00842. [DOI] [PubMed] [Google Scholar]
- Nilsson A.; Goodwin R. J. A.; Shariatgorji M.; Vallianatou T.; Webborn P. J. H.; Andren P. E. Anal. Chem. 2015, 87, 1437–1455. 10.1021/ac504734s. [DOI] [PubMed] [Google Scholar]
- Swales J. G.; Hamm G.; Clench M. R.; Goodwin R. J. A. Int. J. Mass Spectrom. 2019, 437, 99–112. 10.1016/j.ijms.2018.02.007. [DOI] [Google Scholar]
- Pirman D. A.; Reich R. F.; Kiss A.; Heeren R. M. A.; Yost R. A. Anal. Chem. 2013, 85, 1081–1089. 10.1021/ac302960j. [DOI] [PubMed] [Google Scholar]
- Prentice B. M.; Chumbley C. W.; Caprioli R. M. J. Am. Soc. Mass Spectrom. 2017, 28, 136–144. 10.1007/s13361-016-1501-2. [DOI] [PMC free article] [PubMed] [Google Scholar]
- Ellis S. R.; Bruinen A. L.; Heeren R. M. A. Anal. Bioanal. Chem. 2014, 406, 1275–1289. 10.1007/s00216-013-7478-9. [DOI] [PubMed] [Google Scholar]
- Potocnik N. O.; Porta T.; Becker M.; Heeren R. M. A.; Ellis S. R. Rapid Commun. Mass Spectrom. 2015, 29, 2195–2203. 10.1002/rcm.7379. [DOI] [PubMed] [Google Scholar]
- Kompauer M.; Heiles S.; Spengler B. Nat. Methods 2017, 14, 90–96. 10.1038/nmeth.4071. [DOI] [PubMed] [Google Scholar]
- Zavalin A.; Yang J.; Hayden K.; Vestal M.; Caprioli R. M. Anal. Bioanal. Chem. 2015, 407, 2337–2342. 10.1007/s00216-015-8532-6. [DOI] [PMC free article] [PubMed] [Google Scholar]
- Kriegsmann J.; Casadonte R.; Kriegsmann K.; Longuespee R.; Kriegsmann M. Pathol., Res. Pract. 2018, 214, 1057–1063. 10.1016/j.prp.2018.05.009. [DOI] [PubMed] [Google Scholar]
- Vaysse P. M.; Heeren R. M. A.; Porta T.; Balluff B. Analyst 2017, 142, 2690–2712. 10.1039/C7AN00565B. [DOI] [PubMed] [Google Scholar]
- Quanico J.; Franck J.; Wisztorski M.; Salzet M.; Fournier I. Methods Mol. Biol. 2017, 1598, 21–43. 10.1007/978-1-4939-6952-4_2. [DOI] [PubMed] [Google Scholar]
- Francese S.; Bradshaw R.; Denison N. Analyst 2017, 142, 2518–2546. 10.1039/C7AN00569E. [DOI] [PubMed] [Google Scholar]
- Puretzky A. A.; Geohegan D. B. Chem. Phys. Lett. 1998, 286, 425–432. 10.1016/S0009-2614(98)00013-X. [DOI] [Google Scholar]
- Shirota T.; Tsuge M.; Hikosaka Y.; Soejima K.; Hoshina K. J. Phys. Chem. A 2017, 121, 31–39. 10.1021/acs.jpca.6b09591. [DOI] [PubMed] [Google Scholar]
- Mowry C. D.; Johnston M. V. Rapid Commun. Mass Spectrom. 1993, 7, 569–575. 10.1002/rcm.1290070702. [DOI] [Google Scholar]
- Hamm G.; Bonnel D.; Legouffe R.; Pamelard F.; Delbos J. M.; Bouzom F.; Stauber J. J. Proteomics 2012, 75, 4952–4961. 10.1016/j.jprot.2012.07.035. [DOI] [PubMed] [Google Scholar]
- Stoeckli M.; Staab D.; Schweitzer A. Int. J. Mass Spectrom. 2007, 260, 195–202. 10.1016/j.ijms.2006.10.007. [DOI] [Google Scholar]
- Barre F. P.; Flinders B.; Garcia J. P.; Jansen I.; Huizing L. R.; Porta T.; Creemers L. B.; Heeren R. M.; Cillero-Pastor B. Anal. Chem. 2016, 88, 12051–12059. 10.1021/acs.analchem.6b02491. [DOI] [PubMed] [Google Scholar]
- Beasley E.; Francese S.; Bassindale T. Anal. Chem. 2016, 88, 10328–10334. 10.1021/acs.analchem.6b03551. [DOI] [PubMed] [Google Scholar]
- Manier M. L.; Reyzer M. L.; Goh A.; Dartois V.; Via L. E.; Barry C. E.; Caprioli R. M. J. Am. Soc. Mass Spectrom. 2011, 22, 1409–1419. 10.1007/s13361-011-0150-8. [DOI] [PMC free article] [PubMed] [Google Scholar]
- Wu C. P.; Ifa D. R.; Manicke N. E.; Cooks R. G. Anal. Chem. 2009, 81, 7618–7624. 10.1021/ac901003u. [DOI] [PMC free article] [PubMed] [Google Scholar]
- Hanley L.; Wickramasinghe R.; Yung Y. P. Annu. Rev. Anal. Chem. 2019, 12, 225. 10.1146/annurev-anchem-061318-115447. [DOI] [PubMed] [Google Scholar]
- Lu Q.; Hu Y. J.; Chen J. X.; Jin S. Anal. Chem. 2017, 89, 8238–8243. 10.1021/acs.analchem.7b00140. [DOI] [PubMed] [Google Scholar]
- Steven R. T.; Shaw M.; Dexter A.; Murta T.; Green F. M.; Robinson K. N.; Gilmore I. S.; Takats Z.; Bunch J. Anal. Chim. Acta 2019, 1051, 110–119. 10.1016/j.aca.2018.11.003. [DOI] [PubMed] [Google Scholar]
- Soltwisch J.; Kettling H.; Vens-Cappell S.; Wiegelmann M.; Muthing J.; Dreisewerd K. Science 2015, 348, 211–215. 10.1126/science.aaa1051. [DOI] [PubMed] [Google Scholar]
- Ellis S. R.; Soltwisch J.; Paine M. R. L.; Dreisewerd K.; Heeren R. M. A. Chem. Commun. 2017, 53, 7246–7249. 10.1039/C7CC02325A. [DOI] [PubMed] [Google Scholar]
- Belov M. E.; Ellis S. R.; Dilillo M.; Paine M. R. L.; Danielson W. F.; Anderson G. A.; de Graaf E. L.; Eijkel G. B.; Heeren R. M. A.; McDonnell L. A. Anal. Chem. 2017, 89, 7493–7501. 10.1021/acs.analchem.7b01168. [DOI] [PubMed] [Google Scholar]
- Strohalm M.; Hassman M.; Kosata B.; Kodicek M. Rapid Commun. Mass Spectrom. 2008, 22, 905–908. 10.1002/rcm.3444. [DOI] [PubMed] [Google Scholar]
- Eijkel G. B.; Kaletas B. K.; van der Wiel I. M.; Kros J. M.; Luider T. M.; Heeren R. M. A. Surf. Interface Anal. 2009, 41, 675–685. 10.1002/sia.3088. [DOI] [Google Scholar]
- Giordano S.; Zucchetti M.; Decio A.; Cesca M.; Fuso Nerini I.; Maiezza M.; Ferrari M.; Licandro S. A.; Frapolli R.; Giavazzi R.; Maurizio D.; Davoli E.; Morosi L. Sci. Rep. 2016, 6, 39284. 10.1038/srep39284. [DOI] [PMC free article] [PubMed] [Google Scholar]
- Morosi L.; Spinelli P.; Zucchetti M.; Pretto F.; Carra A.; D’Incalci M.; Giavazzi R.; Davoli E. PLoS One 2013, 8, e72532. 10.1371/journal.pone.0072532. [DOI] [PMC free article] [PubMed] [Google Scholar]
- Makarov A.; Denisov E.; Lange O.; Horning S. J. Am. Soc. Mass Spectrom. 2006, 17, 1758–1758. 10.1016/j.jasms.2006.09.022. [DOI] [PubMed] [Google Scholar]
- Wheate N. J.; Apps M. G.; Khalifa H.; Doughty A.; Patel A. R. J. Chem. Educ. 2017, 94, 1107–1110. 10.1021/acs.jchemed.6b00955. [DOI] [Google Scholar]
- Barre F. P. Y.; Flinders B.; Garcia J. P.; Jansen I.; Huizing L. R. S.; Porta T.; Creemers L. B.; Heeren R. M. A.; Cillero-Pastor B. Anal. Chem. 2016, 88, 12051–12059. 10.1021/acs.analchem.6b02491. [DOI] [PubMed] [Google Scholar]
- Moore C. D.; Roberts J. K.; Orton C. R.; Murai T.; Fidler T. P.; Reilly C. A.; Ward R. M.; Yost G. S. Drug Metab. Dispos. 2013, 41, 379–389. 10.1124/dmd.112.046318. [DOI] [PMC free article] [PubMed] [Google Scholar]
- Lamont L.; Eijkel G. B.; Jones E. A.; Flinders B.; Ellis S. R.; Siegel T. P.; Heeren R. M. A.; Vreeken R. J. Anal. Chem. 2018, 90, 13229–13235. 10.1021/acs.analchem.8b03857. [DOI] [PMC free article] [PubMed] [Google Scholar]
- Knochenmuss R. Analyst 2006, 131, 966–986. 10.1039/b605646f. [DOI] [PubMed] [Google Scholar]
- Knochenmuss R. J. Am. Soc. Mass Spectrom. 2014, 25, 1521–1527. 10.1007/s13361-014-0931-y. [DOI] [PubMed] [Google Scholar]
- Knochenmuss R. Annu. Rev. Anal. Chem. 2016, 9, 365–385. 10.1146/annurev-anchem-071015-041750. [DOI] [PubMed] [Google Scholar]
- Bae Y. J.; Kim M. S. Annu. Rev. Anal. Chem. 2015, 8, 41–60. 10.1146/annurev-anchem-081413-024102. [DOI] [PubMed] [Google Scholar]
- Lu I.-C.; Lee C.; Lee Y.-T.; Ni C.-K. Annu. Rev. Anal. Chem. 2015, 8, 21–39. 10.1146/annurev-anchem-071114-040315. [DOI] [PubMed] [Google Scholar]
- Jaskolla T. W.; Karas M. J. Am. Soc. Mass Spectrom. 2011, 22, 976–988. 10.1007/s13361-011-0093-0. [DOI] [PubMed] [Google Scholar]
- Karbach V.; Knochenmuss R. Rapid Commun. Mass Spectrom. 1998, 12, 968–974. 10.1002/(SICI)1097-0231(19980731)12:14<968::AID-RCM255>3.0.CO;2-4. [DOI] [Google Scholar]
Associated Data
This section collects any data citations, data availability statements, or supplementary materials included in this article.