

Abstract
Determining whether magma fragments during eruption remains a seminal challenge in volcanology. There is a robust paradigm for fragmentation of high viscosity, silicic magmas, however little is known about the fragmentation behaviour of lower viscosity systems—the most abundant form of volcanism on Earth and on other planetary bodies and satellites. Here we provide a quantitative model, based on experiments, for the non-brittle, fluid dynamic induced fragmentation of low viscosity melts. We define the conditions under which extensional thinning or liquid break-up can be expected. We show that break-up, both in our experiments and natural eruptions, occurs by both viscous and capillary instabilities operating on contrasting timescales. These timescales are used to produce a universal break-up criterion valid for low viscosity melts such as basalt, kimberlite and carbonatite. Lastly, we relate these break-up instabilities to changes in eruptive behaviour, the associated natural hazard and ultimately the deposits formed.
Subject terms: Natural hazards, Volcanology
Determining if a volcanic eruption will behave effusively or explosively is crucial for predicting the potential hazard type and for planning effective mitigation. Here, the authors present a universal, fluid dynamic induced, break-up criterion for low viscosity melts.
Introduction
Establishing when a volcanic eruption will behave effusively, explosively or a combination thereof is of utmost importance to civil protection and hazard mitigation1–3. Explosive behaviour produces pyroclastic material building up spatter ramparts, scoria cones and/or tephra blankets, which can potentially lead to air-space closure4, whereas effusive behaviour occurs in the form of lava flows and toxic gas emissions5,6. Thus, the eruption style directly controls the hazard type, spatial footprint and magnitude. A robust understanding exists for the fragmentation of high viscosity, silicic systems1,2,7–11; however, the same theories cannot be applied to the fragmentation of lower viscosity liquids. This knowledge gap is further compounded by the fact that most of the volcanism on Earth12 and on other planetary bodies and satellites13,14 features low-viscosity liquids. The liquids in question could be of wide-ranging chemical composition from silicate and carbonate melts on Earth to water and aqueous solutions on other planetary bodies.
For evolved silicic systems, where viscosities are high, fragmentation occurs by crossing the rheological glass transition1. For a melt in the relaxed state, at any given viscosity high strain rates favour brittle behaviour, whereas lower strain rates favour liquid-like behaviour. For less silicic melts such as basalt, kimberlite and carbonatite (with viscosities of ⪅103 Pa ·s), fragmentation via crossing the glass transition requires very high strain rates >104 s−1. Such strain rates are not observed during terrestrial eruption of low-viscosity melts and therefore theories developed for the fragmentation of silicic systems remain unrealistic15,16. Fragmentation of low-viscosity melts must occur by a fundamentally different process—fluid dynamic induced break-up—where magma is stretched and pulled apart to form pyroclasts2,16–19. Fragmentation by fluid dynamic-induced break-up therefore has the potential to govern eruptive behaviour.
During eruption there are many processes where liquid extension plays a central role. Some of these are depicted in Fig. 1. During magma ascent within the conduit, decompression and subsequent bubble growth subject the interstitial melt to extension. If the inertia effect overwhelms the viscous effects, the extending bubble walls continually thin and potentially become subject to break-up16,20. Upon exit from the vent, extensional break-up can be caused by fluid dynamic instabilities at the edge of the magma jet17,19,21–23. In less energetic cases, the bursting of large gas bubbles or slugs at the free surface leads to magma break-up. This is commonly observed at lava lakes and during Strombolian-style eruptions24–28. Lastly, after hot fluidal pyroclasts have been formed they can further fragment during continued extension within the fountain2,29–33. We note, however, that this list is not exhaustive; for example, extensional break-up has been observed during the landing of spatter clasts34,35 and melt stripping from crystal surfaces36. In this study, we focus on the fragmentation behaviour of low-viscosity liquids/melts devoid of bubbles and crystals. The addition of these extra components, through volatile exsolution and/or crystallization, will form a multiphase magma and introduce non-Newtonian effects (as discussed later).
Fig. 1.

A schematic showing the potential locations where the fluid dynamic break-up of a low-viscosity melt is important. These illustrations are not exhaustive but include a filament formation and extension by bubble growth and expansion, b instabilities on the edge of a jet, c the bursting of bubbles and d the continued stretching of pyroclasts in a fountain
Here, we perform a series of analogue experiments to investigate the extension conditions under which these low-viscosity liquids break-up and propose a universal fragmentation criterion that can be applied to eruptions of low-viscosity liquids worldwide. Under typical eruptive conditions, melts such as basalt, kimberlite and carbonatite break-up via fluid dynamic processes in the form of viscous and capillary instabilities. The timescale that drives break-up is shorter for liquids with a higher surface tension and lower viscosity, making these most prone to break-up. We conclude by defining the conditions under which extensional flow or liquid break-up can be expected and relate this to changes in eruptive behaviour, the associated natural hazard and ultimately the type of deposits generated.
Results
Experimental observations
Our experiments subject a liquid held between two parallel plates to vertical extension. Fluid properties including viscosity (92–0.03 Pa·s), surface tension (0.08–0.07 N m−1), density (1439–1254 kg m−3) and relaxation time were varied using different dilutions of sugar syrup (see Methods). Other experimental variables include the initial liquid dimensions, the extension rate and the total strain. All these variables were chosen such that our experiments cover the same range of dimensionless space and dynamical regimes as expected for natural volcanic eruptions. Every experiment was recorded by high-resolution videography (26 pixels/mm) to document whether the liquid stayed connected as a flowing thinning filament (Fig. 2a) or broke (Fig. 2b, c) during extensional deformation. These two modes of behaviour are referred to as “break-up” and “thinning” hereafter. Furthermore, break-up is observed to occur by two contrasting modes. First, capillary break-up, which is characterized by necking at two points, leaving a central section of the filament, which retracts into a droplet (Fig. 2b). Second, viscous break-up, where the filament thins and necks at a single point between the plates (Fig. 2c). Videos of these experiments can be found in the online supporting information (Supplementary Movies 1, 2 and 3). These modes of break-up were identified using the accompanying videography where possible and later confirmed by the calculation of the dominant timescale (see discussion later; Eq. 3). We found that low fluid viscosities, fast extension rates and thin filament diameters promoted break-up; however, these factors are all interrelated. A full list of experimental conditions and fluid properties can be found in the Supplementary Data 1.
Fig. 2.

Representative images showing the three styles of behaviour observed. Specifically, these image stills are from experiments that used a a 5 wt.% dilution of golden syrup, b a 30 wt.% dilution of golden syrup and c a 20 wt.% dilution of golden syrup. Images taken at 0, 0.02, 0.04, 0.06 and 0.08 s into the deformation. In experiments a and c the initial droplet had a 4 mm diameter and 2 mm thickness and the sample was extended 14.65 mm over 0.1 s. For experiment b the initial droplet had a 5 mm diameter and 2.5 mm thickness and was extended 6.48 mm over 0.1 s. The white arrows point to the loci of necking
Characteristic timescales
Following the work of Villermaux32, we now introduce the timescales appropriate to the continued elongation of a filament. During the extension of a low-viscosity fluid, the initial volume is stretched into a filament of some thickness, d, which reduces with increased extension. After Mckinley and Sridhar37, the extension rate, , can be calculated as: where d is the filament diameter and Δd is the change in filament diameter over the short time interval, Δt (see Methods for details). The thread or filament is subject to two instability timescales, both acting to break the thread32,38. When liquid surface tension and inertia are dominant, break-up is completed within a characteristic capillary instability timescale given by:
| 1 |
where ρ is the fluid density, σ is the surface tension and d is the filament diameter. However, when viscous forces dominate over inertia, they slow down the break-up process (without suppressing it) such that break-up now occurs on the viscous instability timescale:
| 2 |
where η is the fluid shear viscosity. To determine which of these timescales controls break-up, it is useful to introduce the Ohnesorge number (Oh)—a dimensionless number that has been shown to govern the style of fluid dynamic break-up22,32,38–40:
| 3 |
Hence, where Oh is >1, the viscous instability timescale dominates, and where Oh is <1, the capillary instability timescale dominates.
Discussion
Given that a wide variety of interrelated variables control break-up (e.g. low fluid viscosities, fast extension rates and small thread diameters), we introduce a modified dimensionless Deborah number in order to provide a universal break-up criterion valid for the extension of a thinning filament. The modified Deborah number is a ratio of the dominant fluid’s instability timescale, λinst to the imposed deformation timescale and λd expressed as:
| 4 |
where λinst = λvis for Oh >1 and λinst = λcap for Oh <1, and is the reciprocal of the extension rate, .
Our experimental data show both viscous and capillary break-up occurs over a large range of deformation timescales (~2 orders of magnitude; Fig. 3). However, independent of the mechanism, liquids are observed to break-up when De* <1, as the instability timescale is shorter than the deformation timescale. This sets the failure criterion for magma fluid dynamic break-up as:
| 5 |
At 1>De*>0.3, there is a transitional zone where both thinning and break-up can occur; however, in our experiments at De* <0.3, only break-up is observed. At De >1 the instability timescales are slower than the deformation timescale, so the extending liquid only thins (Fig. 3). Lastly, it is important to note that previous experimental studies of silicate melt elongation41–43, which analysed the viscoelastic behaviour, used a fragmentation criterion form of the Deborah number, which relates to the viscous and elastic response of the material. We do not investigate viscoelastic effects here as these are most relevant to higher viscosity melts deformed at higher strain rates16. For example, one fragmentation criterion that applies to higher viscosity (viscoelastic) melts is met when the strain rate exceeds 10−2G/ηs, where G is the shear modulus at infinite frequency [Pa] and ηs is the shear viscosity [Pa·s] of the melt at zero frequency7,8,41.
Fig. 3.
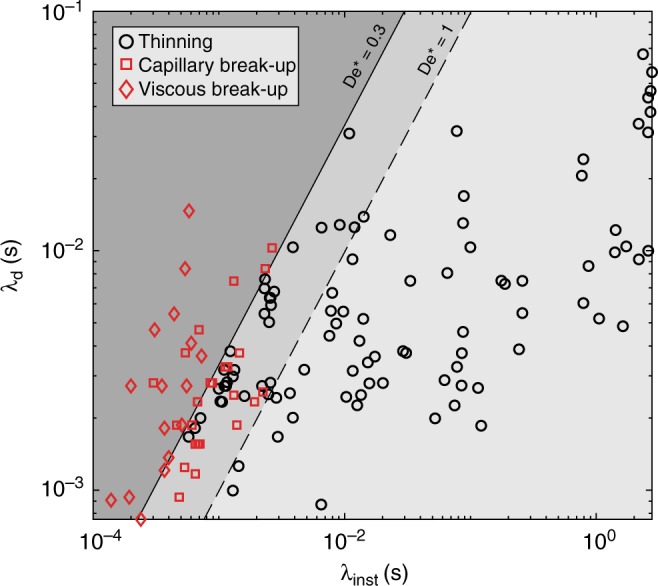
A behaviour map for the fluid dynamic break-up of low-viscosity liquids under extension. All experiments are plotted and colour coded for thinning (black) and break-up (red). The style of break-up is denoted by the symbol type, where the squares and diamonds correspond to capillary and viscous break-up, respectively. For modified Deborah numbers (De*) >1, only thinning is observed, at De* <1 break-up is possible and at De* <0.3, only break-up is observed
Now let us consider the break-up of volcanic low-viscosity liquids. Here we focus on basalts, kimberlites and carbonatites; however, our analysis is equally applicable to other high temperature melts (e.g. komatiites) or alkalic melts (e.g. nephelinites), for example. For reasonable estimates of physical melt properties (Table 1), these low-viscosity liquids can be subject to both viscous and capillary instabilities (Fig. 4a). The shorter the instability timescale, the more likely break-up will occur—enough time must be available during deformation and before clast cooling. Therefore, kimberlites and carbonatites are more prone to undergo fluid dynamic-induced break-up relative to a higher viscosity basalt. Furthermore, we predict that basaltic melts break up solely in the viscous regime, while kimberlitic and carbonatitic melts straddle the divide and can break-up by both capillary and viscous instabilities (Fig. 4a).
Table 1.
Physical property data for the melts of basaltic, kimberlitic and carbonatitic composition used in this study
| Parameter: | Basalt54–56 | Kimberlite36,57 | Carbonatite58–60 | ||||||
|---|---|---|---|---|---|---|---|---|---|
| Min. | Max. | Best estimate | Min. | Max. | Best estimate | Min. | Max. | Best estimate | |
| d [m] | 10−4 | 10−1 | – | 10−4 | 10−1 | – | 10−4 | 10−1 | – |
| σ [N m−1] | 0.07 | 0.25 | 0.16 | 0.07 | 0.25 | 0.16 | 0.07 | 0.25 | 0.16 |
| ρ [kg m−3] | 2400 | 2800 | 2600 | 2500 | 2800 | 2650 | 2000 | 2300 | 2150 |
| η [Pa·s] | 101 | 103 | 102 | 10−1 | 101 | 100 | 10−2 | 101 | 10−0.5 |
Fig. 4.

The break-up characteristics of natural volcanic melts under extension. a Predicted viscous and capillary timescales for volcanic pyroclasts. The shaded fields denote the range of Ohnesorge number expected for the eruption of basalt (blue), kimberlite (green) and carbonatite (orange). Note that the carbonatite field extends underneath the kimberlite field. A line of Oh = λvis / λcap = 1 separates where capillary (Oh <1) or viscous (Oh >1) instabilities dominate. b Break-up vs. flow behaviour map that relates the intrinsic properties of the melt (Ohnesorge number; Oh) to the eruption conditions (modified Deborah number; De*). Shading from light, intermediate to dark grey indicates zones of solely thinning, both thinning and break-up and solely break-up, respectively. Lines show example calculation results for basalt (blue), kimberlite (green) and carbonatite (orange)
To demonstrate how our break-up criterion can be applied to volcanic systems, we relate the intrinsic properties of the system (defined by Oh; Eq. 3) to the extrinsic eruption variables (De*), where break-up can occur at De* <1 (Fig. 4b). This criterion can be applied to any low-viscosity liquid that forms a thinning filament by elongation. Hence, it is applicable to many processes (Fig. 1) that occur during Hawaiian- and Strombolian-type eruptions. Additionally, we emphasise that break-up can occur at De* <1, irrespective of the melt properties (Oh group; Fig. 4b). Now as an example of how our analysis can be used, let us consider a pyroclastic jet or fountaining episode containing spherical clasts 5 cm in diameter, d0. The typical velocity difference44 (Δv) between the pyroclast and gas is ~100 m s−1, which acts to stretch clasts at a rate, , calculated as32,45,46:
| 6 |
where is the density of the ambient gas within the fountain. As an example, we take the tread thickness at potential break-up d to be 200 μm47. Performing this analysis on pyroclasts of basaltic, kimberlite and carbonatitic composition proves highly instructive (Fig. 4b; best estimate values, Table 1). Under these conditions, we find that basaltic pyroclasts do not break but would extend to form thin (~200 μm) melt strands such as Pele’s hair—a common product of basaltic hawaiian lava fountaining episodes31,47. Kimberlitic and carbonatitic pyroclasts would undergo further break-up under the same eruption conditions creating smaller pyroclasts and potentially producing a melt spray (e.g. atomisation), which would coat crystals and lithic fragments during eruption33,36.
In volcanic systems pure melts (the focus of this study) are not always present. Rather, magma exists—a multiphase suspension composed of a melt (the liquid phase with Newtonian viscosity) that suspends bubbles (gas) and/or crystals (solid). The addition of both of these phases can introduce a non-Newtonian rheology48. Crystals increase the magma viscosity and can introduce a yield stress once the particle concentration is sufficient for particle–particle interactions to occur48. The onset of a yield stress has been reported to occur from particle concentrations of ~0.25–0.55 vol.%; however, this value depends on the particle size and aspect ratio49. A recent experimental study15 has shown that the presence of crystals promotes brittle fracture during filament extension. This was due to non-Newtonian effects at high deformation rates.
The presence of bubbles within the extending liquid is likely to introduce many complicated effects. For example, when bubbles do not deform during flow, they act to increase the viscosity of the suspension50. Hence, they could suppress viscous break-up by extending the viscous instability timescale (Eq. 2). Alternatively, the diameter controlling break-up might be reduced to the film thickness between bubbles, rather than the filament diameter. This would act to reduce both the viscous and capillary instability timescales, and introduce nucleation points for crack development51. In the presence of several bubbles the liquid is likely to experience enhanced necking and sudden rupture above a critical flow rate52. Foams have been shown to rupture in three ways under extension51. Viscous break-up to a central pinch point was observed at the lowest critical velocities, while brittle fracture occurs at larger velocities, where foams break apart from fracture points within the filament. A transition zone at intermediate rates is observed where both break-up mechanisms are apparent. This transition zone reduces in size with increasing width of the initial filament. It is therefore clear that when bubbles and/or crystals are suspended in the melt, non-Newtonian effects are likely to change the characteristics of extensional break-up. This should be the focus of future research.
Our experiments and scaling analysis have shown that low-viscosity volcanic melts are susceptible to fluid dynamic break-up—a fundamentally different phenomenon to classical brittle fragmentation1. Fluid dynamic-induced break-up is supported by melts with high surface tension and low shear viscosities that are stretched into thin filaments. These insights enable a volcanologist to interpret deposits (e.g. Pele’s hair vs. melt-coated crystals) from historic eruptions to back-calculate their formation conditions, or to predict the evolution of eruptive processes (Figs. 1, 4), based on the knowledge of the deformation conditions (De*) and the melt properties (Oh). Therefore, the fragmentation criterion presented here (Eq. 5) takes us closer to answering a fundamental question in volcanology—will an eruption behave in an effusive or an explosive manner?
Methods
CaBER measurements
The Capillary Breakup Extensional Rheometer (CaBER) was fitted with parallel plates with a diameter of 2, 4, 5 or 8 mm and a separation between 0.5 and 4 mm. The sample was loaded between the plates and a step strain was applied with a strike distance between 2.5 and 17.5 mm and a strike time between 20 and 250 ms. The conditions used for each experiment are shown in the Supplementary Data 1. The initial strike (i.e. the deformation) and subsequent relaxation was filmed using a camera at 550 frames per second. The experiments were performed at room temperature. The temperature of the fluid was monitored for each experiment and was always in the range 18.45–19.10 °C. The extracted video was monitored and the filament diameter (d) measured from the last frame in which the filament was uniform (i.e. in the case of break-up, the frame before necking and break-up occurred or in the case of thinning, the final frame of the strike).
The strain rate () experienced by the extending filament was calculated as:
| 7 |
where, as previous, d is the filament diameter measured from the last frame in which the filament was uniform. Here, the extension rate, , was calculated immediately before break-up or the end of strike. Specifically, Δd was calculated by comparing the filament diameter one frame before break-up or end of strike and therefore Δt is the time step of one video frame (~1.8 ms).
Materials
The analogue fluid used in this study was a Newtonian sugar solution manufactured by Tate and Lyle and termed “golden syrup” hereafter. To produce a wide range of working fluid viscosities, the golden syrup was diluted to 0, 0.5, 1, 2, 5, 10, 20, 25, 30 and 40 wt.% deionized water.
Density measurements
Density values for the range of analogue fluids were measured using a calibrated 50 ml pycnometer flask. Fluids were added to the flask and left to equilibrate at a range of temperatures between 10 and 30 °C within a temperature-controlled water bath. Once equilibrated, the flask exterior was dried and then its mass measured on a ±500 μg desktop balance. This procedure was performed on aqueous dilutions of golden syrup (2, 5, 10, 15, 20, 25, 30 and 40wt.% H2O). The density of a particular fluid was found to vary as a function of temperature and follows the purely empirical general expression:
| 8 |
where T [°C−1] is the temperature and A [kg m−3 °C−1] and B [kg m−3] are fitted constants (Table 2). For each experiment the measured temperature, T, was used to calculate the fluid density.
Table 2.
Density fitting constants for golden syrup dilutions used
| Dilution (wt.%) | A [kg m−3 °C−1] | B [kg m−3] |
|---|---|---|
| 0 | −0.6094 | 1450.7 |
| 2 | −0.5996 | 1439.4 |
| 5 | −0.5965 | 1423.1 |
| 10 | −0.5935 | 1396.5 |
| 15 | −0.5942 | 1389.4 |
| 20 | −0.5817 | 1343.8 |
| 25 | −0.6727 | 1337.0 |
| 30 | −0.4545 | 1309.9 |
| 40 | −0.4615 | 1262.2 |
The density of a golden syrup dilution can be described as function of temperature by the expression: ρ = AT+B (Eq. 8), where T [°C−1] is the temperature and A [kg m−3 °C−1] and B [kg m−3] are constants.
Viscosity measurements
Viscosity measurements were conducted on a TA Instruments Discovery HR2 rheometer equipped with a Peltier plate and a 60 mm diameter, 2° cone with a gap of 53 μm. Samples were equilibrated at the desired temperature (same temperature as during CaBER tests) for 5 min before testing in the shear rate range between 0.1 and ≥50 s−1. The viscosity was calculated as an average over the measured shear rate range, once measurements had stabilized. The lowest viscosity samples, of 25, 30 and 40 wt.% H2O, were measured using a TA instruments AR2000 rheometer equipped with a double concentric cylinder with a gap of 500 μm. The testing procedure was the same as that used on the Peltier plate.
Surface tension measurements
Surface tension measurements were conducted using a Krüss K10ST tensiometer, using the Du Noüy ring method53. The ring was attached to the tensiometer and allowed to hang freely, and the instrument zeroed. The ring was then lowered into the golden syrup solution until completely submerged, and the surface tension digital readout adjusted to ~10 mN m−1 below the estimated surface tension. The sample vessel was lowered by the servomotors, withdrawing the ring from the sample, until a maximum in force was reached. This was recorded as the surface tension. The reported surface tension was taken as an average of at least five measurements. The ring was cleaned by submerging in distilled water before being spun in the flame of a gas burner for ~10 s until it glowed red. The vessel speed control was altered depending on the viscosity of the sample, with higher viscosity samples requiring a lower speed setting. The pure golden syrup (i.e. 0% dilution) was too viscous for this technique, so a value of 0.08 N m−1 was taken from the published literature50.
Estimation of natural instability timescales
The timescales of the natural systems shown in Fig. 4 were calculated using the literature values given in Table 1 and Eqs. 1 and 2. To extract the range of capillary instability timescales, the maximum and minimum values were calculated using the range of physical properties in Table 1. The only independent variable in the viscous instability timescale is the viscosity. Hence, varying the viscosity (within the literature range) gives the range of viscous instability timescales expected for each capillary timescale. Table 3 details these calculations.
Table 3.
The instability timescales for natural volcanic compositions
| d [m] | σ [N m−1] | ρ [kg m−3] | η [Pa·s] | λcap [s] | λvis [s] |
|---|---|---|---|---|---|
| Basalt | |||||
| 0.0001 | 0.25 | 2400 | 10 | 9.80 × 10⁻⁵ | 4.00 × 10⁻³ |
| 0.1 | 0.07 | 2800 | 10 | 6.32 | 1.43 × 101 |
| 0.0001 | 0.25 | 2400 | 1000 | 9.80 × 10⁻⁵ | 4.00 × 10⁻¹ |
| 0.1 | 0.07 | 2800 | 1000 | 6.32 | 1.43 × 10³ |
| Kimberlite | |||||
| 0.0001 | 0.25 | 2500 | 0.1 | 1.00 × 10⁻⁴ | 4.00 × 10⁻⁵ |
| 0.1 | 0.07 | 2800 | 0.1 | 6.32 | 1.43 × 10⁻¹ |
| 0.0001 | 0.25 | 2500 | 10 | 1.00 × 10⁻⁴ | 4.00 × 10⁻³ |
| 0.1 | 0.07 | 2800 | 10 | 6.32 | 1.43 × 101 |
| Carbonatite | |||||
| 0.0001 | 0.25 | 2000 | 0.01 | 8.94 × 10⁻⁵ | 4.00 × 10⁻⁶ |
| 0.1 | 0.07 | 2300 | 0.01 | 5.73 | 1.43 × 10⁻² |
| 0.0001 | 0.25 | 2000 | 10 | 8.94 × 10⁻⁵ | 4.00 × 10⁻³ |
| 0.1 | 0.07 | 2300 | 10 | 5.73 | 1.43 × 101 |
This table lists the parameter values used to calculate the viscous and capillary instability timescales for basaltic, kimberlitic and carbonatitic pyroclasts
Supplementary information
Description of Additional Supplementary Files
Acknowledgements
We wish to thank Richard Thompson for the use of the laboratory equipment. T.J.J. acknowledges support from NERC grant NE/L002590/1 and a Rice University Fellowship.
Author contributions
T.J.J. conceptualized the study. All experiments and materials characterization were conducted equally between all authors. T.J.J. and C.D.R. performed the data analysis. T.J.J. prepared an initial draft of the manuscript, which S.C.B. and C.D.R. subsequently edited.
Data availability
All data generated or analysed during this study are included in Supplementary Data 1.
Competing interests
The authors declare no competing interests.
Footnotes
Peer review information: Nature Communications thanks Stephen Lane, Atsuko Namiki and the other anonymous reviewer(s) for their contribution to the peer review of this work.
Publisher’s note: Springer Nature remains neutral with regard to jurisdictional claims in published maps and institutional affiliations.
Supplementary information
Supplementary Information accompanies this paper at 10.1038/s41467-019-11750-4.
References
- 1.Dingwell DB. Volcanic dilemma: flow or blow? Science (80-.). 1996;273:1054. doi: 10.1126/science.273.5278.1054. [DOI] [Google Scholar]
- 2.Gonnermann HM. Magma fragmentation. Annu. Rev. Earth Planet. Sci. 2015;43:431–458. doi: 10.1146/annurev-earth-060614-105206. [DOI] [Google Scholar]
- 3.Woods AW, Koyaguchi T. Transitions between explosive and effusive eruptions of silicic magmas. Nature. 1994;370:641–644. doi: 10.1038/370641a0. [DOI] [Google Scholar]
- 4.Gudmundsson MT, et al. Ash generation and distribution from the April–May 2010 eruption of Eyjafjallajökull, Iceland. Sci. Rep. 2012;2:572. doi: 10.1038/srep00572. [DOI] [PMC free article] [PubMed] [Google Scholar]
- 5.Pedersen GBM, et al. Lava field evolution and emplacement dynamics of the 2014–2015 basaltic fissure eruption at Holuhraun, Iceland. J. Volcanol. Geotherm. Res. 2017;340:155–169. doi: 10.1016/j.jvolgeores.2017.02.027. [DOI] [Google Scholar]
- 6.Witham CS, Oppenheimer C. Mortality in England during the 1783-4 Laki Craters eruption. Bull. Volcanol. 2004;67:15–26. doi: 10.1007/s00445-004-0357-7. [DOI] [Google Scholar]
- 7.Gonnermann HM, Manga M. Explosive volcanism may not be an inevitable consequence of magma fragmentation. Nature. 2003;426:432. doi: 10.1038/nature02138. [DOI] [PubMed] [Google Scholar]
- 8.Papale P. Strain-induced magma fragmentation in explosive eruptions. Nature. 1999;397:425. doi: 10.1038/17109. [DOI] [PubMed] [Google Scholar]
- 9.Cassidy M, Manga M, Cashman K, Bachmann O. Controls on explosive-effusive volcanic eruption styles. Nat. Commun. 2018;9:2839. doi: 10.1038/s41467-018-05293-3. [DOI] [PMC free article] [PubMed] [Google Scholar]
- 10.Castro JM, Dingwell DB. Rapid ascent of rhyolitic magma at Chaitén volcano, Chile. Nature. 2009;461:780. doi: 10.1038/nature08458. [DOI] [PubMed] [Google Scholar]
- 11.Jones TJ, et al. Primary and secondary fragmentation of crystal-bearing intermediate magma. J. Volcanol. Geotherm. Res. 2016;327:70–83. doi: 10.1016/j.jvolgeores.2016.06.022. [DOI] [Google Scholar]
- 12.Valentine GA, Gregg TKP. Continental basaltic volcanoes—processes and problems. J. Volcanol. Geotherm. Res. 2008;177:857–873. doi: 10.1016/j.jvolgeores.2008.01.050. [DOI] [Google Scholar]
- 13.Ruesch O, et al. Cryovolcanism on Ceres. Science (80-.). 2016;353:aaf4286. doi: 10.1126/science.aaf4286. [DOI] [PubMed] [Google Scholar]
- 14.Schenk PM, McKinnon WB, Gwynn D, Moore JM. Flooding of Ganymede’s bright terrains by low-viscosity water-ice lavas. Nature. 2001;410:57. doi: 10.1038/35065027. [DOI] [PubMed] [Google Scholar]
- 15.Moitra P, Gonnermann HM, Houghton BF, Tiwary CS. Fragmentation and Plinian eruption of crystallizing basaltic magma. Earth Planet. Sci. Lett. 2018;500:97–104. doi: 10.1016/j.epsl.2018.08.003. [DOI] [Google Scholar]
- 16.Namiki A, Manga M. Transition between fragmentation and permeable outgassing of low viscosity magmas. J. Volcanol. Geotherm. Res. 2008;169:48–60. doi: 10.1016/j.jvolgeores.2007.07.020. [DOI] [Google Scholar]
- 17.Mangan, M. T., Cashman, K. V. & Swanson, D. A. The Dynamics of Hawaiian-Style Eruptions: A Century of Study 1801. Professional Papers (US Geological Survey, Reston, 2014).
- 18.Rust AC, Cashman KV. Permeability controls on expansion and size distributions of pyroclasts. J. Geophys. Res. Solid Earth. 2011;116:1–7. doi: 10.1029/2011JB008494. [DOI] [Google Scholar]
- 19.Mangan MT, Cashman KV. The structure of basaltic scoria and reticulite and inferences for vesiculation, foam formation, and fragmentation in lava fountains. J. Volcanol. Geotherm. Res. 1996;73:1–18. doi: 10.1016/0377-0273(96)00018-2. [DOI] [Google Scholar]
- 20.Mader HM, et al. Experimental simulations of explosive degassing of magma. Nature. 1994;372:85. doi: 10.1038/372085a0. [DOI] [Google Scholar]
- 21.Cashman KV, Sparks RSJ. How volcanoes work: a 25 year perspective. Bulletin. 2013;125:664–690. [Google Scholar]
- 22.Villermaux E. Fragmentation. Annu. Rev. Fluid Mech. 2007;39:419–446. doi: 10.1146/annurev.fluid.39.050905.110214. [DOI] [Google Scholar]
- 23.Sánchez MC, Sarrionandia F, Arostegui J, Ibarguchi JIG. Silicate glass micro and nanospherules generated in explosive eruptions of ultrabasic magmas: implications for the origin of pelletal lapilli. J. Volcanol. Geotherm. Res. 2015;293:13–24. doi: 10.1016/j.jvolgeores.2014.12.010. [DOI] [Google Scholar]
- 24.Del Bello Elisabetta, Llewellin Edward W., Taddeucci Jacopo, Scarlato Piergiorgio, Lane Steve J. An analytical model for gas overpressure in slug-driven explosions: Insights into Strombolian volcanic eruptions. Journal of Geophysical Research: Solid Earth. 2012;117(B2):n/a-n/a. doi: 10.1029/2011JB008747. [DOI] [Google Scholar]
- 25.James MR, Lane SJ, Wilson L, Corder SB. Degassing at low magma-viscosity volcanoes: quantifying the transition between passive bubble-burst and Strombolian eruption. J. Volcanol. Geotherm. Res. 2009;180:81–88. doi: 10.1016/j.jvolgeores.2008.09.002. [DOI] [Google Scholar]
- 26.Houghton BF, et al. Stronger or longer: discriminating between Hawaiian and Strombolian eruption styles. Geology. 2016;44:163–166. doi: 10.1130/G37423.1. [DOI] [Google Scholar]
- 27.Gerst A, Hort M, Aster RC, Johnson JB, Kyle PR. The first second of volcanic eruptions from the Erebus volcano lava lake, Antarctica—energies, pressures, seismology, and infrasound. J. Geophys. Res. Solid Earth. 2013;118:3318–3340. doi: 10.1002/jgrb.50234. [DOI] [Google Scholar]
- 28.Jaupart C, Vergniolle S. Laboratory models of Hawaiian and Strombolian eruptions. Nature. 1988;331:58. doi: 10.1038/331058a0. [DOI] [Google Scholar]
- 29.Villermaux E, Bossa B. Single-drop fragmentation determines size distribution of raindrops. Nat. Phys. 2009;5:697. doi: 10.1038/nphys1340. [DOI] [Google Scholar]
- 30.Porritt LA, Russell JK, Quane SL. Pele’s tears and spheres: examples from Kilauea Iki. Earth Planet. Sci. Lett. 2012;333:171–180. doi: 10.1016/j.epsl.2012.03.031. [DOI] [Google Scholar]
- 31.Moune S, Faure F, Gauthier P-J, Sims KWW. Pele’s hairs and tears: natural probe of volcanic plume. J. Volcanol. Geotherm. Res. 2007;164:244–253. doi: 10.1016/j.jvolgeores.2007.05.007. [DOI] [Google Scholar]
- 32.Villermaux E. The formation of filamentary structures from molten silicates: Pele’s hair, angel hair, and blown clinker. CR Mécanique. 2012;340:555–564. doi: 10.1016/j.crme.2012.06.003. [DOI] [Google Scholar]
- 33.Gernon TM, Brown RJ, Tait MA, Hincks TK. The origin of pelletal lapilli in explosive kimberlite eruptions. Nat. Commun. 2012;3:832. doi: 10.1038/ncomms1842. [DOI] [PubMed] [Google Scholar]
- 34.Sumner JM, Blake S, Matela RJ, Wolff JA. Spatter. J. Volcanol. Geotherm. Res. 2005;142:49–65. doi: 10.1016/j.jvolgeores.2004.10.013. [DOI] [Google Scholar]
- 35.Jones TJ, Houghton BF, Llewellin EW, Parcheta CE, Höltgen L. Spatter matters—distinguishing primary (eruptive) and secondary (non-eruptive) spatter deposits. Sci. Rep. 2018;8:9179. doi: 10.1038/s41598-018-27065-1. [DOI] [PMC free article] [PubMed] [Google Scholar]
- 36.Moss S, Russell JK. Fragmentation in kimberlite: products and intensity of explosive eruption. Bull. Volcanol. 2011;73:983–1003. doi: 10.1007/s00445-011-0504-x. [DOI] [Google Scholar]
- 37.McKinley GH, Sridhar T. Filament-stretching rheometry of complex fluids. Annu. Rev. Fluid Mech. 2002;34:375–415. doi: 10.1146/annurev.fluid.34.083001.125207. [DOI] [Google Scholar]
- 38.Eggers J, Villermaux E. Physics of liquid jets. Rep. Prog. Phys. 2008;71:36601. doi: 10.1088/0034-4885/71/3/036601. [DOI] [Google Scholar]
- 39.McKinley GH. Visco-elasto-capillary thinning and break-up of complex fluids. Rheol. Rev. 2005;3:1–48. [Google Scholar]
- 40.Bhat PP, et al. Formation of beads-on-a-string structures during break-up of viscoelastic filaments. Nat. Phys. 2010;6:625. doi: 10.1038/nphys1682. [DOI] [Google Scholar]
- 41.Webb SL, Dingwell DB. Non-Newtonian rheology of igneous melts at high stresses and strain rates: Experimental results for rhyolite, andesite, basalt, and nephelinite. J. Geophys. Res. Solid Earth. 1990;95:15695–15701. doi: 10.1029/JB095iB10p15695. [DOI] [Google Scholar]
- 42.Webb SL, Dingwell DB. The onset of non-Newtonian rheology of silicate melts. Phys. Chem. Miner. 1990;17:125–132. doi: 10.1007/BF00199663. [DOI] [Google Scholar]
- 43.Wadsworth, F. B., Witcher, T., Vasseur, J., Dingwell, D. B. & Scheu, B. When does magma break? In Advances in Volcanology (eds Gottsmann, J., Neuberg, J. & Scheu, B.) (Springer, Berlin, Heidelberg, 2017).
- 44.Wilson L. Explosive volcanic eruptions—X. The influence of pyroclast size distributions and released magma gas contents on the eruption velocities of pyroclasts and gas in Hawaiian and Plinian eruptions. Geophys. J. Int. 1999;136:609–619. doi: 10.1046/j.1365-246x.1999.00750.x. [DOI] [Google Scholar]
- 45.Faeth GM, Hsiang L-P, Wu P-K. Structure and breakup properties of sprays. Int. J. Multiphase Flow. 1995;21:99–127. doi: 10.1016/0301-9322(95)00059-7. [DOI] [Google Scholar]
- 46.Nicholls JA, Ranger AA. Aerodynamic shattering of liquid drops. AIAA J. 1969;7:285–290. doi: 10.2514/3.5087. [DOI] [Google Scholar]
- 47.Cannata CB, et al. First 3D imaging characterization of Pele’s hair from Kilauea volcano (Hawaii) Sci. Rep. 2019;9:1711. doi: 10.1038/s41598-018-37983-9. [DOI] [PMC free article] [PubMed] [Google Scholar]
- 48.Mader HM, Llewellin EW, Mueller SP. The rheology of two-phase magmas: a review and analysis. J. Volcanol. Geotherm. Res. 2013;257:135–158. doi: 10.1016/j.jvolgeores.2013.02.014. [DOI] [Google Scholar]
- 49.Mueller S., Llewellin E. W., Mader H. M. The rheology of suspensions of solid particles. Proceedings of the Royal Society A: Mathematical, Physical and Engineering Sciences. 2009;466(2116):1201–1228. doi: 10.1098/rspa.2009.0445. [DOI] [Google Scholar]
- 50.Llewellin EW, Mader HM, Wilson SDR. The rheology of a bubbly liquid. Proc. R. Soc. Lond. A. 2002;458:987–1016. doi: 10.1098/rspa.2001.0924. [DOI] [Google Scholar]
- 51.Arciniaga M, Kuo C-C, Dennin M. Size dependent brittle to ductile transition in bubble rafts. Colloids Surf. A. 2011;382:36–41. doi: 10.1016/j.colsurfa.2010.12.018. [DOI] [Google Scholar]
- 52.Hoyle DM, Fielding SM. Age-dependent modes of extensional necking instability in soft glassy materials. Phys. Rev. Lett. 2015;114:158301. doi: 10.1103/PhysRevLett.114.158301. [DOI] [PubMed] [Google Scholar]
- 53.du Noüy PL. An interfacial tensiometer for universal use. J. Gen. Physiol. 1925;7:625. doi: 10.1085/jgp.7.5.625. [DOI] [PMC free article] [PubMed] [Google Scholar]
- 54.Murase T, McBirney AR. Properties of some common igneous rocks and their melts at high temperatures. Geol. Soc. Am. Bull. 1973;84:3563–3592. doi: 10.1130/0016-7606(1973)84<3563:POSCIR>2.0.CO;2. [DOI] [Google Scholar]
- 55.Colucci S, Battaglia M, Trigila R. A thermodynamical model for the surface tension of silicate melts in contact with H2O gas. Geochim. Cosmochim. Acta. 2016;175:113–127. doi: 10.1016/j.gca.2015.10.037. [DOI] [Google Scholar]
- 56.Gardner JE, Ketcham RA, Moore G. Surface tension of hydrous silicate melts: constraints on the impact of melt composition. J. Volcanol. Geotherm. Res. 2013;267:68–74. doi: 10.1016/j.jvolgeores.2013.09.007. [DOI] [Google Scholar]
- 57.Sparks RSJ, et al. Dynamical constraints on kimberlite volcanism. J. Volcanol. Geotherm. Res. 2006;155:18–48. doi: 10.1016/j.jvolgeores.2006.02.010. [DOI] [Google Scholar]
- 58.Wolff JA. Physical properties of carbonatite magmas inferred from molten salt data, and application to extraction patterns from carbonatite-silicate magma chambers. Geol. Mag. 1994;131:145–153. doi: 10.1017/S0016756800010682. [DOI] [Google Scholar]
- 59.Jones AP, Genge M, Carmody L. Carbonate melts and carbonatites. Rev. Mineral. Geochem. 2013;75:289–322. doi: 10.2138/rmg.2013.75.10. [DOI] [Google Scholar]
- 60.Dawson JB, Pinkerton H, Norton GE, Pyle DM. Physicochemical properties of alkali carbonatite lavas: data from the 1988 eruption of Oldoinyo Lengai, Tanzania. Geology. 1990;18:260–263. doi: 10.1130/0091-7613(1990)018<0260:PPOACL>2.3.CO;2. [DOI] [Google Scholar]
Associated Data
This section collects any data citations, data availability statements, or supplementary materials included in this article.
Supplementary Materials
Description of Additional Supplementary Files
Data Availability Statement
All data generated or analysed during this study are included in Supplementary Data 1.