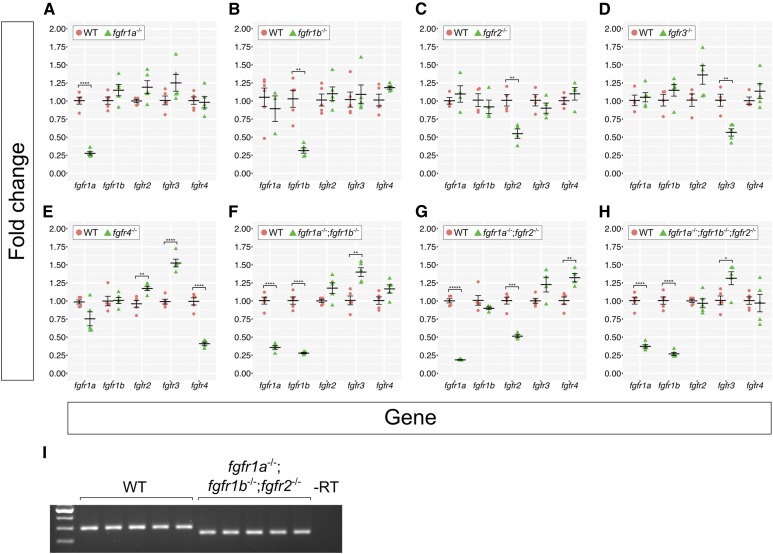
Figure 2.
Fgf receptor mRNAs are overexpressed in some Fgf receptor mutants compared to wild-type embryos. (A–H) Fold changes calculated from RT-qPCR experiments comparing Fgf receptor mRNA levels between wild-type (WT, pink circles) and various Fgf receptor mutants (green triangles). Each point represents the mean fold change of an individual embryo, relative to WT. Error bars represent ± the SEM (center bar). Number of asterisks represents P-values calculated using a Student’s t-test: no asterisk between WT and mutant denotes P > 0.05, *P < 0.05, **P < 0.01, ***P < 0.001, ****P < 0.0001, *****P < 0.00001. Results of the Student’s t-test were confirmed using Multivariate ANOVA (MANOVA) tests (see Materials and Methods). (I) Because the fgfr1a;fgfr1b;fgfr2 triple mutants represented in (H) displayed near-WT levels of fgfr2 mRNA, fgfr2 genotypes were confirmed with standard RT-PCR. Note the decreased band size in all fgfr1a;fgfr1b;fgfr2 mutants.

