Abstract
PAC1 is a recently cloned and characterized heptahelical, G protein-coupled receptor with high affinity to PACAP-27 and PACAP-38 and is differentially coupled to activate intracellular Ca2+ and cAMP. PAC1 is expressed as four major splice variants, each possessing differential coupling to inositol phosphates and intracellular Ca2+. PAC1 has been shown previously to be expressed and regulate the growth and proliferation of nonsquamous cell lung cancer cells, as well as breast cancer cell lines. PAC1 is expressed on the HCT8 human colon cancer cell line and is coupled to the activation of both intracellular cAMP and Ca2+ with consequent stimulation of growth. In the current study, we contrast the effects of pituitary adenylate cyclase-activating polypeptide (PACAP) on the HCT8 colon cancer cell lines to the HCT116 and FET cell lines wherein PAC1 is expressed as the SV1 or HIP splice variant and is coupled to the activation only of cAMP but not of intracellular Ca2+. These data indicate that human colon tumor cells express PAC1 and are differentially coupled to intracellular signal transduction molecules. The ability to activate both cAMP and Ca2+ appears to be a prerequisite for activation of tumor proliferation, indicating a potentially important factor in how PACAP potentiates the growth of certain tumors.
Keywords: Pituitary adenylate cyclase-activating polypeptide, pituitary adenylate cyclase-activating polypeptide type 1 receptor, adenylyl cyclase
Introduction
Pituitary adenylate cyclase-activating polypeptide (PACAP) is one of the most recently described neuropeptides in the central nervous system and in the gastrointestinal tract. The hormone belongs to a superfamily of peptides with high homology to vasoactive intestinal polypeptide (VIP) and secretin (Miyata et al., 1990). The two biologically active forms of PACAP include PACAP-38 and PACAP-27. Each form has a high homology to secretin and VIP. Receptors for PACAP can be generally divided into three major groups based on their radioligand binding characteristics to PACAP, VIP, and helodermin. Pharmacologically, the receptors have been characterized as PAC1, VPAC1, and VPAC2 (Harmar et al., 1998). PAC1 receptors have high affinity for only PACAP, whereas the other receptors have nearly equal affinities for PACAP and VIP.
The PAC1 receptor is expressed on a variety of human tumor cell models including the pancreas, lung, and breast. In these cell systems, both VIP and PACAP have been shown to have a role in the regulation of tumor cell proliferation (Moody et al., 1993). PACAP has been shown to induce expression of c-fos, c-myc, and c-jun, processes, which are mediated by the activation of phospholipase C and protein kinase C (Moody et al., 2002). Following the cloning of the PAC1 receptor, it was shown that this receptor is able to couple to a dual signal transduction system through the activation of adenylyl cyclase and phospholipase C (Spengler et al., 1993). This dual pathway of signaling was initially demonstrated in the rat pheochromocytoma cell line PC12 (Deutsch and Sun, 1992). Presumably, PAC1 is able to couple to both Gas and Gaq to mediate these effects. In native cell systems, PAC1 is similarly coupled to a dual signal transduction cascade (Zeng et al., 1999). It has been postulated that PAC1 is capable of differentially coupling to a predominant signaling pathway in stably transfected cell lines, although this has not been demonstrated in native cell systems (Spengler et al., 1993). We have shown previously that PAC1 is expressed on the human colon cancer cell line HCT8, where it is coupled to both the activation of cAMP and Ca2+ (Le et al., 2002).
In the current study, we demonstrate in the HCT116 and FET cell models of human colonic cancers that PAC1 is expressed as the SV1 or HIP splice variant, which is coupled to cAMP activation but not intracellular Ca2+. Furthermore, unlike in the HCT8 cell system, where PAC1 is coupled to both cAMP and Ca2+ and PACAP induced growth (Le et al., 2002), in the HCT116 cell system PAC1 does not couple to Ca2+ nor PACAP had an effect on proliferation.
Materials and Methods
Cell Culture
HCT116 and FET cells were cultured in 5A McCoy’s medium containing 10% fetal bovine serum (FBS), 100 μg/mL kanamycin (GIBCO, Carlsbad, CA), and 5.2 μg/mL gentamicin (Sigma, St. Louis, MO) antibiotics. Adherent cells were washed with PBS and treated with trypsin/EDTA, then pelleted, resuspended in fresh medium, and incubated at 37°C in 5% CO2. The cells were studied during their exponential growth phase and were mycoplasma-free, as determined by immunocytofluorescence staining with DAPI.
FACS Analysis
The expression of PAC1 was characterized on FET and HCT116 cells using fluorescence-activated cell sorter (FACS) analysis. Approximately 1 million cells were grown in 5AMcCoy’s medium containing 10% FBS, then trypsinized, fixed with 4% formaldehyde and permeabilized with 0.1% Triton X for 15 min at 4°C. The fixed cells were washed twice with PBS and incubated with rabbit anti-PAC1 antiserum (1:1000) (CURE) in PBS/1% goat serum. Cells were also incubated with rabbit IgG (10 mg/mL) as a control for unspecific binding. The following day, the samples were washed twice with PBS and 0.05% Tween-20 and incubated with goat anti-rabbit FITC-conjugated antibodies (Molecular Probes, Eugene OR) for 1 h at 4°C in PBS/1% goat serum. The samples were analyzed with FACS (BD Bioscience, Franklin Lakes, NJ), and data collected.
Confocal Microscopy
To further confirm the expression of PAC1 on FET and HCT116 cells, confocal microscopy was used to characterize receptor expression on the cell surface using polyclonal rabbit anti-PAC1 antibodies. Cells were plated overnight at a low density on polylysine-coated coverslips. The following day, the cells were fixed for 30 min with 4% paraformaldehyde permeabilized with 0.1% Triton X and incubated with rabbit polyclonal anti-PAC1 (1:1000) overnight. Cells incubated with 10 μg/mL rabbit IgG were used as a control for unspecific binding. The next day, the cells were washed twice with PBS and then incubated with Alexa 488 conjugated goat anti-rabbit IgG (Molecular Probes, Eugene OR) in PBS/1% BSA. Samples were observed on a Zeiss LSM 510 laser scanning microscope at 100× magnification (Carl Zeiss, Thornwood, NY).
cDNA Synthesis and RT-PCR Analysis
RNA was extracted from ~5 million FET and HCT116 cells after cell preparation using the Fast Track RNA Purification® kit (Invitrogen. La Jolla, CA), as described previously (Zeng et al., 1999). Total RNA (5 μg) was used to synthesize cDNA by reverse transcriptase (RT) with oligo(dT) primers (Perkin Elmer, Boston, MA). Polymerase chain reaction (PCR) was performed in low-salt Taq+ DNA polymerase buffer and 5 U Taq+ DNA polymerase (Stratagene, La Jolla, CA) in the presence of oligonucleotide primers under the following conditions: initial step (one cycle): 94°C for 2 min, 57°C for 1 min, and 72°C for 2 min, followed by 94°C for 1 min, 57°C for 1 min, and 72°C for 2 min (30 cycles); and a final extension step (one cycle) at 94°C for 1 min, 57°C for 1 min, and 72°C for 15 min. The primers used were (sense 1) 5′-TGCTGGCCAAGTGTCATG-3′ (nucleotides 50–70) and (antisense) 5′-CTGGGAC-CGCAGGTGC-3′ (nucleotides 1780–1800) (Pisegna and Wank, 1996). Amplified products were purified from 0.7% agarose gels using the Quiex Gel Extraction Kit® and subcloned into plasmid pCR-Script Amp SK(+) (Stratagene, La Jolla, CA). DNA sequence analysis was performed with 500 fmol of extracted DNA product using a DNA Autoanalyzer (ABT).
PACAP-38-Induced cAMP Response
To demonstrate that PAC1 receptors expressed on FET and HCT116 cells are functionally coupled to intracellular mediators, such as adenylyl cyclase, both colon cancer cells were stimulated with PACAP-38 in a dose-dependent manner and the cAMP levels were measured, as described previously (Pisegna and Wank, 1996). Briefly, cells were seeded on 24-well culture dishes overnight (~2.0 × 10⁵ cells/well) with 5A McCoy’s medium/10% FBS containing 100 μg/mL kanamycin and 5.2 μg/mL gentamicin, in the presence of [3H]adenine (Amersham, Arlington Heights, IL) at a concentration of 2 mCi/mL. The cells were washed with 5A McCoy’s medium/1% BSA, incubated with or without the indicated concentration of PACAP-38 in 5A McCoy’s medium/1% BSA and 2.5 mM 3-isobutyl, 1–1-methylxanthine (IBMX) (Sigma, St. Louis, MO), incubated for 30 min, and then the supernatants were suctioned. Subsequently, the cells were lysed using a 100 μL 2% SDS/1 mM cAMP solution. Total [3H]cAMP was assayed by consecutive Dowex AG-50W-X4 resin (Bio-Rad, Richmond, CA) and aluminum oxide (Sigma, St. Louis, MO) column chromatography, according to a modification of the procedure described by Salomon et al. (1974). Eluates were collected in vials and counted using a Beckman liquid scintillation counter (Beckman, Fullerton, CA).
PACAP-38-Induced Ca2+ Response
To further investigate whether PAC1, expressed by HCT116 and FET cells, could mediate an increase in cytosolic Ca2+, calcium imaging was performed. HCT116 and FET cells were seeded on glass coverslips overnight at a density of 200,000–400,000 cells/mL. The following day cells were washed twice with PBS and incubated at 37°C for 30 min in a confocal buffer (140 mM NaCl, 1.2 mM MgSO4, 1.0 mM CaCl2, 10 mM HEPES, 11.10 mM d-glucose, and 1% BSA buffer) and then incubated 30 min at 37°C with 2 μL of Fluo-4 AM (Molecular Probes) per milliliter of confocal buffer. The excess dye was washed away with PBS thereafter. Cells were then imaged in a chamber thermostatically controlled at 37°C within an hour from loading on the Zeiss LSM 510 Laser Scanning Microscope at 60× magnification (Carl Zeiss, Thornwood, NY). A time series was taken for a total of 40 images, with 20 s intervals between images. PACAP-38 (2.5 × 10⁻⁷ M) was pipetted into the chamber after 200 s, and 10 μM ionomycin was added after 700 s.
PACAP Effects on Proliferation
To investigate the effect of PACAP on HCT116 cellular growth, cells (~20,000 cells/well) were plated in 96-well plates overnight at 37°C. The next day, the cells were activated with PACAP-38 in medium in the absence of FBS, but in presence of insulin/transferrin/selenium A (GIBCO, Carlsbad, CA) for 24 h. The following day, to each well, 10 μL of 12 mM MTT (3-[4,5-dimethylthiazol-2-yl]-2,5-diphenylte-trazolium bromide) (Sigma) was added, and the cells were incubated for 4 h at 37°C. Subsequently, 100 μL of 0.01 M HCl/10% SDS solution was added to each well and the plates were incubated overnight at 37°C. The reaction was read as optical density the day after at 570 nm in a MRX Revelation ELISA Reader (Dynex Technologies, Vista, CA).
Results
FACS Analysis
To determine the presence of PAC1 on both the colon cancer cell lines, FET and HCT116, cytofluorimetric analysis was performed using rabbit polyclonal anti-PAC1 Abs, or rabbit IgG as a control to detect a potential aspecific binding (Fig. 1). The analysis showed that PAC1 receptor was expressed on approx 83.06% and 65.28% of HCT116 and FET cells, respectively (Fig. 1A,B). Untransfected NIH-3T3 cells, used as a negative control, failed to produce a shift in immunofluorescence (Fig. 1C), whereas NIH-3T3 cells, stably transfected with PAC1 (HOP), showed an increase of fluorescent intensity (Fig. 1D). Samples incubated with rabbit IgG showed no change in intensity (Fig. 1D). These results indicate the specific expression of PAC1 as assessed by FACS analysis, on FET and HCT116 colonic cancer cells, as well as on PAC1 transfected NIH-3T3 cells.
Fig. 1.
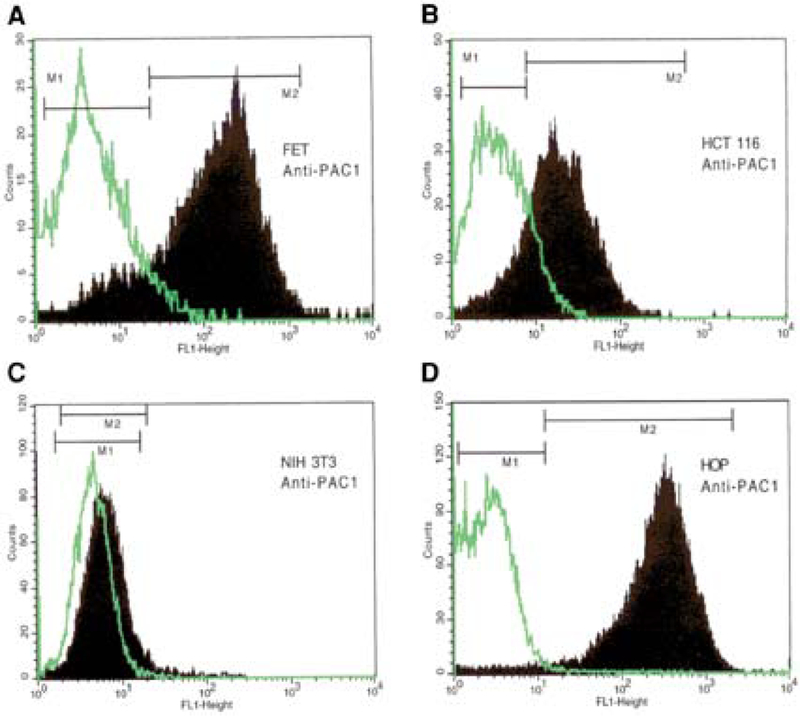
Cytofluorimetric analysis. Rabbit polyclonal anti-PAC1 antibodies followed by Alexa 488 goat anti-rabbit IgG (Molecular Probes) were used to detect the presence of PAC1 receptor on FET and HCT116 colon cancer cell lines. Panels A and B show that respectively 83.06%, and 65.28% cells were positive for PAC1 receptor expression, respectively (M2). Untransfected NIH-3T3 wild-type and PAC1-transfected NIH-3T3 cells (HOP) were used as negative and positive controls for PAC1, respectively (C,D). Rabbit IgG was used as a negative control for a specific binding (M1).
Confocal Laser Scanning Microscopy
The expression of PAC1 on both FET and HCT116 cells was confirmed by staining with polyclonal rabbit anti-PAC1 and then goat anti-rabbit FITC-conjugated antibodies, by confocal laser scanning microscopy to image fluorescently labeled cells (Fig. 2). Confocal microscopy confirmed the expression of PAC1 on FET and HCT116 as shown in Fig. 2A,C and on PAC1 transfected NIH-3T3 cells (Fig. 2E). Cells incubated with rabbit IgG used as negative control failed to demonstrate surface fluorescence (Fig. 2B,D) as well as NIH-3T3 cells (Fig. 2F).
Fig. 2.
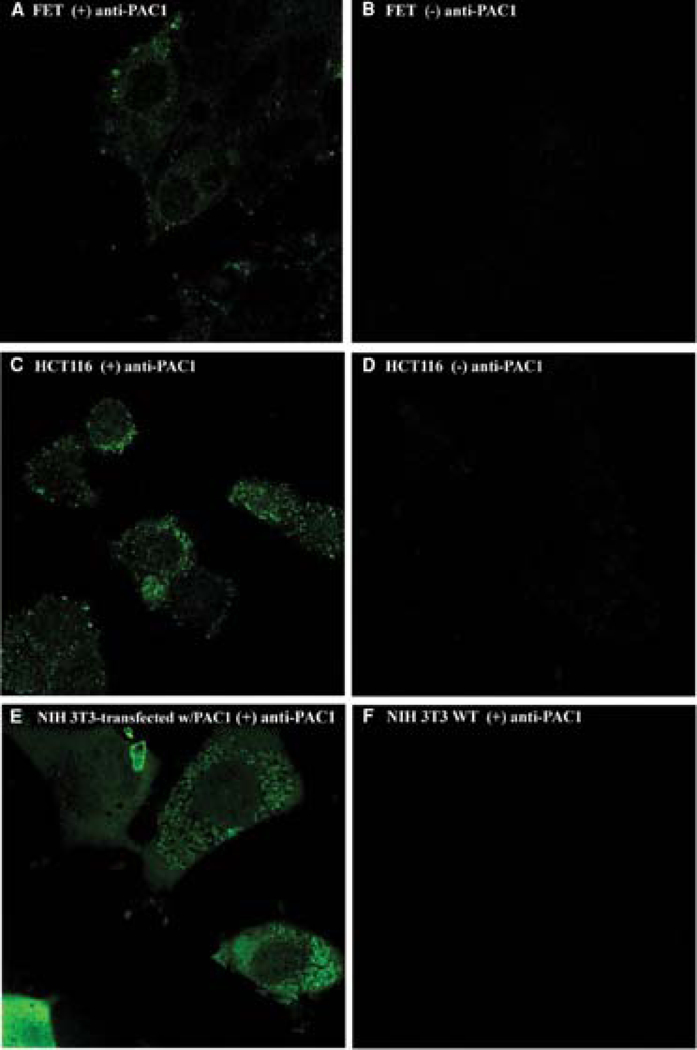
Confocal analysis. Rabbit polyclonal anti-PAC1 antibodies followed by Alexa 488 goat anti-rabbit IgG (Molecular Probes) confirmed the presence of PAC1 receptor on FET and HCT116 colon cancer cell lines (A,C). Panels B and D show FET and HCT116 incubated with rabbit IgG followed by Alexa 488-goat anti-rabbit IgG (Molecular Probes). In addition, PAC1-transfected NIH-3T3 and untransfected NIH-3T3 cells were used as PAC1-positive and -negative controls, respectively (E,F).
PAC1 Expression Demonstrated by RT-PCR
Reverse transcriptase polymerase chain reaction was used to characterize the expression of PAC1 on the indicated cells, using primers specific for the HIP or SV1 nine-splice variant of PAC1 (Fig. 3). No expression was present for the other splice variants of PAC1 (data not shown). Control DNA consisted of NIH-3T3 cells stably expressing the HOP or SV3 splice variant of PAC1. Amplification of the control DNA yielded the predicted size of an ~1.15-kb band. Both FET and HCT116 cells exhibited bands of the same transcript size compared to the control DNA.
Fig. 3.
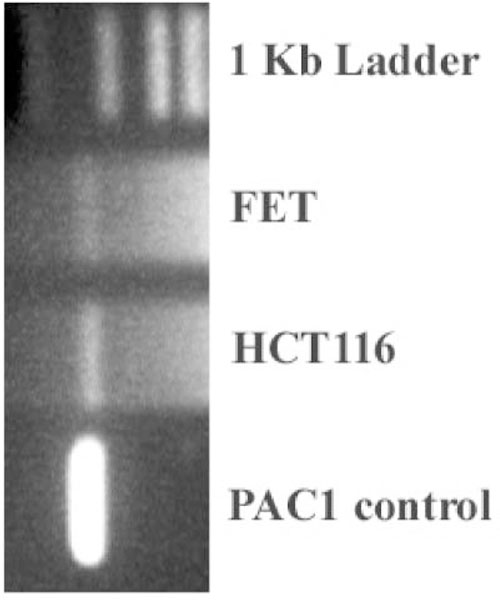
PCR analysis. PAC1 primers detected the presence of PAC1 receptor mRNAat ~1.35 kb. The primers used were (sense 1) 5′-TGCTGGCCAAGTGTCATG-3′ (nucleotides 50–70) and (antisense) 5′-CTGGGACCGCA GGTGC-3′ (nucleotides 1780–1800) (Pisegna and Wank, 1996) in FET and HCT116 cell lines. The SV1 or HIP PAC1 cDNA was used as a positive control.
PACAP-38-Induced cAMP Response
PACAP-38 elevated cAMP levels in a dose-dependent manner in both FET and HCT116 colon cancer cells with a half-maximal (EC50) stimulation of ~3.0 nM. A maximum 7.8-and 4.2-fold increase in cAMP levels was observed at 0.1 μM PACAP-38 stimulation for FET and HCT116 cells, respectively (Fig. 4A,B). These results are consistent with the previously described pharmacology of the PAC1 receptors and indicate that the receptors exhibit signal transduction coupled with adenylate cyclase. These data represent the means of at least three experiments performed in triplicate, and the response is represented as a percentage of the maximum response above basal levels.
Fig. 4.
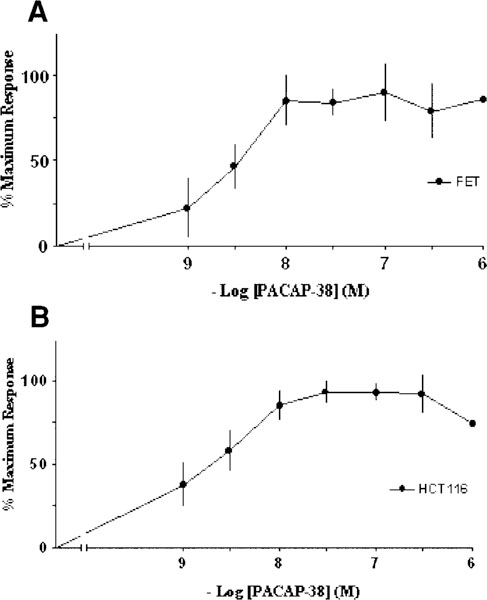
PACAP-38-induced cAMP response. PACAP-38 elevated cAMP levels in a dose-dependent manner in both FET and HCT116 colon cancer cells with a half-maximal (EC50) stimulation of ~3.0 nM. A 7.8-and 4.2-fold increase in cAMP levels was observed at 0.1 μ,M PACAP-38 stimulation for FET and HCT116 cells, respectively. These data represent the means of at least three experiments performed in triplicate, and the response is represented as a percentage of the maximum response above basal levels.
PACAP-38-Induced Ca2+ Response
To demonstrate whether PACAP acting at PAC1 receptors expressed on the HCT116 or FET cells induced an increase in cytosolic Ca2+ signaling, calcium imaging was performed. We hypothesized that similar to the human colonic cancer HCT8 cell line (Le, 2002), PACAP would induce a robust cytosolic Ca2+ response in Fluo-4-loaded HCT116 and FET cells following stimulation with PACAP-38. Using confocal microscopy, an entire field of cells was imaged (~50–60 cells for each coverslip). Figure 5A,B shows in both FET and HCT116 cells, the absence of a cytosolic Ca2+ response in response to PACAP stimulation but a normal response to ionomycin. These data represent the means of at least three experiments, and the Ca2+ response is represented as a percentage of the maximum ionomycin response above basal levels.
Fig. 5.
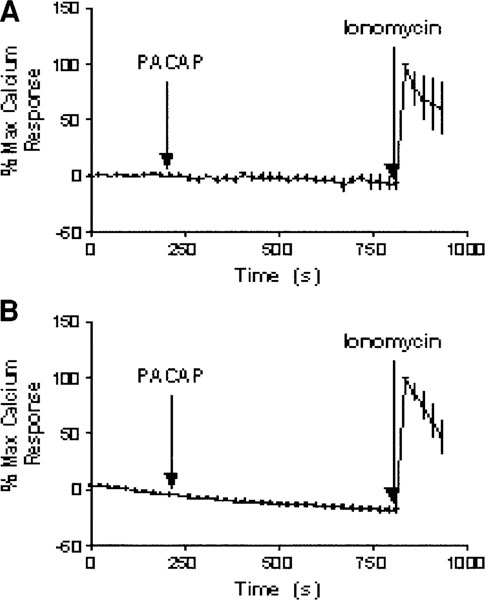
PACAP-38-induced Ca2+ to PACAP-38. FET and HCT116 cells were loaded with Fluo-4 AM for the visualization of Ca2+ transport under confocal microscopy. Atime series of a total of 40 images with 20-s intervals in between was taken to monitor the Ca2+activity. Upon activation with 2.5 × 10⁻⁷ M PACAP-38 at 200 s (tenth frame), there was no Ca2+ movement observed for both FET and HCT116 cells (A,B) relative to the response obtained from the addition of ionomycin. The addition of 10 μM ionomycin at the thirty-fifth frame of imaging induced a peak that signaled maximum calcium response.
PACAP Effects on Proliferation
Next, we investigated the effects of PACAP on the proliferation of HCT116 cells, in fact we hypothesized that similarly to the HCT8 cell system, PAC1 upon PACAP binding would induce a proliferative response. To demonstrate this, we used the MTT assay, which provides an indication of the number of viable cells. Following a 24-h incubation of HCT116 cells with PACAP-38 in serum-free medium containing insulin/transferrin/selenium A, cellular growth was assessed by MTT activity (Fig. 6). No increase in MTT derived formazan compound was observed in the HCT116 cells after activation with logarithic concentrations of PACAP-38 in comparison to unstimulated cells.
Fig. 6.
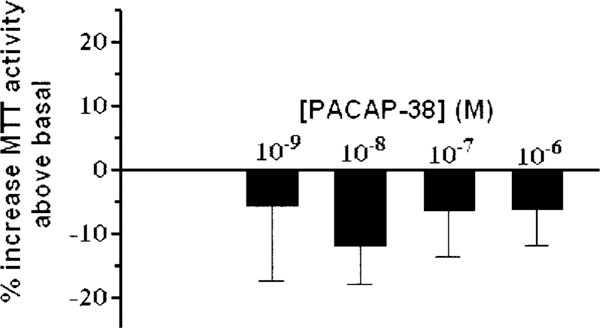
PACAP-38 effects on proliferation. MTT activity was assessed for HCT116 cells after 24-h activation with varying concentrations of PACAP-38 in serum-free media containing insulin/transferrin/selenium A. MTT activity is used to assess the number of viable cells. No increase in MTT activity was observed in HCT116 cells activated with PACAP-38 relative to unstimulated cells.
Discussion
PAC1 is one of the most recently discovered gastrointestinal receptors, which has been shown to regulate secretory and motility functions in the gut. PACAP and PAC1 appear to be expressed in the myenteric ganglia in which they regulate these functions (Miampamba et al., 2002). The discovery of PACAP and its receptor, PAC1, in the gastrointestinal tract has been greatly facilitated by the development of specific polyclonal antibodies directed against PAC1, as well as the use of a fluorescent derivative of PACAP, Fluor-PACAP (Germano et al., 2001).The presence of PAC1 on native cells in the gastrointestinal tract, such as the enterochromaffin-like (ECL) cells, in which it has been shown that PAC1 is expressed at high densities and is coupled to both cAMP and intracellular Ca2+ (Zeng et al., 1999). In addition, PACAP has been shown to stimulate the growth of ECL cells.
Since its discovery in tumoral cell systems, a number of investigators have reported on the expression of PAC1 in cancer cells, such as the pancreatic cancer cells, AR42J (Robberecht et al., 1991), the NB-OK1 human neuroblastoma cells (Hoshino et al., 1993), and the pheochromocytoma cell line, PC-12 (Deutsch and Sun, 1992). Other investigators have detected the expression of VIP and PACAP receptors on human lung cancer cells (Moody et al., 2002) and a human breast cancer cell line (Moody et al., 2002). Similarly, PAC1 is expressed on the human colon cancer cell line, HCT8, where PACAP showed effects leading to cellular proliferation (Le et al., 2002). In each of these cell systems, PAC1 appears to be coupled to both cAMP and Ca2+ signaling path-ways. It was originally hypothesized that certain splice variants expression could lead to an enhanced coupling to Ca2+ signaling pathways (Pisegna and Wank, 1996) and that there appears to be differential tissue expression of PAC1 splice variants (Spengler et al., 1993). Furthermore, in lung tumors it has been demonstrated that by using inhibitors of the phospholipase C or protein kinase C signaling pathways one could abolish the proliferative response of these cell systems (Pisegna et al., 1997). However, it has been difficult to demonstrate the selective nature of the signal transduction and proliferative responses without using specific signal transduction inhibitors. In this paper we demonstrate that in certain human colon cancer cell lines such as the HCT116 cell line, PAC1 is expressed and coupled to cAMP wherein PACAP fails to induce a proliferative response. The purpose of these results is to demonstrate that PAC1 can regulate growth in human colon cancer cells; hence, we investigated the HCT116 and FET cell line models.
Analysis using immunocytochemistry showed the expression of PAC1 in a specific fashion on HCT116 and FET cells. Those experiments were performed using our developed rabbit anti-PAC1 polyclonal antibodies, which have been characterized and estab-lished to be specific for the identification of PAC1 receptors. Similarly, using FACS analysis, ~84% of HCT116 and 65% of FET cells showed receptor expression. This compares to ~96% surface expression in the HCT8 cell system (Le et al., 2002). The data obtained using FACS analysis are consistent with those obtained by confocal microscopy. In other cell systems with this pattern of PAC1 expression, the receptors have been observed to internalize rapidly, with the majority of internalized receptors by 30 min (Lyu et al., 2000).
To further characterize the biological activity of PAC1 expressed on HCT116 and FET cells, intra-cellular cAMP was assessed. PACAP dose-dependently increased the intracellular cAMP levels with half-maximal stimulation occurring at 3 nM. These results are consistent with the pharmacological profile determined previously for PAC1 in stably transfected cell systems, as well as on the HCT8 colon cancer cell line (Pisegna and Wank, 1996; Le et al., 2002). Despite its ability to activate cAMP in both HCT116 and FET cell lines, PACAP was unable to stimulate intracellular Ca2+ release, unlike in the HCT8 cell line. Similarly, PACAP was unable to stimulate proliferation of the HCT116 cell line.
The role of differential activation of signal transduction pathways for PAC1 was first identified by Spengler and coworkers (1993). Presumably, the expression pattern for the splice variants of PAC1 accounts for the reported differences in the signal transduction characteristics. Previously, Moody and coworkers (Zia et al., 1996; Pisegna et al., 1997) reported that coupling to both cAMP and Ca2+ in human lung tumors appeared to be important for the regulation of growth pathways. Taken together, when PAC1 is expressed on human tumoral cell lines, differential coupling to both signal transduction pathways (i.e., cAMP and Ca2+) appears to be a prerequisite for tumor proliferation. Our RT-PCR analysis showed that the HIP splice variant was expressed on FET and HCT116 cells, and the low level of coupling to inositol phosphates is consistent with our previous findings on human PAC1 (Pisegna and Wank, 1996).
In summary, these results indicate that PAC1 is expressed on a variety of human colon cancer tumor lines. The receptors are biologically active, as evidenced by their ability to signal through cAMP signaling cascade. These results have potential clinical application, as human colon cancers represent a significant medical problem and are being diagnosed with increasing frequency owing to improved endoscopic surveillance methods. The discovery of the expression of PAC1 on human colon cancers may allow improved imaging and may lead to specific treatments in the future. Furthermore, the identified tumor colonic PAC1 receptors that coupled to both cAMP and Ca2+ pathways appear to be able to lead to PACAP-induced growth. Our findings suggest that PAC1 is a potential tumor marker for colonic tumors, and a target to modulate colonic cancer cell growth.
Acknowledgments
This work was supported by a VA Career Development Award and VA Merit Review grant (J. P.).
This work was presented at the third joint meeting of the Summer Neuropeptide Conference (13th annual meeting) and the European Neuropeptide Club (13th annual meeting) in Montauk, NY, June 8–12, 2003.
References
- Deutsch PJ and Sun Y (1992) The 38-amino acid form of pituitary adenylate cyclase-activating polypeptide stimulates dual signaling cascades in PC12 cells and promotes neurite outgrowth. J. Biol. Chem. 267, 5108–5113. [PubMed] [Google Scholar]
- Germano PM, Stalter J, Le SV, Wu M, Yamaguchi DJ, Scott D, and Pisegna JR (2001) Characterization of the pharmacology, signal transduction and internalization of the fluorescent PACAP ligand, fluor-PACAP, on NIH/3T3 cells expressing PAC1. Peptides 22,861–866. [DOI] [PMC free article] [PubMed] [Google Scholar]
- Harmar AJ, Arimura A, Gozes I, Journot L, Laburthe M, Pisegna JR, et al. (1998) International Union of Pharmacology. XVIII. Nomenclature of receptors for vasoactive intestinal peptide and pituitary adenylate cyclase-activating polypeptide. Pharmacol. Rev. 50, 265–270. [PMC free article] [PubMed] [Google Scholar]
- Hoshino M, Li M, Zheng LQ, Suzuki M, Mochizuki T, and Yanaihara N (1993) Pituitary adenylate cyclase activating peptide and vasoactive intestinal polypeptide: differentiation effects on human neuroblastoma NB-OK-1 cells. Neurosci Lett. 159, 35–38. [DOI] [PubMed] [Google Scholar]
- Le SV, Yamaguchi DJ, McArdle CA, Tachiki K, Pisegna JR, and Germano P (2002) PAC1 and PACAP expression, signaling, and effect on the growth of HCT8, human colonic tumor cells. Regul. Pept. 109, 115–125. [DOI] [PMC free article] [PubMed] [Google Scholar]
- Lyu R, Germano PM, Choi JK, Le SV, and Pisegna JR (2000) Identification of an essential amino acid motif within the C-terminus of the pituitary adenylate cyclase-activating polypeptide type 1 receptor that is critical for signal truncation but not for receptor internalization. J. Biol. Chem. 275, 36134–36142. [DOI] [PMC free article] [PubMed] [Google Scholar]
- Miampamba M, Germano PM, Arli S, Wong HH, Scott D, Tache Y, and Pisegna JR (2002) Expression of pituitary adeylate cyclase-activating 16 polypeptide and PACAP type I receptor in the rat gastric and colonic myenteric neurons. Regul.Pept. 105,145–154. [DOI] [PMC free article] [PubMed] [Google Scholar]
- Miyata A, Jiang L, Dahl RR, Kitada C, Kubo K, Fujino M, et al. (1990) Isolation of a neuropeptide corresponding to the N-terminal 27 residues of the pituitary adenylate cyclase activating polypeptide with 38 residues (PACAP-38). Biochem. Biophys. Res. Commun. 170, 643–648. [DOI] [PubMed] [Google Scholar]
- Moody TW, Leyton J, Casibang M, Pisegna JR, and Jensen RT (2002) PACAP-27 tyrosine phosphorylates mitogen activated protein kinase and increases VEGF mRNAs in human lung cancer cells. Regul. Pept. 109, 135–140. [DOI] [PMC free article] [PubMed] [Google Scholar]
- Moody TW, Zia F, and Makheja A (1993) Pituitary adenylate cyclase activating polypeptide receptors are present on small cell lung cancer cells. Peptides 14, 241–246. [DOI] [PubMed] [Google Scholar]
- Pisegna JR and Wank SA (1996) Cloning and characterization of the signal transduction of four splice variants of the human pituitary adenylate cyclase activating polypeptide receptor: evidence for dual coupling to adenylate cyclase and phospholipase C. J. Biol. Chem. 271, 17267–17271. [DOI] [PMC free article] [PubMed] [Google Scholar]
- Pisegna JR, Leyton J, Coelho T, Hida T, Jakolew S, Birrer S, et al. (1997) Differential activation of immediate-early gene expression by four splice variants of the human pituitary activating polypeptide receptor: evidence for an activation by PAcAP hybrid and the phospholipase C inhibitor U73122. Life Sci. 61,631–639.9250719 [Google Scholar]
- Robberecht P, Woussen-Colle MC, De Neef P, Gourlet P, Buscail L, Vandermeers A, et al. (1991) The two forms of the pituitary adenylate cyclase activating polypeptide (PACAP [1–27] 17 and PACAP [1–38]) interact with distinct receptors on rat pancreatic AR 4–2J cell membranes. FEBS Lett. 286, 133–136. [DOI] [PubMed] [Google Scholar]
- Salomon Y, Londos C, and Rodbell M (1974) A highly sensitive adenylate cyclase assay. Anal. Biochem. 58, 541–548. [DOI] [PubMed] [Google Scholar]
- Spengler D, Waeber C, Pantaloni C, Holsboer F, Bock-aert J, Seeburg PH, and Journot L (1993) Differential signal transduction by five splice variants of the PACAP receptor. Nature 365, 170–175. [DOI] [PubMed] [Google Scholar]
- Zeng N, Kang T, Wong H, Walsh JH, Sachs GA, and Pisegna JR (1999) PACAP type I receptor activation regulates ECL cells and gastric acid secretion. J. Clin. Invest. 104, 1383–1391. [DOI] [PMC free article] [PubMed] [Google Scholar]
- Zia F, Fagarasan M, Bitar K, Coy DH, Pisegna JR, Wank SA, and Moody TW (1996) PACAP receptors regulate the growth of non-small cell lung cancer cells. Cancer Res. 55,4886–4891. [PMC free article] [PubMed] [Google Scholar]


