Abstract
Objective
To explore the use of Contrast-enhanced Ultrasound (CEUS) in evaluating angiogenesis in a xenograft nasopharyngeal carcinoma (NPC) model in nude mice and the evolution of CEUS parameters according to the growth of NPC.
Methods
Nude mice were divided into three groups according to experiments conducted at various times from tumor implantation (8 mice/group; group A: 4 weeks from implantation; group B:6 weeks from implantation; group C:8 weeks from implantation). CNE-2 cells were transplanted in 24 nude mice and CEUS evaluations of the tumors were performed at 4, 6 or 8 weeks from implantation. CEUS parametric perfusion images and pathological findings were recorded. R version 3.4.4 software was used to analyze the CEUS parameters and pathological findings.
Results
One-way anova analysis indicated statistically significant differences among the three groups with the parameters of peak intensity (PI) (p<0.001), area wash in (AWI) (p<0.001), area wash out (AWO) (p<0.001) and tumor volumes (p<0.001).Pearson correlation coefficient analysis indicated that microvessel density (MVD) was correlated with tumor volume (r = 0.644, p = 0.001), PI (r = 0.904, p<0.0001), AWI (r = 0.547, p = 0.008) and AWO (r = 0.744, P<0.0001). Tumor volume was correlated with MVD (r = 0.644, p = 0.001), PI (r = 0.625, p = 0.002), AWI (r = 0.528, p = 0.012) and AWO (r = 0.784, p<0.001). The percentage of necrosis in histological sections was correlated with the percentage of CEUS unperfused area (r = 0.446,p = 0.038). Spearman rank correlation coefficient analysis indicated that vascular endothelial growth factor (VEGF) was correlated with PI (r = 0.462, P = 0.032). Welch t test indicated PI, AWI and AWO parameters were significantly lower than that of kidneys (p<0.001, p = 0.009, p = 0.005).
Conclusions
The CEUS parameters PI, AWI and AWO indirectly reflect the MVD and the tumor volume in our model of subcutaneous transplanted NPC in nude mice, providing precious information on angiogenesis and tumor growth. VEGF may play a role in promoting angiogenesis of NPC.
Introduction
Nasopharyngeal carcinoma (NPC) is a common type of cancer in south of China, especially in the Guangxi province[1]. It has an unbalanced geographical distribution, and nearly 80% of new NPC cases in 2008 were in Asia and only 5% were in Europe[2]. NPC is a malignant tumor originating from the epithelium of the nasopharynx, and the lack of early stage obvious symptoms makes it hard to diagnose. The majority of NPC patients are diagnosed only at the advanced stage and the five year survival rate is 50%-60%[3].
Radiation therapy (RT) has been the primary treatment for NPC and Intensity-Modulated Radiotherapy (IMRT) is the preferred standard of care in non-metastatic NPC[4]. IMRT combined with concurrent chemotherapy or neoadjuvant-concurrent chemoradiotherapy has been proven to improve relapse-free survival and disease-free survival of NPC[5]. In recent years, RT combined with anti-angiogenic treatment has been used in clinical trials and considered a promising model for NPC treatment[6, 7].
Angiogenesis is a complex process involving endothelial cell division and migration leading to the formation of new capillaries, and is crucial to tumor growth. The new capillaries in tumors are thin-walled and leaky, exhibiting increased permeability, arteriovenous shunting, chaotic flow patterns, and fragility[8, 9]. In addition, new capillaries in tumors often present with either collapsed or blind ended sacs so that they are inefficient in carrying blood flow. Thus, tumors are often hypoxic and nutrient supply is poor, resulting in necrosis areas[10]. At the molecular level, pro-angiogenic proteins such as vascular endothelial growth factor (VEGF) can be upregulated under hypoxic conditions to promote tumor angiogenesis[11]. Microvasculature density (MVD) has been used to measure angiogenesis in tumors. Endothelial markers such as CD34 and CD31 can highlight microvessels to enable microvessel counting [12].
At present, the imaging examination of NPC mainly includes computer tomography (CT), F-fluorodeoxyglucose (FDG) positron emission tomography (PET)/CT and magnetic resonance imaging (MRI) [13, 14]. Some previous studies indicated that ultrasonography was a useful tool for diagnosing NPC and for defining the relationship between a tumor and the parapharyngeal space[15, 16], however, conventional ultrasound (US) of NPC still has some limitations. Conventional US can only provide morphological information of tumors, but it can't show tumor angiogenesis. Besides, it is not easy to diagnose whether NPC is invading bone and intracranial and paranasal sinus by conventional US[15]. Conventional Doppler imaging like color Doppler or power Doppler is not sensitive enough to study the microvasculature of tumors because blood flow is too slow[17]. Besides, Conventional Doppler imaging is limited by factors such as detection depth and angle and blood flow velocity, and therefore early diagnosis is difficult and often cannot truly reflect the internal conditions of lesions.
Contrast-enhanced ultrasound (CEUS) has been shown to be a practical method of detecting the features of tumor angiogenesis in many studies, some of which investigated the correlation between CEUS parameters and MVD or VEGF expression to assess tumor angiogenesis[18, 19]. CEUS has the ability to gather micro-vascular information in various organs, which increases the accuracy of tumor diagnosis[17, 20–24]. So far, there have been reports of CEUS in the diagnosis of lymph node metastasis of NPC [1]. However, CEUS has not until now been used in the diagnosis of primary NPC. We have no knowledge of the CEUS imaging characteristics of primary NPC angiogenesis. Thus, the present study was performed to explore the CEUS imaging blood perfusion characteristics to assess angiogenesis and tumor growth of human NPC CNE-2 cells transplanted tumors in nude mice.
Materials and methods
Cell culture
Human NPC CNE-2 cells were bought from Shanghai Zhong Qiao Xin Zhou Biotechnology Co., Ltd. and cultured in complete Dulbecco's Modified Eagle Medium (DMEM, Gibco, Thermo Fisher Scientific) supplemented with 10% fetal bovine serum at 37°C and 5% CO2, in a humid environment.
Animal tumor model
A total of 24 five-week-old male BALB/c nude mice weighing 18–25g were obtained from Experimental Animal Center of Guangxi Medical University (Guangxi, China). The nude mice were fed under the Specific Pathogen Free (SPF), 24–26°C constant temperature environment. The cage equipment, bedding, drinking water and feed were disinfected and sterilized. CNE-2 cells (1 × 10⁷/mL) were suspended in 0.2 ml of phosphate buffer saline solution (PBS, 0.01 M, pH = 7.4), then subcutaneously injected into the back of each nude mouse to establish a mouse model of nasopharyngeal tumor. The nude mice were randomly divided into three groups (group A, group B and group C), 8 mice in each group. CEUS evaluations of the tumors were performed after implantation (group A: at 4th week; group B: at 6th week; group C: at 8th week). All animal experiments and procedures for animal experimental protocols were approved by the animal care and use committee of Guangxi Medical University under the guidelines of the National Institutes of Health for the care of laboratory animals.
US examinations
For the US imaging studies, each mouse was anesthetized by inhalation of isoflurane (2% induction and 1.5% maintenance).US images of tumors were obtained on anesthetized animals using an Aplio 500 (Toshiba Medical Systems, Tokyo, Japan)US equipment associated with a 14L5 linear array transducer (5–14 MHz), mechanical index: 0.07, dynamic range: 65 dB. Settings were adjusted at the beginning and maintained constant during the experiments.
Conventional US and Color Doppler were performed on all tumors before the contrast-enhanced study. US parameters including the greatest longitudinal diameter, maximum transverse diameter and depth of tumors were measured in gray-scale imaging. Tumor volume was calculated using the formula[25]: volume = π/ 6 × length × width × depth.
US contrast agent SonoVue (Bracco, Italy) was used for CEUS imaging. It was dissolved with physiologic saline to 5 ml and was intravenously injected as a bolus (0.1 ml/20 g) via the caudal vein of nude mice[25]. Images were acquired and stored in real time. The bolus injection was performed by the same operator to minimize variations in the injection rate.
Image analysis
Time-intensity curves (TIC) were extracted from the images and analyzed using the quantitative analysis software CHI-Q (Toshiba, Japan). A circular region of interest (ROI with a 2-mm radius) was selected inside the perfused region of the tumor. A similar ROI was drawn in the kidney of the nude mice as a reference. The percentage of unperfused area was estimated by software Image J (National Institutes of Health, USA). The following quantitative CEUS parameters were extracted from the TIC calculated in the ROI: (1) peak intensity (PI), (2) time to peak (TTP), (3) mean transit time (MTT), (4) area wash in (AWI), (5) area wash out (AWO). The parameters of the tumor were divided the parameters by the ones obtained in the kidney to normalize (PI tumor/PI kidney, TTP tumor/TTP kidney, MTT tumor/MTT kidney, AWI tumor/AWI kidney, AWO tumor/AWO kidney). The images were analyzed and agreed upon by two experienced sonographers.
Immunohistochemical analysis
After CEUS imaging measurement for each group, nude mice were euthanized by CO2 overdose, the tumors were quickly extracted and fixed in 10% formalin. The tumor tissues were dehydrated and paraffin embedded, sliced, and were hematoxylin and eosin (H&E) stained or used for immunohistochemical staining. A Rabbit anti-mouse CD34 antibody (Abcam, UK), and an anti-VEGF antibody (Abcam, UK) were the primary antibodies used in immunohistochemistry. Polymer helper and polyperoxidase-anti-rabbit IgG were from Zhongshan Goldenbridge Biology, Beijing, China and diaminobenzidine (DAB) was used for color development. Immunohistochemical staining was performed according to the standard procedures.
CD34 was the staining used for MVD estimation. Tumor MVD was measured according to an established method by Weidner et al[26]. Areas of tumor were examined by light microscopy to locate brown stained microvessels. Firstly, three areas of the highest neovascularization (hot spots) were found by scanning the tumor sections at low power (100 X total magnification). Secondly, the numbers of individual brown-stained cells were counted at high power (200 X total magnification) for MVD, regardless of whether the microvessel cavity was formed or not. Finally, the mean value of the microvessels in the three hot spots was the result of MVD for the slice.
Concerning the method of evaluating VEGF expression, three areas of cytoplasmic and membrane brown stained positive cell dense were found at low power (100X), then transferred to high power (200X). Sections of VEGF stained were scored semi-quantitatively for immunoreaction as follows: 0: 0% of immunoreactive cells; 1: <25% of immunoreactive cells; 2: 25–50% of immunoreactive cells; and 3: >50% of immunoreactive cells. Also, intensity of staining was scored semi-qualitatively as follows: 0: negative; 1: weak; 2: intermediate; and 3: strong. The score of each area was the sum of both parameters, the final score was defined as the mean value of the three areas. Immunohistochemical evaluation was performed blindly by two independent observers.
Statistical analysis
All the data were analyzed by R version 3.4.4 software. One-way anova was used to analyze the significant differences among the three groups with the parameters and the tumor volume. Pearson correlation coefficient was used to analyze the correlation between CEUS parameters and MVD and tumor volume; also the correlation between the percentage of necrosis in histology and the percentage of unperfused area established by CEUS. Spearman rank correlation coefficient was used to analyze the correlation between VEGF and CEUS parameters and MVD. Welch t test was used to analyze the significant differences of CEUS parameters between tumors and kidneys of mice. Values are expressed as mean ± standard deviation (SD). P < 0.05 was considered statistically significant.
Results
Pathological features of NPC
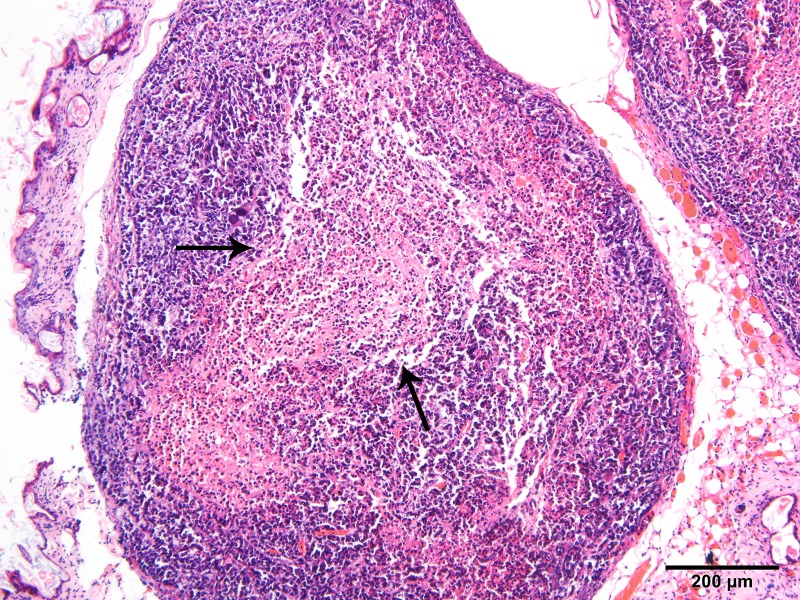
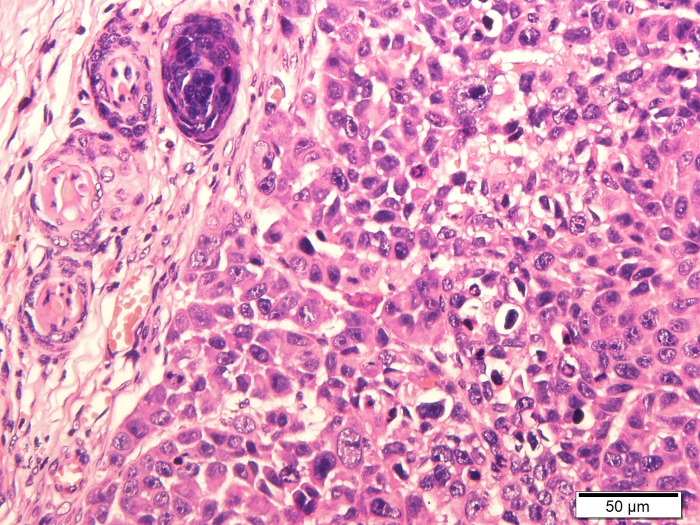
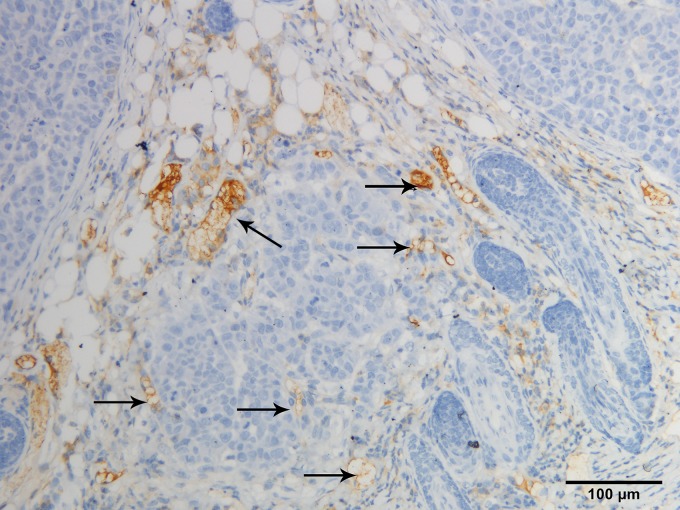
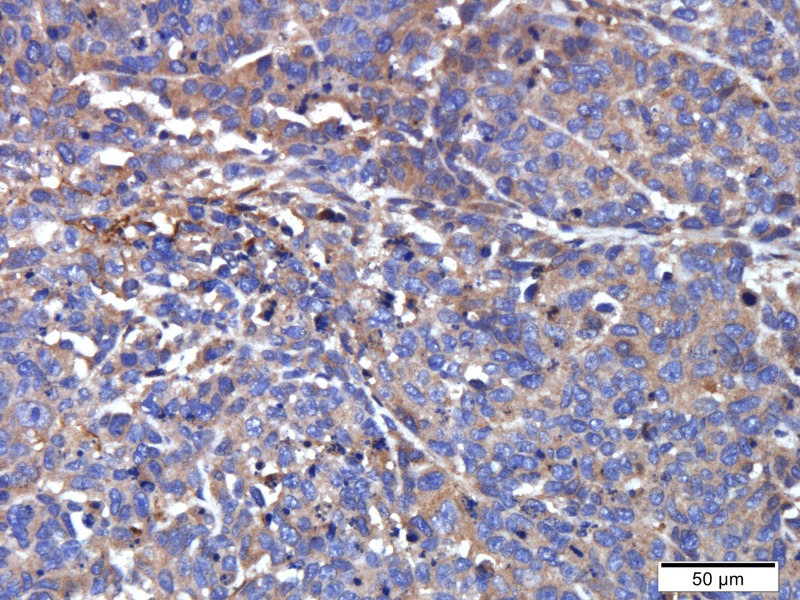
Tumor specimens were pale and soft. HE staining showed necrosis in the center of some tumors (Fig 1). The central cells of the tumor had obvious heteromorphism, disordered arrangement, large deep staining of nuclei and common nuclear fission images (Fig 2). CD34 staining showed that vascular endothelial cells were brownish yellow stained, which were most frequent at the margins of the tumor or invasive periphery (Fig 3). VEGF staining showed brown staining of cytoplasm or cell membranes (Fig 4). Comparing with necrosis seen on H&E, CD34 staining and VEGF staining positive expressions were mostly distributed in non-necrotic areas of the tumor. This indicated that the effective blood supply of neovascularized tumor was mainly distributed at the periphery of the tumor. There was no correlation between MVD and VEGF (r = 0.327, p = 0.138).
Fig 1. HE staining of NPC (100X).
Black arrows designate necrotic areas in the center of the tumor. The periphery of the tumor are nasopharyngeal carcinoma cells.
Fig 2. HE staining of NPC (400X).
Fig 3. All microvessels were strongly labeled by CD34 (200X).
Black arrows designate endothelial cells.
Fig 4. Immunohistochemical staining of the tumor tissues with the anti-VEGF antibody (400X).
Conventional US detection of NPC
The tumors presented round or oval shapes with clear boundaries around a hypo-echoic mass. The internal echo pattern was inhomogeneous (Fig 5). Color Doppler flow imaging (CDFI) showed that the blood flow of NPC lesions was not abundant, there was only sparse blood flow appearing around or inside the lesions. (Fig 6).
Fig 5. B-mode US detection of NPC.
The tumor was indicated with the letter “M”.
Fig 6. Color Doppler detection of NPC.
CEUS features
Two mice in group C could not be injected with SonoVue through the caudal vein, and therefore a total of 22 cases of successful CEUS data were recorded.
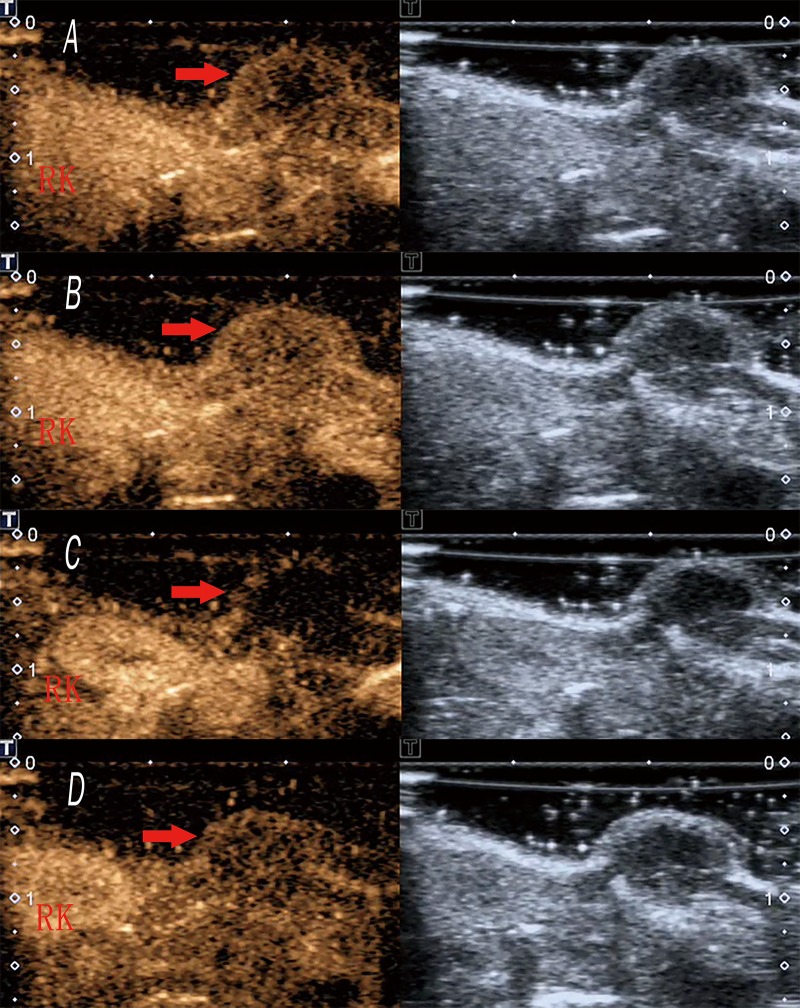
CEUS showed rapid peripheral annular enhancement in the early stage of subcutaneous transplantation NPC tumor in nude mice (Fig 7A). The peripheral portion of the tumor showed perfusion with heterogeneous enhancement firstly, then the contrast agent gradually perfused into the interior of the tumor and the degree of enhancement was weaker than that of the peripheral part of the tumor (Fig 7B). However, the beginning of the contrast enhancement came later in tumors than in the adjacent kidney (Fig 7C). In addition, the contrast agent began to recede in tumors earlier than that in the kidney (Fig 7D).
Fig 7. CEUS features of NPC.
(A) Rapid peripheral annular enhancement in the early stage of NPC in nude mice (NPC is indicated with an arrow). (B) The interior portion of the NPC periphery showed perfusion with heterogeneous enhancement (NPC is indicated with an arrow). (C) The beginning of the contrast enhancement came later in tumors than in the adjacent kidney (indicated with the letter “RK”)of nude mice(NPC is indicated with an arrow). (D) The contrast agent began to recede in tumors earlier than that in the kidney (indicated with the letter “RK”) of the nude mice (NPC is indicated with an arrow).
Parametric perfusion images evaluation
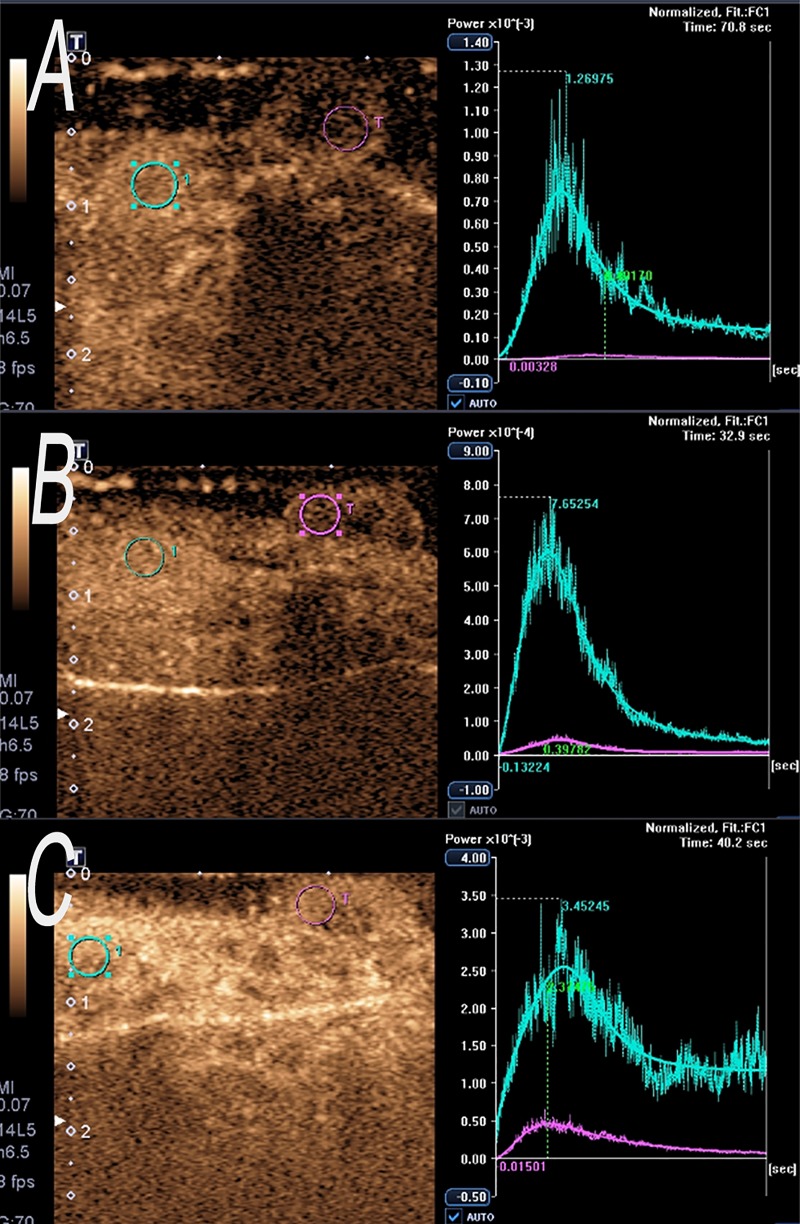
The value of the CEUS parameters was extracted from the TIC for the three groups (Fig 8A–8C).The mean CEUS perfusion parameters of NPC in the three groups were summarized in Table 1. We used a logarithmic transformation to make the data satisfy the normal requirement. The transformed data was used in an Anova test. PI was significantly higher for group C (15.62±5.68) than for group A (2.29±0.96) (P < 0.001) and group B (9.14±1.68) (p = 0.003). PI for group A was significantly lower than for group B (p<0.001).
Fig 8. Time-intensity curve of CEUS.
(A) One example of the TICs extracted from the tumor and kidney ROIs for the group A. (B) One example of the TICs extracted from the tumor and kidney ROIs for the group B.(C) One example of the TICs extracted from the tumor and kidney ROIs for the group C.
Table 1. The CEUS perfusion parameters and immunohistochemical analysis results of NPC in the Three groups.
| Group A (mean±SD) |
Group B (mean±SD) |
Group C (mean±SD) |
|
|---|---|---|---|
| PI (10E-5AU) | 2±1 | 9±2 | 16±6 |
| TTP (S) | 29±6 | 43±20 | 41±23 |
| MTT (s) | 50±13 | 71±39 | 93±53 |
| AWI (10E-5AU·s) | 42±21 | 245±137 | 337±146 |
| AWO (10E-5AU·s) | 104±46 | 432±275 | 964±181 |
| MVD | 7±1 | 10±2 | 11±2 |
| VEGF | 2±1 | 3±2 | 4±1 |
AWI was significantly higher for group C (336.75±145.63) than for group A (41.80±21.24) (P < 0.001). AWI for group B (244.95±136.68) was significantly higher than for group A (p = 0.005). There was no significant difference assigned to the AWI parameter between group B and group C (p = 0.308).
AWO was significantly higher for group C (963.78±181.49) than for group A (103.73±46.34) (P < 0.001) and group B (431.84±275.21) (p<0.001). AWO for group B was significantly higher than for group A(p = 0.008).
Tumor volume evaluation
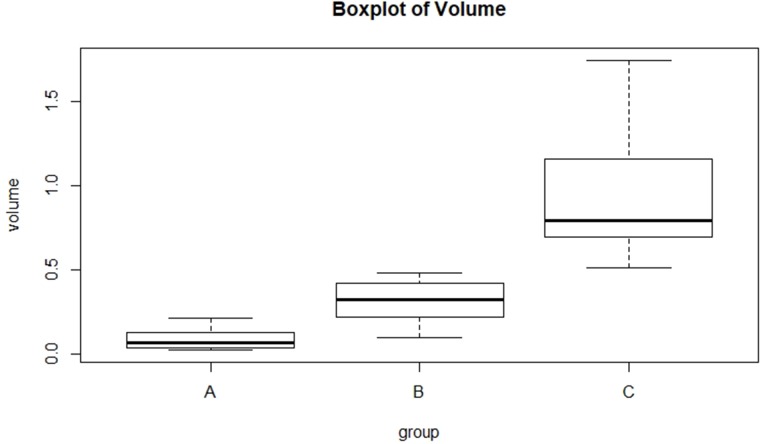
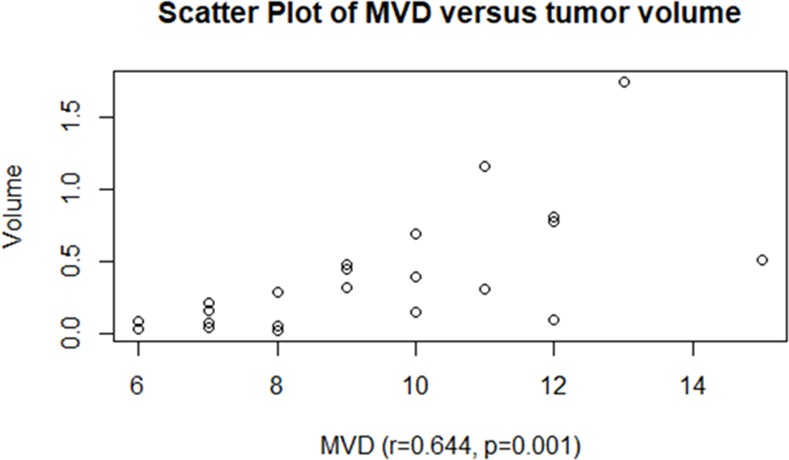
The tumor volume was significantly larger for group C (8 weeks, 0.95±0.44 cm3) than for group A (4 weeks, 0.09±0.07 cm3) (p<0.001) and group B (6 weeks, 0.31±0.13 cm3) (p<0.001). There was no significant difference between group A and group B (p = 0.190)(Fig 9). The tumor volume was positively correlated with MVD (r = 0.644, p = 0.001)(Fig 10).
Fig 9. Comparion of tumor volume among three groups.
Fig 10. Correlations between MVD and the tumor volume.
Correlation of parametric perfusion images and immunohistochemical finding
Pearson’s r was used to evaluate the relationship between the percentage of necrosis in histology and the percentage of CEUS unperfused area.
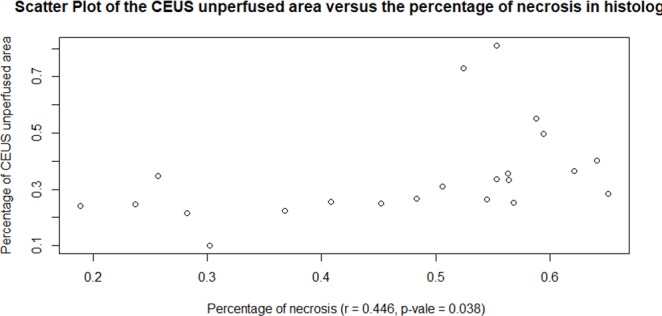
We selected the CEUS image at the moment when the tumor enhancement reached the PI in all the mice to estimate the percentage of unperfused area in the tumor. We compared the size of unperfused area (35% ±17%) measured on CEUS images with the necrosis area (47%±14%) estimated on H&E sections; the percentage of necrosis in histology was correlated with the percentage of CEUS unperfused area (r = 0.446,p = 0.038)(Fig 11).
Fig 11. Correlations between the CEUS unperfused area and the percentage of necrosis by histology.
We made the immunohistochemistry analysis in a similar region to the ROI where we quantified CEUS parameters. The relationship between MVD and CEUS parameters was measured by Person’s r, since MVD was a continuous variable. The relationship between VEGF and CEUS parameters was measured by Spearman’s r, since VEFG was ordinal variable. The parameter of PI was positively correlated with MVD (r = 0.904, p<0.0001) and VEGF (r = 0.462, P = 0.032); AWI was positively correlated with MVD (r = 0.547, p = 0.008); AWO was positively correlated with MVD (r = 0.744, P<0.0001) (Tables 2 and 3).
Table 2. Pearson correlation analysis of CEUS perfusion parameters with MVD of NPC.
| MVD | PI | TTP | MTT | AWI | AWO |
|---|---|---|---|---|---|
| Correlation coefficient | 0.904 | 0.145 | 0.239 | 0.547 | 0.744 |
| P-value (2-tailed) | <0.0001 | 0.520 | 0.284 | 0.008 | <0.0001 |
Table 3. Spearman correlation analysis of CEUS perfusion parameters with VEGF.
| VEGF | PI | TTP | MTT | AWI | AWO |
|---|---|---|---|---|---|
| Spearman rho | 0.426 | 0.138 | -0.185 | 0.390 | 0.280 |
| P- value | 0.032 | 0.539 | 0.410 | 0.074 | 0.207 |
Correlation of parametric perfusion images and the tumor volume
Person’s r was used to evaluate the relationship between the tumor volume and CEUS parameters, since the tumor volume was continuous variable. The tumor volume was positively correlated with PI (r = 0.625, p = 0.002), AWI (r = 0.528, p = 0.012) and AWO (r = 0.784, p<0.001).
Comparisons of CEUS perfusion parameters in NPC and kidney
The results of homogeneous variance test and normality test showed that all the variables were non-homogeneous and drawn from non-normal distribution. Therefore, Welch’s test was applied to verify the mean difference of NPC CEUS parameters and Kidney CEUS parameters, since the assumptions of Student’s T test was not satisfied.
PI, AWI and AWO was significantly lower for NPC than for kidney (p<0.001, p = 0.009, p = 0.005) (Table 4).
Table 4. Welch t test of comparisons of CEUS perfusion parameters in NPC and kidney.
| NPC(mean±SD) | Kidney(mean±SD) | P -value | |
|---|---|---|---|
| PI (10E-5AU) | 8±6 | 163±185 | <0.001 |
| TTP (S) | 37±18 | 34±22 | 0.618 |
| MTT (s) | 69±39 | 93±59 | 0.120 |
| AWI (10E-5AU·s) | 196±164 | 2466±3699 | 0.009 |
| AWO(10E-5AU·s) | 458±394 | 9459±13309 | 0.005 |
Discussion
In our study, we explore the CEUS in evaluating angiogenesis and tumor growth in a model of subcutaneous transplanted NPC in nude mice. We found that with the growth of the NPC, some CEUS parameters increased similarly and were correlated with the immunohistochemical results of the NPC.
CEUS features of NPC transplantation tumor
NPC tumors showed rapid highly enhancement in peripheral tissues on CEUS images. However, the center of some tumors showed low to no enhancement. This can be explained by the fact that new capillaries in NPC are mostly present in the periphery of the tumor, while the center of the tumor is poorly supplied. The human NPC CNE-2 cells are prone to necrosis in the core of the tumor in nude mice in subcutaneous transplanted models. The enhancement characteristic of NPC was just consistent with the pathological observation of NPC tissues. Similar enhancement characteristics were reported in a lung peripheral VX2 tumor model in the rabbit.[27]. In comparison to the kinetics seen in the adjacent kidney, the contrast agents arrived later and receded earlier in the NPC. In addition, the intensity of the contrast enhancement in NPC was weaker than that in the kidney of the nude mice.
CEUS evaluation of angiogenesis and tumor perfusion in NPC
Tumor angiogenesis is an essential step in tumor growth and metastasis[28], and several studies have shown that alteration in MVD of NPC is associated with tumor growth [29, 30].
In the present study, CEUS was performed in mice of three groups (A, B and C) at 4, 6 and 8 weeks after tumor transplantation, respectively. PI, AWI and AWO were significantly higher for 6 week tumors than for 4 week tumors. PI and AWO were significantly higher for 8 week tumors than for 6 week tumors and there was no significant difference assigned to the AWI parameter between 8 week and 6 week tumors. Parameters PI, AWI and AWO are related to blood volume and they can measure the perfusion of the micro-vasculature of a tumor [31]. In our study, PI, AWI and AWO gradually increased over time along with MVD, reflecting an increase in blood volume in the tumor resulting from neovascularization. This suggests that subcutaneous transplantation of NPC in nude mice is a vascular dependent tumor and we can infer on the density of micro-vessels in NPC using CEUS.
Since CEUS parameters could not be extracted from the tumor core due to low perfusion, a comparison between core tumor and peripheral tumor was not possible for statistical analysis. However, we compared the size of unperfused area measured on CEUS images with the necrosis area estimated on H&E slices, and the percentage of necrosis in histology was correlated with the percentage of CEUS unperfused area. In other words, CEUS was able to detect necrotic areas in the NPC. Although we made the immunohistochemistry analysis within a similar region to the ROI where we quantified CEUS parameters, there was still inherent limitation of comparison between in-vitro immunohistochemistry with 2D in-vivo imaging. In order to evaluate the tumor perfusion, the US probe is fixed on the plane with the largest tumor dimension for CEUS examination. CEUS could only display the enhanced image of a certain section of the tumor, but could not completely display the three-dimensional structure of tumor trophoblastic vessels. So, CEUS imaging might not be completely consistent with the pathological result of the slice.
To date, there have been many studies showing that anti-angiogenic therapy might be a good approach for the treatment of NPC[32–36]. These studies found that central tumor necrosis and consequential shrinkage of tumor volume occurred and tumor MVD decreased with anti-angiogenic therapy which remarkably suppressed the growth of NPC. Therefore, the combination of RT and anti-angiogenic therapy might enhance the efficacy of the antitumor effect on NPC. Our study demonstrates that CEUS can indirectly indicate angiogenesis in NPC. By comparison of parametric images of PI, AWI and AWO before and after anti-angiogenic therapy, we speculate that CEUS can play an important role in evaluating the efficacy of anti-angiogenic therapy of NPC.
Evolution of CEUS parameters according to tumor growth
With the growth of the tumor, the oxygen and nutrients supply of the tumor mainly comes from the neovascularization. The increased neo-vascular supply gradually increases tumor volume and can facilitate tumor metastasis[11]. In our study, NPC tumor volume was significantly larger for group C (8 weeks) than for group A (4 weeks) and group B (6 weeks), indicating that the tumor volume was gradually increasing. Meanwhile, the mean perfusion showed a similar increase. Some studies investigated the influence of angiogenesis on tumor growth by comparing the tumor microvasculature change after anti-angiogenic treatment, using CEUS imaging[31, 37]. In the present study, we also found a positive correlation between tumor volume and MVD in NPC. These results mean that we can evaluate the different growth period and the blood supply of NPC through the changes of CEUS parameters. What's more, CEUS can help to define tumor boundaries more precisely, so it will be another great method to evaluate tumor metastasis and the changes of tumor morphology of NPC after RT and chemotherapy.
The correlation between tumor perfusion and VEGF
VEGF has been revealed to be one of the critical factors for tumor growth and angiogenesis which may lead to metastasis[28]. As far as we know, there have been some studies indicating that CEUS parameters were correlated with the expression of VEGF in patients with malignant tumors[38, 39]. In addition, some studies found that the MVD was positively correlated with VEGF in the NPC[40, 41].
In our study, although we did not find any correlation between VEGF and MVD in NPC, CD34 staining and VEGF positive staining were both mostly distributed at the margins of the NPC or at invasive periphery, which matched the CEUS perfusion characteristic of the NPC. Meanwhile, VEGF and MVD were positively correlated with PI. As a result, PI can reflect angiogenesis in NPC and VEGF may play a role in promoting angiogenesis of NPC.
Conclusion
In conclusion, our study demonstrates that the CEUS is able to detect necrotic areas in NPC. The CEUS parameters PI, AWI and AWO indirectly reflect the MVD and the tumor volume in our model of NPC subcutaneous transplanted nude mice, providing precious information on angiogenesis and tumor growth. VEGF may play a role in promoting angiogenesis of NPC. CEUS can become an effective tool for the clinical characterization of NPC in the future.
Supporting information
Black arrows designate necrotic areas in the center of the tumor.
(TIF)
Black arrows designate necrotic areas in the center of the tumor.
(TIF)
(PDF)
Acknowledgments
We would like to thank YuShan Liang for her assistance in the establishment of tumor model in nude mice.
Data Availability
All relevant data are within the manuscript and its Supporting Information files.
Funding Statement
This work was supported by the National Natural Science Foundation of China, grant number: 81560288, http://www.nsfc.gov.cn/, to SYZ. The funders had no role in study design, data collection and analysis, decision to publish, or preparation of the manuscript.
References
- 1.Ye Z, Huang P, Zhou X, Huang Q, Hu Q, Shui Y, et al. Parametric contrast-enhanced ultrasound as an early predictor of radiation-based therapeutic response for lymph node metastases of nasopharyngeal carcinoma. Mol Clin Oncol. 2014;2(5):666–72. 10.3892/mco.2014.331 [DOI] [PMC free article] [PubMed] [Google Scholar]
- 2.Zhou J, Zhang J, Xu M, Ke Z, Zhang W, Mai J. High SRC-1 and Twist1 expression predicts poor prognosis and promotes migration and invasion by inducing epithelial-mesenchymal transition in human nasopharyngeal carcinoma. PLoS One. 2019;14(4):e215299. [DOI] [PMC free article] [PubMed] [Google Scholar]
- 3.Wang D, Luo H, Huo Z, Chen M, Han Z, Hung M, et al. Irradiation-induced dynamic changes of gene signatures reveal gain of metastatic ability in nasopharyngeal carcinoma. Am J Cancer Res. 2019;9(3):479–95. [PMC free article] [PubMed] [Google Scholar]
- 4.Wu S, Xia B, Han F, Xie R, Song T, Lu L, et al. Prognostic Nomogram for Patients with Nasopharyngeal Carcinoma after Intensity-Modulated Radiotherapy. PLoS One. 2015;10(8):e134491. [DOI] [PMC free article] [PubMed] [Google Scholar]
- 5.Ji X, Xie C, Hu D, Fan X, Zhou Y, Zheng Y. Survival benefit of adding chemotherapy to intensity modulated radiation in patients with locoregionally advanced nasopharyngeal carcinoma. PLoS One. 2013;8(2):e56208 10.1371/journal.pone.0056208 [DOI] [PMC free article] [PubMed] [Google Scholar]
- 6.Argiris A, Kotsakis AP, Hoang T, Worden FP, Savvides P, Gibson MK, et al. Cetuximab and bevacizumab: preclinical data and phase II trial in recurrent or metastatic squamous cell carcinoma of the head and neck. Ann Oncol. 2013;24(1):220–5. 10.1093/annonc/mds245 [DOI] [PMC free article] [PubMed] [Google Scholar]
- 7.Lee NY, Zhang Q, Pfister DG, Kim J, Garden AS, Mechalakos J, et al. Addition of bevacizumab to standard chemoradiation for locoregionally advanced nasopharyngeal carcinoma (RTOG 0615): a phase 2 multi-institutional trial. Lancet Oncol. 2012;13(2):172–80. 10.1016/S1470-2045(11)70303-5 [DOI] [PMC free article] [PubMed] [Google Scholar]
- 8.Russo G, Mischi M, Scheepens W, De la Rosette JJ, Wijkstra H. Angiogenesis in prostate cancer: onset, progression and imaging. Bju Int. 2012;110(11 Pt C):E794–808. [DOI] [PubMed] [Google Scholar]
- 9.Mischi M, Kuenen MP, Wijkstra H. Angiogenesis imaging by spatiotemporal analysis of ultrasound contrast agent dispersion kinetics. IEEE Trans Ultrason Ferroelectr Freq Control. 2012;59(4):621–9. 10.1109/TUFFC.2012.2241 [DOI] [PubMed] [Google Scholar]
- 10.Scott PA, Harris AL. Current approaches to targeting cancer using antiangiogenesis therapies. Cancer Treat Rev. 1994;20(4):393–412. [DOI] [PubMed] [Google Scholar]
- 11.Turco S, Wijkstra H, Mischi M. Mathematical Models of Contrast Transport Kinetics for Cancer Diagnostic Imaging: A Review. IEEE Rev Biomed Eng. 2016;9:121–47. 10.1109/RBME.2016.2583541 [DOI] [PubMed] [Google Scholar]
- 12.Weidner N. Chapter 14. Measuring intratumoral microvessel density. Methods Enzymol. 2008;444:305–23. 10.1016/S0076-6879(08)02814-0 [DOI] [PubMed] [Google Scholar]
- 13.Vellayappan BA, Soon YY, Earnest A, Zhang Q, Koh WY, Tham IW, et al. Accuracy of (18)F-flurodeoxyglucose-positron emission tomography/computed tomography in the staging of newly diagnosed nasopharyngeal carcinoma: a systematic review and meta-analysis. Radiol Oncol. 2014;48(4):331–8. 10.2478/raon-2014-0011 [DOI] [PMC free article] [PubMed] [Google Scholar]
- 14.Jiang F, Jin T, Feng XL, Jin QF, Chen XZ. Long-term outcomes and failure patterns of patients with nasopharyngeal carcinoma staged by magnetic resonance imaging in intensity-modulated radiotherapy era: The Zhejiang Cancer Hospital's experience. J Cancer Res Ther. 2015;11 Suppl 2:C179–84. [DOI] [PubMed] [Google Scholar]
- 15.Gao Y, Liu JJ, Zhu SY, Yi X. The diagnostic accuracy of ultrasonography versus endoscopy for primary nasopharyngeal carcinoma. PLoS One. 2014;9(6):e99679 10.1371/journal.pone.0099679 [DOI] [PMC free article] [PubMed] [Google Scholar]
- 16.Gao Y, Zhu SY, Dai Y, Lu BF, Lu L. Diagnostic accuracy of sonography versus magnetic resonance imaging for primary nasopharyngeal carcinoma. J Ultrasound Med. 2014;33(5):827–34. 10.7863/ultra.33.5.827 [DOI] [PubMed] [Google Scholar]
- 17.Ko EY, Lee SH, Kim HH, Kim SM, Shin MJ, Kim N, et al. Evaluation of tumor angiogenesis with a second-generation US contrast medium in a rat breast tumor model. Korean J Radiol. 2008;9(3):243–9. 10.3348/kjr.2008.9.3.243 [DOI] [PMC free article] [PubMed] [Google Scholar]
- 18.Guo S, Xu P, Zhou A, Wang G, Chen W, Mei J, et al. Contrast-Enhanced Ultrasound Differentiation Between Low- and High- Grade Bladder Urothelial Carcinoma and Correlation With Tumor Microvessel Density. J Ultrasound Med. 2017;36(11):2287–97. 10.1002/jum.14262 [DOI] [PubMed] [Google Scholar]
- 19.Liu H, Jiang Y, Dai Q, Zhu Q, Wang L, Lu J. Peripheral enhancement of breast cancers on contrast-enhanced ultrasound: correlation with microvessel density and vascular endothelial growth factor expression. Ultrasound Med Biol. 2014;40(2):293–9. 10.1016/j.ultrasmedbio.2013.10.004 [DOI] [PubMed] [Google Scholar]
- 20.Saracco A, Szabo BK, Tanczos E, Bergh J, Hatschek T. Contrast-enhanced ultrasound (CEUS) in assessing early response among patients with invasive breast cancer undergoing neoadjuvant chemotherapy. Acta Radiol. 2017;58(4):394–402. 10.1177/0284185116658322 [DOI] [PubMed] [Google Scholar]
- 21.Dietrich CF, Averkiou M, Nielsen MB, Barr RG, Burns PN, Calliada F, et al. How to perform Contrast-Enhanced Ultrasound (CEUS). Ultrasound Int Open. 2018;4(1):E2–15. 10.1055/s-0043-123931 [DOI] [PMC free article] [PubMed] [Google Scholar]
- 22.Laugesen NG, Nolsoe CP, Rosenberg J. Clinical Applications of Contrast-Enhanced Ultrasound in the Pediatric Work-Up of Focal Liver Lesions and Blunt Abdominal Trauma: A Systematic Review. Ultrasound Int Open. 2017;3(1):E2–7. 10.1055/s-0042-124502 [DOI] [PMC free article] [PubMed] [Google Scholar]
- 23.Shi W, He Y, Ding W, Gong S, Wang Y, Xiao J, et al. Contrast-enhanced ultrasonography used for post-treatment responses evaluation of radiofrequency ablations for hepatocellular carcinoma: a meta-analysis. Br J Radiol. 2016;89(1064):20150973 10.1259/bjr.20150973 [DOI] [PMC free article] [PubMed] [Google Scholar]
- 24.Xie XH, Xu HX, Xie XY, Lu MD, Kuang M, Xu ZF, et al. Differential diagnosis between benign and malignant gallbladder diseases with real-time contrast-enhanced ultrasound. Eur Radiol. 2010;20(1):239–48. 10.1007/s00330-009-1538-8 [DOI] [PubMed] [Google Scholar]
- 25.Zhou JH, Zheng W, Cao LH, Liu M, Luo RZ, Han F, et al. Contrast-enhanced ultrasonic parametric perfusion imaging in the evaluation of antiangiogenic tumor treatment. Eur J Radiol. 2012;81(6):1360–5. 10.1016/j.ejrad.2011.01.099 [DOI] [PubMed] [Google Scholar]
- 26.Weidner N, Semple JP, Welch WR, Folkman J. Tumor angiogenesis and metastasis—correlation in invasive breast carcinoma. N Engl J Med. 1991;324(1):1–8. 10.1056/NEJM199101033240101 [DOI] [PubMed] [Google Scholar]
- 27.Xing J, He W, Ding YW, Li Y, Li YD. Correlation between Contrast-Enhanced Ultrasound and Microvessel Density via CD31 and CD34 in a rabbit VX2 lung peripheral tumor model. Med Ultrason. 2018;1(1):37–42. 10.11152/mu-1234 [DOI] [PubMed] [Google Scholar]
- 28.Qian CN, Tan MH, Yang JP, Cao Y. Revisiting tumor angiogenesis: vessel co-option, vessel remodeling, and cancer cell-derived vasculature formation. Chin J Cancer. 2016;35:10 10.1186/s40880-015-0070-2 [DOI] [PMC free article] [PubMed] [Google Scholar]
- 29.Qian CN, Min HQ, Liang XM, Zheng SS, Lin HL. Primary study of neovasculature correlating with metastatic nasopharyngeal carcinoma using computer image analysis. J Cancer Res Clin Oncol. 1997;123(11–12):645–51. [DOI] [PubMed] [Google Scholar]
- 30.Soo RA, Wu J, Aggarwal A, Tao Q, Hsieh W, Putti T, et al. Celecoxib reduces microvessel density in patients treated with nasopharyngeal carcinoma and induces changes in gene expression. Ann Oncol. 2006;17(11):1625–30. 10.1093/annonc/mdl283 [DOI] [PubMed] [Google Scholar]
- 31.Dizeux A, Payen T, Le Guillou-Buffello D, Comperat E, Gennisson JL, Tanter M, et al. In Vivo Multiparametric Ultrasound Imaging of Structural and Functional Tumor Modifications during Therapy. Ultrasound Med Biol. 2017;43(9):2000–12. 10.1016/j.ultrasmedbio.2017.03.021 [DOI] [PubMed] [Google Scholar]
- 32.Qian CN, Min HQ, Lin HL, Hong MH, Ye YL. Primary study in experimental antiangiogenic therapy of nasopharyngeal carcinoma with AGM-1470 (TNP-470). J Laryngol Otol. 1998;112(9):849–53. 10.1017/s0022215100141878 [DOI] [PubMed] [Google Scholar]
- 33.Qian CN, Min HQ, Lin HL, Feng GK, Ye YL, Wang LG, et al. Anti-tumor effect of angiogenesis inhibitor TNP-470 on the human nasopharyngeal carcinoma cell line NPC/HK1. Oncology-Basel. 1999;57(1):36–41. [DOI] [PubMed] [Google Scholar]
- 34.Xu Z, Fang S, Zuo Y, Zhang Y, Cheng R, Wang Q, et al. Combination of pigment epithelium-derived factor with radiotherapy enhances the antitumor effects on nasopharyngeal carcinoma by downregulating vascular endothelial growth factor expression and angiogenesis. Cancer Sci. 2011;102(10):1789–98. 10.1111/j.1349-7006.2011.02013.x [DOI] [PubMed] [Google Scholar]
- 35.Chen Z, Xu XH. Combining antiangiogenic therapy and radiation in nasopharyngeal carcinoma. Saudi Med J. 2015;36(6):659–64. 10.15537/smj.2015.6.11460 [DOI] [PMC free article] [PubMed] [Google Scholar]
- 36.Cui Y, Liu H, Liang S, Zhang C, Cheng W, Hai W, et al. The feasibility of 18F-AlF-NOTA-PRGD2 PET/CT for monitoring early response of Endostar antiangiogenic therapy in human nasopharyngeal carcinoma xenograft model compared with 18F-FDG. Oncotarget. 2016;7(19):27243–54. 10.18632/oncotarget.8402 [DOI] [PMC free article] [PubMed] [Google Scholar]
- 37.Zhou J, Zhang H, Wang H, Lutz AM, El KA, Tian L, et al. Early prediction of tumor response to bevacizumab treatment in murine colon cancer models using three-dimensional dynamic contrast-enhanced ultrasound imaging. Angiogenesis. 2017;20(4):547–55. 10.1007/s10456-017-9566-5 [DOI] [PMC free article] [PubMed] [Google Scholar]
- 38.Li Y, Wei X, Zhang S, Zhang J. Prognosis of invasive breast cancer after adjuvant therapy evaluated with VEGF microvessel density and microvascular imaging. Tumour Biol. 2015;36(11):8755–60. 10.1007/s13277-015-3610-0 [DOI] [PubMed] [Google Scholar]
- 39.Xuan ZD, Zhou L, Wang Y, Zheng X. Prognostic value of the combination of serum levels of vascular endothelial growth factor, C-reactive protein and contrast-enhanced ultrasound in patients with primary liver cancer who underwent transcatheter arterial chemoembolization. Expert Rev Anticancer Ther. 2017;17(12):1169–78. 10.1080/14737140.2017.1395284 [DOI] [PubMed] [Google Scholar]
- 40.Guang-Wu H, Sunagawa M, Jie-En L, Shimada S, Gang Z, Tokeshi Y, et al. The relationship between microvessel density, the expression of vascular endothelial growth factor (VEGF), and the extension of nasopharyngeal carcinoma. Laryngoscope. 2000;110(12):2066–9. 10.1097/00005537-200012000-00017 [DOI] [PubMed] [Google Scholar]
- 41.Hu Y, E H, Yu X, Li F, Zeng L, Lu Q, et al. Correlation of quantitative parameters of magnetic resonance perfusion-weighted imaging with vascular endothelial growth factor, microvessel density and hypoxia-inducible factor-1alpha in nasopharyngeal carcinoma: Evaluation on radiosensitivity study. Clin Otolaryngol. 2018;43(2):425–33. 10.1111/coa.12982 [DOI] [PubMed] [Google Scholar]
Associated Data
This section collects any data citations, data availability statements, or supplementary materials included in this article.
Supplementary Materials
Black arrows designate necrotic areas in the center of the tumor.
(TIF)
Black arrows designate necrotic areas in the center of the tumor.
(TIF)
(PDF)
Data Availability Statement
All relevant data are within the manuscript and its Supporting Information files.


