Abstract
Purpose
Accumulating evidence suggests that dopamine, the major catecholamine in the vertebrate retina, may modulate cAMP-mediated signaling in photoreceptors to optimize vision in the light/dark cycle. The main putative mechanism of dopamine-induced adaptation changes in photoreceptors is activation of D2-like receptors (D2R), which leads to a decrease of the intracellular cAMP level and reduction of protein kinase A (PKA) activity. However, the mechanisms by which dopamine exerts its regulating effect on the phototransduction cascade remain largely unknown. The aim of the present study was to investigate the effects of dopamine and dopamine receptor agonists on rod photoresponses.
Methods
The experiments were performed on solitary rods of the Rana ridibunda frog. Photoreceptor currents were recorded using a suction pipette technique. The effects of dopamine (0.1–50 µM) and selective dopamine receptor agonists—D1R agonist SKF-38393 (0.1–50 µM), D2R agonist quinpirole (2.5–50 µM), and D1–D2 receptor heterodimer agonist SKF-83959 (50 µM)—were examined.
Results
We found that, when applied to the rod inner segments (RISs), dopamine and dopamine receptor agonists had no effect on photoresponses. In contrast, the rods responded to dopamine and all agonists applied to their outer segments by decreasing sensitivity to light. At the highest tested concentration (50 µM), the most prominent effect on light sensitivity was induced by D1R agonist SKF-38393, while dopamine, D2R agonist quinpirole, and D1–D2 receptor heterodimer agonist SKF-83959 produced somewhat lower and approximately equal effects. Moreover, SKF-38393 reduced sensitivity at all tested concentrations starting from the smallest one (0.1 µM), whereas dopamine and quinpirole started their action from the higher concentrations of 2.5 µM and 50 µM, respectively. In addition, dopamine, SKF-38393, and quinpirole, on average, did not change the intracellular calcium level as judged from the “exchange current”, while SKF-83959 increased it by ~1.3 times.
Conclusions
Dopamine induces a decrease in rod sensitivity, mostly by reducing the activation rate of the cascade, and to a much lesser extent, speeding up the turning off of the cascade. The sign of the reaction to all tested drugs, lack of selectivity of dopamine and dopamine receptor agonist action, and analysis of factors that determine sensitivity of photoreceptors suggest that, in rod outer segments (ROSs), dopamine action is mediated by D1–D2 receptor heterodimers but not D1R or D2R alone. This work supports the assumption made earlier by other authors that dopamine exercises its regulatory effect via at least two independent mechanisms, which are cAMP and Ca2+ mediated.
Introduction
Of all the biogenic amines in the vertebrate retina, dopamine is the primary neurotransmitter and neuromodulator. The source of dopamine in the retina is a unique population of cells identified as either amacrine or interplexiform cells [1]. Although dopaminergic cells comprise a minuscule neuronal population of the retina (<1% of all amacrine cells [2,3]), dopamine spreads widely in the retina, mostly due to extensive lengths and considerable branching of the dopaminergic neurons’ processes.
Based on their ability to modulate cAMP production in target cells, dopamine receptors are divided into two families, the D1- and D2-like families (D1R and D2R, respectively), where their stimulation either increases or decreases production of intracellular cAMP, and correspondingly, up- or downregulates the activity of protein kinase A (PKA) [4-7]. Besides cAMP-mediated signaling, dopamine receptors can utilize other pathways of signal transduction and act on a variety of downstream effectors, including phospholipase C and calcium and potassium channels (reviewed in [8]). Dopamine receptors were found in nearly all retinal cell types, including photoreceptors. Functional and morphological studies suggest that both rods and cones have D2R [9-14], although some authors assume that photoreceptors may also express D1R [15,16]. In rodents, birds, and fish, dopamine receptors on photoreceptor cells belong to the D4R subtype of D2-like receptors [11,17-21].
The activity of dopaminergic cells is under circadian control: it is higher during the daytime and lower at night [22-24]. This periodical variation of dopamine levels, synchronized with natural variation in environmental illumination, provides adaptive changes at all levels of the visual system, primarily in photoreceptors. However, the mechanism by which dopamine exerts its regulating effect on photoreceptors has not been fully defined. In addition to Ca2+ feedback, adaptation to various light environments may include other mediator systems [25,26]. There is accumulating evidence that cAMP is also implicated in regulation of the photoreceptor intracellular signaling, adjusting its efficiency to specific light conditions. cAMP regulates some photoreceptor functions linked to retinal adaptive physiology, such as membrane turnover in rod outer segments [27], cone retinomotor movement [19,28,29], and melatonin synthesis [30-33]. Previously, we showed that pharmacologically induced changes of the cAMP level in isolated rods of Rana ridibunda have a direct effect on the phototransduction cascade [34]. We found that elevation of intracellular cAMP leads to an increase of the absolute sensitivity of the light response in the dark but a decrease of the fractional light response in the light-adapted state.
The main putative mechanism of dopamine-induced changes in photoreceptors for adaptation to the light environment comprises the activation of D2R and decrease in the level of cAMP, which in turn, leads to downregulating PKA activity [35,36]. The available data suggest that the way the dopamine affects the responsiveness of photoreceptors to light is generally consistent with the above scenario. In the dark-adapted state, when the dopamine level in the retina is low, disruption of dopamine production in the retina [37] or disruption of dopamine signaling via subtypes of D2-like receptors [38], D2R [38,39], or D4R [35] does not produce any significant changes in the a-wave of electroretinography (ERG). Under photopic conditions, however, in dopamine-depleted or dopamine signaling–depleted retinas, the magnitude of the a-wave of ERG is decreased compared to that of wild-type animals [35].
In this report, we aimed to investigate whether dopamine downregulates the gain in the phototransduction cascade in rod photoreceptor cells via D2R. We examined the effects of dopamine and dopamine receptor agonists SKF-38393 (selective to D1R), quinpirole (selective to D2R), and SKF-83959 (selective to D1–D2 receptor heterodimers) on the photoresponses of isolated frog rods. We found that, when applied to the rod inner segments, dopamine and dopamine receptor agonists had no effect on the phototransduction cascade. In contrast, rods responded to dopamine and all agonists applied to their outer segments via decreasing sensitivity to light. We conclude that dopamine induces a decrease of rod sensitivity, mostly by reducing the activation rate of the cascade, and to a much lesser extent, speeding up the turning off of the cascade. The sign of a reaction to all tested drugs, lack of selectivity of dopamine and dopamine receptor agonists’ action, and analysis of factors that determine the sensitivity of photoreceptors suggest that dopamine’s action is mediated by D1–D2 receptor heterodimers but not D1R or D2R alone. In agreement with results published previously by other authors, we suggest that dopamine exerts its regulatory effect via at least two independent mechanisms, namely, cAMP and Ca2+ mediation.
Methods
Experimental animals
The study was conducted on isolated rods of the frog Rana ridibunda. Adult animals were caught in the wild in southern Russia. They were kept for up to 6 months at 10–15 °C on a natural day/night cycle; they had free access to water and were fed with mealworms. The animals were treated in accordance with the National Research Council (NRC) Guide for the Care and Use of Laboratory Animals (2011), the Association for Research in Vision and Ophthalmology (ARVO) Statement for the Use of Animals in Ophthalmic and Vision Research (2016), and the protocol approved by local Institutional Animal Care and Use Committee (of Sechenov Institute of Evolutionary Physiology and Biochemistry, Russian Academy of Science).
Preparations and solutions
Prior to the experiment, the animals were dark adapted overnight at room temperature. The animals were killed by decapitation and pithing, and then the eyes were removed under dim red light. Further dissection was carried out under infrared surveillance. Isolated retinas were transferred into a small petri dish filled with basic physiologic solution (Ringer’s solution, the composition see below). Isolated photoreceptors were obtained by shredding the small retinal pieces with two forceps in a drop of Ringer’s solution and further gentle pipetting. The resulting suspension of isolated photoreceptors was placed in a perfusion chamber.
Ringer’s solution was prepared before the experiments and contained (in mM): NaCl 90; KCl 2.5; MgCl2 1.6; CaCl2 1; NaHCO3 5; HEPES 5; Glucose 10, EDTA 0.05 (all reagents Sigma-Aldrich; St. Louis, MO); pH adjusted to 7.6. Ringer’s solution was used for retinal dissection and as the main solution in the perfusion chamber. Drug-containing solutions were Ringer’s solution plus dopamine hydrochloride, quinpirole hydrochloride, SKF-38393 hydrochloride, or SKF-83959 hydrobromide (all drugs Sigma-Aldrich; St. Louis, MO). The concentrations used were 0.1, 2.5, 20, or 50 µM for dopamine- and SKF-38393-containing solutions; 2.5, 20, or 50 µM for quinpirole-containing solution and 50 µM for SKF-83959-containing solution. SKF-83959 was previously dissolved in dimethyl sulfoxide (DMSO) and then diluted with Ringer’s solution to obtain the intended concentration. The final concentration of DMSO was less than 0.1%. The other drugs were directly dissolved in Ringer’s solution at the intended concentrations (gentle warming was needed to completely dissolve SKF-38393). Since dopamine in solution is susceptible to oxidation and decomposition, the dopamine solution was prepared just before cell recordings. Other drug-containing solutions were made up and used on the same day.
Photocurrent recording
The photoreceptor current was recorded using a standard suction pipette recording technique [40]. The details of the suction recording rig have been previously described [34,41]. The rods were sucked into a glass pipette in an “outer segment out” configuration (rod outer segments were exposed to drugs and rod inner segments were in the suction pipette) or “inner segment out” configuration (drugs were applied to rod inner segments while rod outer segments were in the pipette). Changing of the solutions around the rod segments was achieved with a local perfusion system, which allowed quick replacement of the Ringer’s solution with drug-containing solutions. In the control experiments, the rods were placed into a jet of drug-free Ringer’s solution (in experiments with SKF-83959 0.1% DMSO in Ringer’s solution was used as control) to test if the jet of the Ringer’s solution affected the parameters of photoresponses. It took about 35 min to record one cell.
The light stimulation system was based on a high-output light-emitting diode (LED). The stimulus intensity was controlled by switchable neutral density filters and LED current. Rods were stimulated with 10-ms flashes of LED light with λmax = 521 nm.
The photoresponses were low-pass filtered at 30 Hz (eight-pole analog Bessel filter) and recorded at 10-ms digitization intervals. The flash intensity was calibrated for the majority of individual rods using the Poisson statistics of responses to weak flashes [42]. Data acquisition, stimulus timing, and stimulus intensity were controlled by hardware and software from LabView (National Instruments, Austin, TX). Temperature held at 17–19 °C in the experimental room.
Data analysis
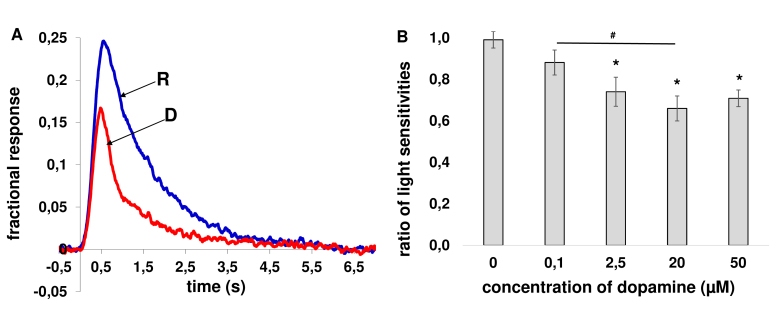
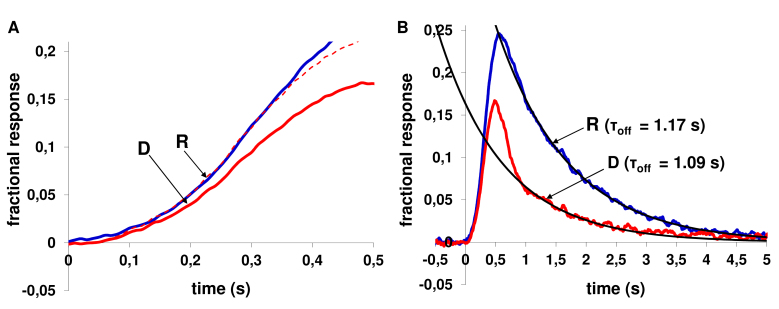
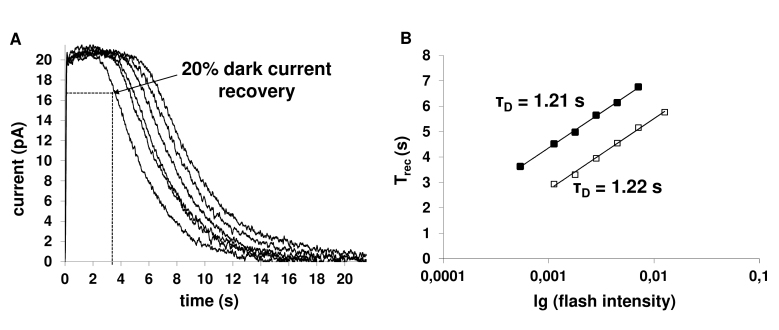
To estimate putative changes in photoresponse properties, we analyzed the following parameters: the dark current, rod sensitivity, activation rate (A), turn-off time constant (τoff), and dominant recovery time constant (Pepperberg constant; τD). These measures reflect different basic parameters of the phototransduction cascade, correlating to its functional state. The dark current was measured by an amplitude of a photoresponse to a saturating flash. The light sensitivity of rods was assessed by their responses to weak nonsaturating flashes (eliciting responses with an amplitude approximately 25% from the dark current level; Figure 1A); an average of 10 responses was normalized to the magnitude of the corresponding dark current. The activation rate of the phototransduction cascade characterizes the steepness of the rising phase of rod responses. For the present study, we needed only to determine the relative changes of the activation rate. Thus, we made no assumption on the mathematical formalization of biochemical mechanisms underlying the rising phase of the photoresponse, and we extracted the ratio of two activation rate parameters (one for the experimental condition and one for control) by adjusting the rising phases of these two photoresponses, which were both elicited by the same light flash and both normalized to their maximum (dark) current (Figure 2A). The falling phase of photoresponses, corresponding to the main reaction(s) of the phototransduction cascade turn off was fitted with a single-exponential function with time constant τoff (Figure 2B). To determine how the drugs affected the slowest inactivation process, sets of responses to saturating stimuli of increasing flash intensities were recorded immediately before incubation in drug-containing solution and after 20 min of incubation (Figure 3A). The plot of the time of recovery from saturation as a function of the natural log of the flash intensity is called the Pepperberg plot [43]. The slope of the linear fit (approximation of experimental points with Trec = C + τDˑln[I]) reveals the dominant time constant of recovery – τD (an example is given in Figure 3).
Figure 1.
Effect of dopamine on the light sensitivity of frog rods in the “outer segment out” configuration. A: Fractional responses of a frog rod in Ringer’s solution (blue solid line, labeled “R”) just before the start of dopamine application and after 20 min of exposure to 50-µM dopamine-containing solution (red solid line, labeled “D”). Each trace is an average of 10 responses. The responses were normalized to a magnitude of the corresponding dark current that was 22.5 pA in Ringer’s solution and 21 pA at the end of perfusion with dopamine. The flash intensity in these records was 0.81 photon ・μm−2 per flash. B: Changes of the sensitivity presented as a ratio of fractional photoresponses after 20 min of incubation in dopamine-containing solution to fractional photoresponses in Ringer’s solution. Control data are depicted as a ratio of fractional photoresponses after turning on a jet of drug-free Ringer’s solution to fractional photoresponses before introducing rods into the jet. Average from 7–12 cells in each group. Error bars represent the standard error of the mean (SEM); * denotes p<0.05 versus control. The significance of differences between different concentrations of dopamine is indicated by connecting lines between bars; # denotes p<0.05 between concentrations of dopamine.
Figure 2.
Procedure for determining kinetics of the rising and falling phases of rod photoresponses to weak light flashes (the same cell as in Figure 1A). A: The rising phase of fractional responses recorded in Ringer’s solution (blue solid line, labeled “R”) and in the presence of 50-µM dopamine (red solid line, labeled “D”) after 20 min of exposure. The red dashed line shows the response in dopamine-containing solution scaled up by a factor of 1.27 to coincide with the response in Ringer’s solution. B: A single-exponential fit of the falling phase of fractional responses in Ringer’ solution (blue solid line, labeled “R”) and after 20 min incubation in 50-µM dopamine-containing solution (red solid line, labeled “D”). The turn-off time constants (τoff) are shown near the curves of photoresponses.
Figure 3.
Determining the dominant time constant of recovery of rods from saturating flashes. A: The set of responses to saturating stimuli of increasing flash intensities was recorded in Ringer’s solution. The same set of responses was recorded after 20 min from the start of dopamine perfusion (data not shown). The flash intensities in these records were 153–3,431 photons ・μm−2 per flash. B: Plotting the time of recovery from saturation (Trec) as a function of the flash intensity in log scale in Ringer’s solution (■) and after 20 min of incubation in 2.5-µM dopamine-containing solution (□). The straight lines approximate experimental points with Trec = C + τDˑln(I). Trec is defined as the time of regaining 20% of the dark current (see Figure 3A). The dominant recovery time constants (τD) are shown near the lines.
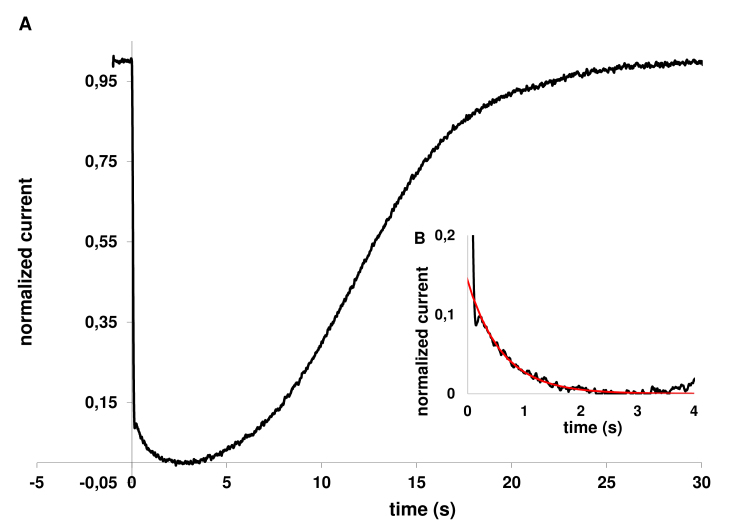
To determine whether dopamine or agonists affect the light-induced calcium changes in rod outer segment (ROS), we measured the “exchange current”, as was done previously [34]. Briefly, in the “outer segment out” configuration, a series of responses to saturating stimuli was recorded before the incubation in the drug-containing solution and then after the incubation, starting from 20 min (3–4 recordings were made at the beginning and at the end of this experimental protocol). The normalized responses of each series were averaged, and then a slow, creeping phase of the photoresponse to a steady (zero) current level was fitted with a single-exponential function (Figure 4). Exponential approximation gives two parameters—the magnitude of the “exchange current” and decay time constant (see details in [34]).
Figure 4.
Analysis of kinetics of light-induced calcium changes in rod outer segment in Ringer’s solution. A: An averaged response of four individual saturated responses. Each response was normalized to the corresponding dark current (~23 pA) and the average plotted “upside down” to show the circulating current. The flash intensities in these recordings were 2,220–3,520 photons ・ μm−2 per flash. B: The same response as in Figure 4A on an enlarged scale. The noisy black line shows the averaged response. The smooth red line is a single-exponential approximation.
Statistical analysis was performed using OriginPro 8.0 (Microcal Software, Northampton, MA). To evaluate whether the distribution of data was normal, the Shapiro–Wilk test was performed. The two-sample Student t-test and one-way analysis of variance (ANOVA) with post hoc comparisons using Tukey’s multiple comparison test were used to analyze data that showed a normal distribution, while the Mann–Whitney U-test was used for data that did not. In the case of pairwise comparisons, the paired-samples t-test (normal distribution) and paired-samples Wilcoxon test (non-normal distribution) were used. The single-sample t-test was used for determining the significance of differences of the activation rates in the control experiments (we compared a ratio of the activation rate (see above) to a hypothetical population mean that we took as 1). To determine the strength and slope of a linear relationship between two variables, the adjusted coefficient of determination (R2adj) was calculated.
The results are presented as a ratio of the parameters after 20 min of incubation of rods in the drug-containing solution to those in Ringer’s solution; in the control experiments, as a ratio of the same parameters after turning on the local perfusion (jet of drug-free Ringer’s solution) to those before placing rod outer segments into the jet. The data were expressed as the mean ± standard error of the mean (SEM), and a p value of less than 0.05 was considered the threshold of significant difference.
Results
Control experiments (jet of Ringer’s solution alone)
In the “inner segment out” configuration, we did not find any mechanical effects of the jet: the parameter values were quite similar before and after turning on the jet (data not shown). The paired-samples t-test, paired-samples Wilcoxon test (for the sensitivity with non-normal distribution of data values), or one-sample t-test (for the activation rates) was used (n = 5). The jet containing 0.1% DMSO (used as control in the experiments with SKF-83959) also did not affect the parameters studied of photoresponses (data not shown), as was revealed by the paired-samples and single-sample t-tests (n = 5).
In the “outer segment out” configuration, placing rod outer segments into the jet caused a decrease of the activation rate (p<0.05; one-sample t-test) without changing other characteristics (Table 1), as was revealed by statistical analysis (paired-samples t-test; n = 10). The jet containing 0.1% DMSO in Ringer’s solution (control for SKF-83959) did not change the photoresponse characteristics significantly (Table 1). The statistical significance was assessed using paired-samples and single-sample t-tests (n = 5). The reasons the activation rate was only statistically reliably reduced in the experiments with Ringer’s solution jet alone, and not the experiments with jet containing Ringer’s solution + 0.1% DMSO, are not quite clear. There are many factors that may mediate the effect of the jet on the cell, and we have no reason to consider any of them as a key factor.
Table 1. The basic parameters of photoresponses presented as ratios of post- and pretreated values, obtained in “outer segment out” configuration in Ringer’s solution and after 20 min incubation in drug-containing solution (mean ± SEM); * denotes p < 0.05 versus control, & denotes p < 0.05 versus 0.1% DMSO control.
| Light sensitivity | Aсtivation rate (A) | Turn-off time constant (τoff) | Dark current | Dominant recovery time constant (τD) | |
|---|---|---|---|---|---|
| Control |
0.99±0.04 |
0.75±0.06 |
1.01±0.05 |
1.06±0.04 |
1.01±0.05 |
| |
(n=10) |
(n=10) |
(n=10) |
(n=10) |
(n=10) |
| |
|
|
|
|
|
| Dopamine (0.1 µM) |
0.9±0.06 |
0.89±0.12 |
0.83±0.07 |
0.95±0.04 |
1.11±0.07 |
| |
(n=12) |
(n=12) |
(n=12) |
(n=12) |
(n=11) |
| |
|
|
|
|
|
| Dopamine |
0.74±0.07 |
0.72±0.07 |
0.97±0.14 |
1.02±0.07 |
1.04±0.04 |
| (2.5 µM) |
(n=10) * |
(n=10) |
(n=10) |
(n=10) |
(n=9) |
| |
|
|
|
|
|
| Dopamine (20 µM) |
0.66±0.06 |
0.57±0.10 |
0.8±0.11 |
0.99±0.04 |
0.92±0.08 |
| |
(n=9) * |
(n=9) |
(n=9) |
(n=9) |
(n=8) |
| Dopamine (50 µM) |
0.71±0.04 |
0.56±0.10 |
0.66±0.05 |
1.05±0.02 |
0.89±0.06 |
| |
(n=7) * |
(n=7) |
(n=7) |
(n=7) |
(n=7) |
| SKF-38,393 |
0.74±0.04 |
0.83±0.05 |
0.90±0.06 |
1.03±0.02 |
0.87±0.06 |
| (0.1 µM) |
(n=10) * |
(n=10) |
(n=10) |
(n=10) |
(n=10) |
| |
|
|
|
|
|
| SKF-38393 |
0.77±0.04 |
0.76±0.07 |
0.93±0.05 |
1.07±0.03 |
0.83±0.05 |
| (2.5 µM) |
(n=9) * |
(n=9) |
(n=9) |
(n=9) |
(n=9) |
| |
|
|
|
|
|
| SKF-38393 |
0.62±0.05 |
0.60±0.05 |
0.72±0.06 |
1.00±0.02 |
0.75±0.04 |
| (20 µM) |
(n=10) * |
(n=10) |
(n=10) * |
(n=10) |
(n=10) * |
| |
|
|
|
|
|
| SKF-38393 |
0.58±0.08 |
0.47±0.11 |
0.64±0.07 |
1.07±0.04 |
0.62±0.03 |
| (50 µM) |
(n=9) * |
(n=9) |
(n=9) * |
(n=9) |
(n=8) * |
| |
|
|
|
|
|
| Quinpirole (2.5 µM) |
0.86±0.09 |
0.85±0.07 |
1.05±0.11 |
1.05±0.03 |
0.98±0.08 |
| |
(n=9) |
(n=9) |
(n=9) |
(n=9) |
(n=8) |
| Quinpirole (20 µM) |
0.85±0.08 |
0.71±0.05 |
0.96±0.06 |
1.05±0.03 |
0.94±0.04 |
| |
(n=10) |
(n=10) |
(n=10) |
(n=10) |
(n=9) |
| Quinpirole (50 µM) |
0.74±0.02 |
0.68±0.05 |
0.82±0.05 |
1.11±0.06 |
0.95±0.03 |
| |
(n=11) * |
(n=11) |
(n=11) |
(n=11) |
(n=11) |
| Control |
1.00±0.03 |
1.11±0.08 |
1.08±0.10 |
1.03±0.02 |
1.11±0.04 |
| (0.1% DMSO) |
(n=5) |
(n=5) |
(n=5) |
(n=5) |
(n=5) |
| |
|
|
|
|
|
| SKF-83959 |
0.73±0.02 |
0.97±0.07 |
0.78±0.03 |
1.05±0.03 |
1.01±0.07 |
| (50 µM) | (n=10) & | (n=10) | (n=10) & | (n=10) | (n=5) |
The lack of effects on the photoresponse properties in the “inner segment out” configuration
In the “inner segment out” configuration, all the drugs were tested at only a 50-µM concentration. The drugs had no effects on the parameters studied (data not shown). To analyze data that showed a non-normal distribution (sensitivity for control without DMSO, dominant recovery time constants for dopamine and SKF-38393, and activation rate for quinpirole), the Mann–Whitney U-test was used. The other parameters were compared using the two-sample Student t-test (n = 5–7).
“Outer segment out” configuration
Dopamine
The effect of dopamine on the photoresponse properties was evaluated using four different concentrations (ranging from 0.1 to 50 µM). Using one-way ANOVA with the Tukey’s post hoc test corrected for multiple comparisons, it was revealed that dopamine decreased rod sensitivity at 2.5, 20, and 50 µM compared to control, while at 0.1 µM, the decrease in the sensitivity was not significant (Figure 1B). The ratios of the sensitivities (after incubation/before incubation) reduced to ~75% (at 2.5 µM), ~67% (at 20 µM), and ~72% (at 50 µM) compared with the ratio of the sensitivities in the control experiment (Table 1). We also found a significant decrease of light sensitivity between 0.1 and 20 µM (Figure 1B). The other parameters studied did not change significantly with dopamine at all tested concentrations (Table 1).
D1R agonist SKF-38393
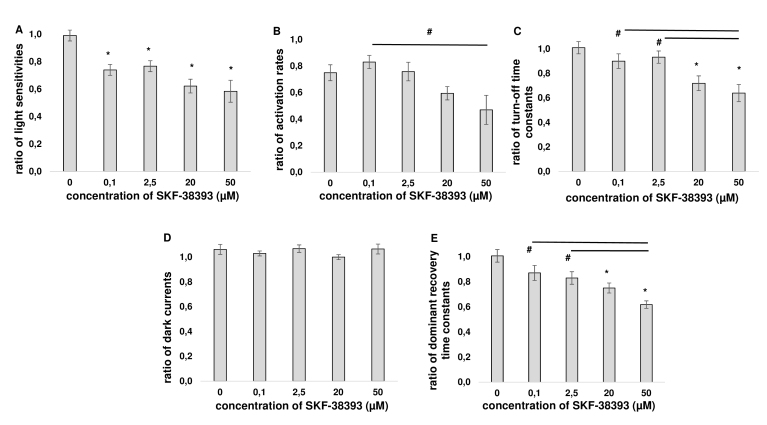
The exposure of rod outer segments to SKF-38393 resulted in a prominent decrease of rod sensitivity at all tested agonist concentrations (Figure 5A, Table 1). This D1R agonist reduced the sensitivity to ~75% (at 0.1 µM), ~78% (at 2.5 µM), ~63% (at 20 µM), and ~59% (at 50 µM) compared with control. SKF-38393 at 50 µM also decreased (~1.8-fold) the activation rate compared with the lowest tested concentration (0.1 µM, Figure 5B, Table 1); however, changes of activation rate in relation to control were statistically insignificant. The turn-off time constant (τoff) of photoresponse at 0.1 and 2.5 µM was approximately at the level of control, while at 20 and 50 µM, it decreased by ~28% and ~29%, respectively, compared with control (Figure 5C, Table 1). The magnitudes of the dark current in the presence of SKF-38393 did not change noticeably (Figure 5D, Table 1). SKF-38393 sped up the rods’ recovery from supersaturating flashes that was reflected in a decrease of the dominant recovery time constants (τD) at 20 and 50 µM (Figure 5E, Table 1). Multiple comparisons between groups (control, 0.1, 2.5, 20, and 50 µM SKF-38393) were evaluated by one-way ANOVA, followed by the Tukey’s multiple-comparison procedure.
Figure 5.
Effects of the D1R agonist SKF-38393 on the basic parameters of rod photoresponses in “outer segment out” configuration. Changes of the parameters presented as a ratio of responses after 20 min of exposure to SKF-38393 to photoresponses in Ringer’s solution. Control (0 µM) data are depicted as a ratio of photoresponses after turning on a jet of drug-free Ringer’s solution to photoresponses before introducing rods into the jet. Effects of SKF-38393 on the light sensitivity (A), activation rate (B), turn-off time constant (C), dark current (D), and dominant recovery time constant (E). Average of 8–10 cells in each group. Error bars represent the standard error of the mean (SEM); * denotes p<0.05 versus control. The significance of differences between different concentrations of the D1R agonist is indicated by connecting lines between bars; # denotes p<0.05 between concentrations of the D1R agonist.
D2R agonist quinpirole
One-way ANOVA followed by Tukey’s test was used to test for the statistical significance of differences between control rods and rods exposed to quinpirole at 2.5, 20, or 50 µM. Of the parameters studied, the only one that changed was the sensitivity reduction at 50 µM quinpirole to ~75% compared with control (Table 1).
D1–D2 receptor heterodimer agonist SKF-83959
SKF-83959 reduced the sensitivity to ~73% at 50 µM (the only tested concentration) compared with control (0.1% DMSO in Ringer’s solution). Another parameter that decreased significantly was the turn-off time constant (Table 1). The other parameters studied did not change compared with control. Statistical analysis was performed using the two-sample Student t-test.
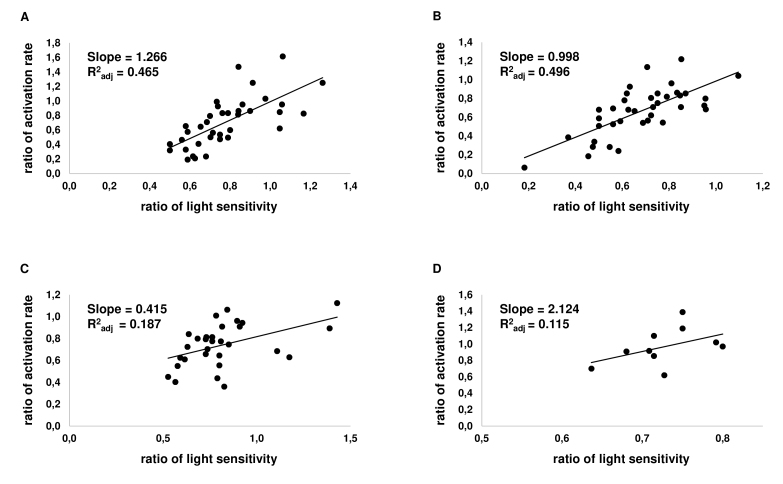
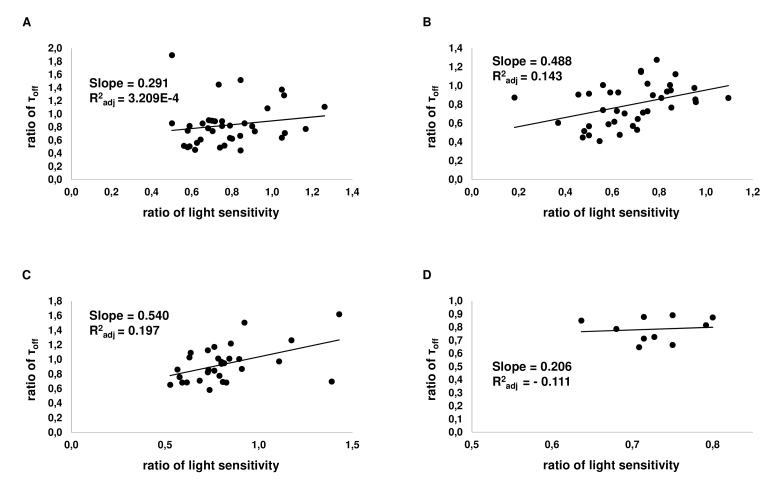
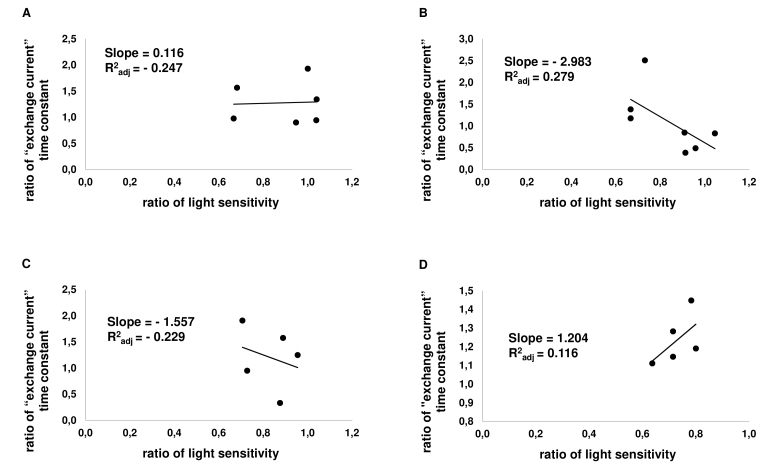
Probably because of the moderate size of the effect, analysis based on grouping data sorted by agonist concentration failed to reveal a correlation between the sensitivity, activation rate, and turn-off time constant in drugs other than SKF-38393. Therefore, we investigated possible correlations of sensitivity changes, the activation rate, and the time of the cascade turn off in individual cells. Here, for every consideration, we put the data from all the cells exposed to only one drug but with different concentrations into one pool. The pairs of values of the sensitivity and activation rate, as well as the sensitivity and turn-off time constant, were analyzed separately, assuming a linear correlation function, and values of the slope of a linear trend and adjusted determination coefficient R2adj were calculated (Figure 6, Figure 7).
Figure 6.
Correlation of changes of light sensitivity and the activation rate in individual cells. On the Х-axis, the relative sensitivity of a cell to light is plotted; the Y-axis shows the relative activation rate of a rod. Each point represents one cell. A: Correlation graph for dopamine (at 0.1–50 µM; n = 37). B: Correlation graph for the D1R agonist SKF-38393 (at 0.1–50 µM; n = 38). C: Correlation graph for D2R agonist quinpirole (at 2.5–50 µM; n = 30). D: Correlation graph for D1–D2 receptor agonist SKF-83959 (at 50 µM; n = 10).
Figure 7.
Correlation of changes of light sensitivity and the time of photoresponse turn off in individual cells. On the Х-axis, the relative sensitivity of a cell to light is plotted, while the Y-axis shows the relative turn-off time constant of a rod. Each point represents one cell. A: Correlation graph for dopamine (at 0.1–50 µM; n = 37). B: Correlation graph for D1R agonist SKF-38393 (at 0.1–50 µM; n = 38). C: Correlation graph for D2R agonist quinpirole (at 2.5–50 µM; n = 30). D: Correlation graph for D1–D2 receptor agonist SKF-83959 (at 50 µM; n = 10).
For most data groups, R2adj is low and allows us only to refer to correlation data as a tendency rather than a proven correlation. However, here, one can notice that, in SKF-38393, dopamine, and SKF-83959, the slope of sensitivity/activation rate correlation (Figure 6) was much steeper than the slope of the sensitivity/turn-off time constant correlation was (Figure 7). For dopamine and SKF-38393, the R2adj of the sensitivity/activation rate correlation substantially exceeded that of the sensitivity/turn-off time constant correlation. For quinpirole, the slopes of both correlations were about the same, and R2adj was also similar and low for both correlations. For SKF-83959, the slope of the sensitivity/activation rate correlation was much higher than it was for the sensitivity/turn-off time constant correlation; however, R2adj was low for both correlations. The general conclusion that can be made from the above data is that the decrease of sensitivity correlates much better with a decrease of the activation rate rather than speeding up of the cascade turn-off processes.
Effects of dopamine and dopamine receptor agonists on the “exchange current” in ROS
The possible effect of dopamine and dopamine receptor agonists on Ca2+ homeostasis in the rod outer segment was assessed at 50 µM for all the drugs. The use of the standard method of calcium sensitive fluorescence dye is complicated by the photosensitivity of the cells. Thus, we employed a simple but reliable method for measuring the size and kinetics of the so-called “exchange current” that appears at the moment of a complete closure of all cGMP-gated channels (details are given in [34]). We found that D1–D2 receptor heterodimer agonist (SKF-83959) increased the magnitude of the “exchange current” by 1.27 ± 0.05 times (p<0.05) without significantly changing its kinetics (Table 2). The magnitude and kinetics of the “exchange current” did not change as a result of dopamine, SKF-38393, or quinpirole (Table 2). As the data showed a normal distribution, the statistical significance was assessed using the two-sample t-test.
Table 2. The magnitude of the “exchange current” and its decay time constant presented as ratio of post- and pretreated values, obtained in “outer segment out” configuration in Ringer’s solution and after 20 min incubation in drug-containing solution (mean ± SEM); & denotes p < 0.05 versus 0.1% DMSO control.
| “Exchange current” magnitude | “Exchange current” decay time constant | |
|---|---|---|
| Control |
1.05±0.05 |
0.99±0.07 |
| |
(n=8) |
(n=8) |
| |
|
|
| Dopamine |
1.15±0.08 |
1.28±0.17 |
| (50 µM) |
(n=6) |
(n=6) |
| |
|
|
| SKF-38393 |
1.09±0.14 |
1.09±0.27 |
| (50 µM) |
(n=7) |
(n=7) |
| |
|
|
| Quinpirole |
1.15±0.19 |
1.2±0.27 |
| (50 µM) |
(n=5) |
(n=5) |
| |
|
|
| Control |
1.00±0.08 |
1.09±0.21 |
| (0.1% DMSO) |
(n=6) |
(n=6) |
| |
|
|
| SKF-83959 |
1.27±0.05 |
1.24±0.06 |
| (50 µM) | (n=5) & | (n=5) |
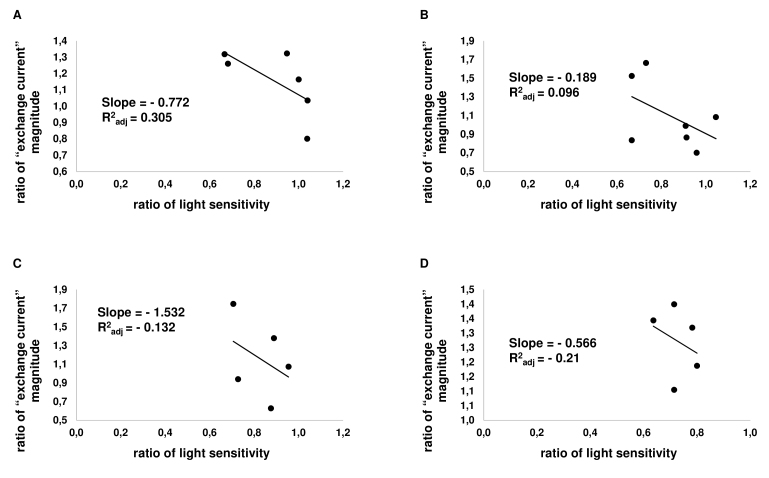
Applying analysis of a correlation between the sensitivity and changes of “exchange current” (i.e., intracellular calcium) to individual cells, we found this correlation weak but negative for all tested drugs (Figure 8, Figure 9). In other words, for all tested drugs, intracellular calcium shows a tendency to increase with decreasing sensitivity of the rod.
Figure 8.
Correlation of changes of light sensitivity and the size of “exchange current” in individual cells. On the Х-axis, the relative sensitivity of a cell to light is plotted; the Y-axis shows the relative “exchange current” magnitude of a rod. Each point represents one cell. A: Correlation graph for dopamine (at 50 µM; n = 6). B: Correlation graph for D1R agonist SKF-38393 (at 50 µM; n = 7). C: Correlation graph for D2R agonist quinpirole (50 µM; n = 5). D: Correlation graph for D1–D2 receptor agonist SKF-83959 (at 50 µM; n = 5).
Figure 9.
Correlation of changes of light sensitivity and the time constant of “exchange current” in individual cells. On the Х-axis, the relative sensitivity of a cell to light is plotted; the Y-axis shows the relative “exchange current” magnitude of a rod. Each point represents one cell. A: Correlation graph for dopamine (at 50 µM; n = 6). B: Correlation graph for D1R agonist SKF-38393 (at 50 µM; n = 7). C: Correlation graph for D2R agonist quinpirole (50 µM; n = 5). D: Correlation graph for D1–D2 receptor agonist SKF-83959 (at 50 µM; n = 5).
Discussion
Localization of dopamine receptors in frog rod photoreceptor cells
The repertoire of dopamine receptors and their distribution between cellular compartments have been intensively studied. Thus, visualization of dopamine receptor distribution by autoradiography on the rat retina [10] and fluorescence staining in amphibian [11,13], mammalian, chicken, and fish [12,13] rods and cones showed that photoreceptors bear D2R. Functional tests also provide evidence in favor of D2R. Thus, the effect of dopamine on retinomotor movement in frog cones [9], the calcium current in L-type calcium channels in salamander cones [44], and rod-cone coupling in the Xenopus retina [45] have been reproduced by the D2R agonist quinpirole but not D1R agonist SKF-38393. Communication of photoreceptors to horizontal cells was found to be affected by both SKF-38393 and quinpirole, although SKF-38393 elicited the same effect at a 20 times larger concentration than quinpirole did [46]. D2R but not D1R agonists and antagonists also affected the affinity of cGMP-gated ion channels for cGMP in a circadian manner in chickens [47] and hyperpolarization-activated current in the inner segments of Xenopus rods [48].
Staining of rat photoreceptors [12] reveals localization of dopamine receptors on both outer and inner segments while in amphibian, the specific labeling for D2R was found primarily on inner segments [49]. In our experiment, we found more prominent functional polarization of responsiveness, with the outer segment responsive to dopamine and agonists but the inner segment nonresponsive. Our experiments were conducted under dark-adapted conditions, but it is possible that in light-adapted cells, the distribution of dopamine receptors between cell compartments may change, as was found in rat photoreceptors [12]. In addition, it cannot be ruled out that some dopamine receptors may have been in the region of the synaptic terminal but were lost because of the isolation of cells from the retina.
Effects and putative mechanism(s) of dopamine action on the phototransduction cascade
The present study aimed to elucidate how dopamine may affect the central function of photoreceptor cells—their phototransduction, which converts light stimuli into electrical output to the second-order neurons. The current concept is that dopamine activates D2R on the photoreceptor’s plasma membrane, leading to decreases in the intracellular cAMP level and activation of PKA. This, in turn, leads to multiple actions via (mostly hypothetical) loops that affect various molecular targets, manifesting in various functional appearances, as described in [19,27-33]. Among them, the effect of dopamine on the phototransduction cascade has not yet been investigated. Previously, we analyzed the effect of cAMP on the major parameters of the phototransduction cascade, and this made possible a direct comparison of the dopamine effect in the present study and the known effects of cAMP elevation on the phototransduction cascade in the isolated rod of the same species [34]. One of the basic ideas of the analysis was to estimate whether dopamine produces opposite changes in photoresponse properties compared with intracellular cAMP.
A decrease of fractional response to light flashes may be caused by slowing down the process of activation of the phototransduction cascade, speeding up the turning off of the cascade, or both. The former process is characterized by the activation rate of the cascade. The turn-off process includes multiple reactions [50], and it can be fitted in a first approximation by a single exponent. To analyze which of the listed parameters is mostly responsible for the decrease of sensitivity, we estimated the correlation between the sensitivity of a photoreceptor cell to light, activation rate, and turn-off time constant.
We found that a rod photoreceptor responds to dopamine and all agonists applied to its outer segment by decreasing sensitivity to light. All tested drugs can be rated by the combination of size of their effects on sensitivity, as well as in the reverse order by the magnitude of the concentration thresholds of these effects, as SKF-38393 > dopamine > SKF-83959 > quinpirole. At the maximum drug concentration, 50 µM, the most prominent effect on a rod photoreceptor sensitivity was produced by the D1R agonist SKF-38393, while dopamine, the D2R agonist quinpirole, and the D1-D2 receptor heterodimer agonist SKF-83959 produced somewhat smaller and approximately equal effects (Table 1). Moreover, SKF-38393 showed reduced sensitivity at all tested concentrations, starting from the smallest one (0.1 µM), while dopamine and quinpirole started their action at the higher concentrations of 2.5 µM and 50 µM, respectively (Table 1).
Analysis of kinetic characteristics of photoresponses revealed that the activation rate (A) decreased statistically significantly only at 50 µM SKF-38393 and only compared with the lowest concentration of this agonist (0.1 µM). The turn-off time constant (τoff) decreased statistically significantly with SKF-38393 (at 20–50 µM) and SKF-83959 (at 50 µM) compared with the control. Dopamine produces a decrease of sensitivity starting from a 2.5 µM concentration compared with control. This decrease is not accompanied by statistically significant changes of the activation rate or the turn-off constant. Quinpirole demonstrates a statistically significant decrease of sensitivity to light only at the highest concentration of 50 µM (versus control). In the case of dopamine, the decrease is not accompanied by changes of the activation rate or turn-off constant.
Among the numerous physiological effects of dopamine application, changes of intracellular calcium [Ca2+]in are the most important, irrespective of whether [Ca2+]in changes are secondary to cAMP changes or occur through independent signaling pathways (see [36,44,51] and also discussion below). To evaluate possible changes of [Ca2+]in in our experiments, we measured the intracellular calcium using the “exchange current” as a tool. All the drugs were tested at one concentration, 50 µM. Here, we found a statistically significant increase of intracellular calcium by 1.3 times for SKF-83959 only (Table 2).
Taking all the above data into consideration, we can now make a direct comparison of regulatory action on the cascade in frog rods induced either by forskolin [34] or dopamine. Forskolin induces elevation of [cAMP]in, elevation of [Ca2+]in, and as a result, elevation of the rod sensitivity. The fractional response to light grows due to the retardation of turn-off reactions. The proposed mechanisms for this retardation are the decrease of background (dark) activity of phosphodiesterase (PDE) and modulation of guanylate cyclase (GC) activity. In the present study, dopamine induced a decrease of rod sensitivity, mostly by reducing the activation rate of the cascade, and to a much lower extent, speeding up the turn off of the cascade.
The data suggest that the effect of dopamine is largely not an inverse effect of forskolin. Partly reciprocally inverse to the reaction to forskolin is the behavior of the time constant of the cascade turn off, which slows down/speeds up in response to an increase/decrease in cAMP. In addition, the behavior of the dominant turn-off time constant of the phototransduction cascade (τD) is the inverse. It decreases in response to SKF-38393, thereby speeding up the slowest process of cascade turn off, and this behavior is opposite to the increase of τD in response to cAMP elevation [34]. However, a putative decrease of cAMP by dopamine reduces the activation rate of the cascade, while an increase of cAMP makes no changes to this parameter. It may be appropriate here to assume that at a certain cAMP level, the activation rate reaches its biochemical limit, and further up- (but not down-) regulation by cAMP is impossible.
Dopamine, SKF-38393 and quinpirole on average do not change the [Ca2+]in, while SKF-83959 increases it by ~1.3 times (Table 2). This effect is likewise not inverse to the effect of forskolin, which also increases [Ca2+]in to approximately the same extent [34]. This fact leads to the conclusion that, as was already proposed before [44,52], dopamine exercises its regulatory effect via at least two independent mechanisms, namely, the cAMP-mediated and Ca2+-mediated mechanisms. Thus, it is possible that cAMP downregulation could solely reduce [Ca2+]in but independent calcium regulation by dopamine may compensate for or even exceed the prestimulus level of [Ca2+]in.
The sign of the reaction to all the tested drugs, lack of selectivity of dopamine and agonist action, and analysis of factors that may determine the decrease of sensitivity to light suggest the presence of D1–D2 receptor heterodimers. A functional proof of existence of D2–D5 receptor heterodimers was shown in rat ganglion cells [52]. The signaling pathways of dopamine may be branching, and stimulation of such heterodimeric complexes with either D1R or D2R agonist might lead to a reaction that is not characteristic of either D1R, or D2R alone (for review see[53,54] )and may affect the various functions of a photoreceptor cell.
Acknowledgments
We thank Drs. V. Govardovskii and P. Ala-Laurila for invaluable helpful discussions and critical reading of the manuscript. We are also thankful to anonymous reviewers of the Journal for helpful suggestions and comments on the manuscript. This work was supported by governmental program 075007761902 and in part by RFBR grant 140400428 to MF. The part of data was presented at European Retina Meeting (Brighton, 2015) and 11th FENS Forum of Neuroscience (Berlin, 2018).
References
- 1.Witkovsky P. Dopamine and retinal function. Doc Ophthalmol. 2004;108:17–40. doi: 10.1023/b:doop.0000019487.88486.0a. [DOI] [PubMed] [Google Scholar]
- 2.Popova E. Role of dopamine in distal retina. J Comp Physiol A Neuroethol Sens Neural Behav Physiol. 2014;200:333–58. doi: 10.1007/s00359-014-0906-2. [DOI] [PubMed] [Google Scholar]
- 3.Dacey DM. The dopaminergic amacrine cell. J Comp Neurol. 1990;301:461–89. doi: 10.1002/cne.903010310. [DOI] [PubMed] [Google Scholar]
- 4.Gingrich JA, Caron MG. Recent advances in the molecular biology of dopamine receptors. Annu Rev Neurosci. 1993;16:299–321. doi: 10.1146/annurev.ne.16.030193.001503. [DOI] [PubMed] [Google Scholar]
- 5.Spano PF, Govoni S, Trabucchi M. Studies on the pharmacological properties of dopamine receptors in various areas of the central nervous system. Adv Biochem Psychopharmacol. 1978;19:155–65. [PubMed] [Google Scholar]
- 6.Kebabian JW, Calne DB. Multiple receptors for dopamine. Nature. 1979;277:93–6. doi: 10.1038/277093a0. [DOI] [PubMed] [Google Scholar]
- 7.Nguyen-Legros J, Versaux-Botteri C, Vernier P. Dopamine receptor localization in the mammalian retina. Mol Neurobiol. 1999;19:181–204. doi: 10.1007/BF02821713. [DOI] [PubMed] [Google Scholar]
- 8.Beaulieu J-M, Gainetdinov RR. The Physiology, Signaling, and Pharmacology of Dopamine Receptors. Pharmacol Rev. 2011;63:182–217. doi: 10.1124/pr.110.002642. [DOI] [PubMed] [Google Scholar]
- 9.Dearry A, Edelman JL, Miller S, Burnside B. Dopamine induces light-adaptive retinomotor movements in bullfrog cones via D2 receptors and in retinal pigment epithelium via D1 receptors. J Neurochem. 1990;54:1367–78. doi: 10.1111/j.1471-4159.1990.tb01971.x. [DOI] [PubMed] [Google Scholar]
- 10.Tran VT, Dickman M. Differential localization of dopamine D1 and D2 receptors in rat retina. Invest Ophthalmol Vis Sci. 1992;33:1620–6. [PubMed] [Google Scholar]
- 11.Krizaj Z, Bashers JC. D2-like dopamine receptors in amphibian retina: localization with fluorescent ligands. J Comp Neurol. 1993;331:149–60. doi: 10.1002/cne.903310202. [DOI] [PubMed] [Google Scholar]
- 12.Vain T, Geffard M, Denis P, Simon A, Nguyen-Legros J. Radioimmunoligand characterization and immunohistochemical localization of dopamine D2 receptors on rods in the rat retina. Brain Res. 1993;614:57–64. doi: 10.1016/0006-8993(93)91018-n. [DOI] [PubMed] [Google Scholar]
- 13.Wagner HJ, Luo BG, Ariano MA, Sibley DR, Stell WK. Localization of D2 dopamine receptors in vertebrate retinae with anti-peptide antibodies. J Comp Neurol. 1993;331:469–81. doi: 10.1002/cne.903310404. [DOI] [PubMed] [Google Scholar]
- 14.Rohrer B, Stell WK. Localization of putative dopamine D2-like receptors in the chick retina, using in situ hybridization and immunocytochemistry. Brain Res. 1995;695:110–6. doi: 10.1016/0006-8993(95)00700-z. [DOI] [PubMed] [Google Scholar]
- 15.Mora-Ferrer C, Yazulla S, Studholme KM, Haak-Frendscho M. Dopamine D1-receptor immunolocalization in goldfish retina. J Comp Neurol. 1999;411:705–14. doi: 10.1002/(sici)1096-9861(19990906)411:4<705::aid-cne14>3.0.co;2-y. [DOI] [PubMed] [Google Scholar]
- 16.Bjelke B, Goldstein M, Tinner B, Andersson C, Sesack SR, Steinbusch HW, Lew JY, He X, Watson S, Tengroth B, Fuxe K. Dopaminergic transmission in the rat retina: evidence for volume transmission. J Chem Neuroanat. 1996;12:37–50. doi: 10.1016/s0891-0618(96)00176-7. [DOI] [PubMed] [Google Scholar]
- 17.Derouiche A, Asan E. The dopamine D2 receptor subfamily in rat retina: ultrastructural immunogold and in situ hybridization studies. Eur J Neurosci. 1999;11:1391–402. doi: 10.1046/j.1460-9568.1999.00557.x. [DOI] [PubMed] [Google Scholar]
- 18.Cohen AI, Todd RD, Harmon S, O’Malley KL. Photoreceptors of mouse retinas possess D4 receptors coupled to adenylate cyclase. Proc Natl Acad Sci USA. 1992;89:12093–7. doi: 10.1073/pnas.89.24.12093. [DOI] [PMC free article] [PubMed] [Google Scholar]
- 19.Hillman DW, Lin D, Burnside B. Evidence for D4 receptor regulation of retinomotor movement in isolated teleost cone inner-outer segments. J Neurochem. 1995;64:1326–35. doi: 10.1046/j.1471-4159.1995.64031326.x. [DOI] [PubMed] [Google Scholar]
- 20.Zawilska JB, Nowak JZ. Dopamine D4-like receptors in vertebrate retina: does the retina offer a model for the D4-receptor analysis? Pol J Pharmacol. 1997;49:201–11. [PubMed] [Google Scholar]
- 21.Klitten LL, Rath MF, Coon SL, Kim JS, Klein DC, Moller M. Localization and regulation of dopamine receptor D4 expression in the adult and developing rat retina. Exp Eye Res. 2008;87:471–7. doi: 10.1016/j.exer.2008.08.004. [DOI] [PMC free article] [PubMed] [Google Scholar]
- 22.Iuvone PM, Galli CL, Garrison-Gund CK, Neff NH. Light stimulates tyrosine hydroxylase activity and dopamine synthesis in retinal amacrine neurons. Science. 1978;202:901–2. doi: 10.1126/science.30997. [DOI] [PubMed] [Google Scholar]
- 23.Zawilska JB, Bednarek A, Berezińska M, Nowak JZ. Rhythmic changes in metabolism of dopamine in the chick retina: The importance of light versus biological clock. J Neurochem. 2003;84:717–24. doi: 10.1046/j.1471-4159.2003.01559.x. [DOI] [PubMed] [Google Scholar]
- 24.Megaw PL, Boelen MG, Morgan IG, Boelen MK. Diurnal patterns of dopamine release in chicken retina. Neurochem Int. 2006;48:17–23. doi: 10.1016/j.neuint.2005.08.004. [DOI] [PubMed] [Google Scholar]
- 25.Govardovskii VI, Calvert PD, Arshavsky VY. Photoreceptor light adaptation. Untangling desensitization and sensitization. J Gen Physiol. 2000;116:791–4. doi: 10.1085/jgp.116.6.791. [DOI] [PMC free article] [PubMed] [Google Scholar]
- 26.Nikonov S, Lamb TD, Pugh EN., Jr The role of steady phosphodiesterase activity in the kinetics and sensitivity of the light-adapted salamander rod response. J Gen Physiol. 2000;116:795–824. doi: 10.1085/jgp.116.6.795. [DOI] [PMC free article] [PubMed] [Google Scholar]
- 27.Besharse JC, Dunis DA, Burnside B. Effects of cyclic adenosine 3′,5′-monophosphate on photoreceptor disc shedding and retinomotor movement. Inhibition of rod shedding and stimulation of cone elongation. J Gen Physiol. 1982;79:775–90. doi: 10.1085/jgp.79.5.775. [DOI] [PMC free article] [PubMed] [Google Scholar]
- 28.Pierce ME, Besharse JC. Circadian regulation of retinomotor movements. I. Interaction of melatonin and dopamine in the control of cone length. J Gen Physiol. 1985;86:671–89. doi: 10.1085/jgp.86.5.671. [DOI] [PMC free article] [PubMed] [Google Scholar]
- 29.Dearry A, Burnside B. Dopaminergic regulation of cone retinomotor movement in isolated teleost retinas. I. Induction of cone contraction is mediated by D2 receptors. J Neurochem. 1986;46:1006–21. doi: 10.1111/j.1471-4159.1986.tb00612.x. [DOI] [PubMed] [Google Scholar]
- 30.Iuvone PM. Evidence for a D2 dopamine receptor in frog retina that decreases cyclic AMP accumulation and serotonin N-acetyltransferase activity. Life Sci. 1986;38:331–42. doi: 10.1016/0024-3205(86)90080-9. [DOI] [PubMed] [Google Scholar]
- 31.Iuvone PM, Besharse JC. Cyclic AMP stimulates serotonin N-acetyltransferase activity in Xenopus retina in vitro. J Neurochem. 1986;46:33–9. doi: 10.1111/j.1471-4159.1986.tb12921.x. [DOI] [PubMed] [Google Scholar]
- 32.Cahill GM, Besharse JC. Resetting the circadian clock in cultured Xenopus eyecups: regulation of retinal melatonin rhythms by light and D2 dopamine receptors. J Neurosci. 1991;11:2959–71. doi: 10.1523/JNEUROSCI.11-10-02959.1991. [DOI] [PMC free article] [PubMed] [Google Scholar]
- 33.Zawilska J, Derbiszewska T, Sek B, Nowak J. Dopamine-dependent cyclic AMP generating system in chick retina and its relation to melatonin biosynthesis. Neurochem Int. 1995;27:535–43. doi: 10.1016/0197-0186(95)00033-5. [DOI] [PubMed] [Google Scholar]
- 34.Astakhova LA, Samoiliuk EV, Govardovskii VI, Firsov ML. cAMP controls rod photoreceptor sensitivity via multiple targets in the phototransduction cascade. J Gen Physiol. 2012;140:421–33. doi: 10.1085/jgp.201210811. [DOI] [PMC free article] [PubMed] [Google Scholar]
- 35.Nir I, Harrison JM, Haque R, Low MJ, Grandy DK, Rubinstein M, Iuvone PM. Dysfunctional light-evoked regulation of cAMP in photoreceptors and abnormal retinal adaptation in mice lacking dopamine D4 receptors. J Neurosci. 2002;22:2063–73. doi: 10.1523/JNEUROSCI.22-06-02063.2002. [DOI] [PMC free article] [PubMed] [Google Scholar]
- 36.Ivanova TN, Alonso-Gomez AL, Iuvone PM. Dopamine D4 receptors regulate intracellular calcium concentration in cultured chicken cone photoreceptor cells: relationship to dopamine receptor-mediated inhibition of cAMP formation. Brain Res. 2008;1207:111–9. doi: 10.1016/j.brainres.2008.02.025. [DOI] [PMC free article] [PubMed] [Google Scholar]
- 37.Jackson CR, Ruan GX, Aseem F, Abey J, Gamble K, Stanwood G, Palmiter RD, Iuvone PM, McMahon DG. Retinal dopamine mediates multiple dimensions of light-adapted vision. J Neurosci. 2012;32:9359–68. doi: 10.1523/JNEUROSCI.0711-12.2012. [DOI] [PMC free article] [PubMed] [Google Scholar]
- 38.Lavoie J, Illiano P, Sotnikova TD, Gainetdinov RR, Beaulieu JM, Hebert M. The electroretinogram as a biomarker of central dopamine and serotonin: potential relevance to psychiatric disorders. Biol Psychiatry. 2014;75:479–86. doi: 10.1016/j.biopsych.2012.11.024. [DOI] [PubMed] [Google Scholar]
- 39.Tian N, Xu HP, Wang P. Dopamine D2 receptors preferentially regulate the development of light responses of the inner retina. Eur J Neurosci. 2015;41:17–30. doi: 10.1111/ejn.12783. [DOI] [PMC free article] [PubMed] [Google Scholar]
- 40.Baylor DA, Lamb TD, Yau KW. The membrane current of single rod outer segments. J Physiol. 1979;288:589–611. [PMC free article] [PubMed] [Google Scholar]
- 41.Astakhova LA, Firsov ML, Govardovskii VI. Kinetics of turn-offs of frog rod phototransduction cascade. J Gen Physiol. 2008;132:587–604. doi: 10.1085/jgp.200810034. [DOI] [PMC free article] [PubMed] [Google Scholar]
- 42.Baylor DA, Lamb TD, Yau KW. Responses of retinal rods to single photons. J Physiol. 1979;288:613–34. [PMC free article] [PubMed] [Google Scholar]
- 43.Pepperberg DR, Cornwall MC, Kahlert M, Hofmann KP, Jin J, Jones GJ, Ripps H. Light-dependent delay in the falling phase of the retinal rod photoresponse. Vis Neurosci. 1992;8:9–8. doi: 10.1017/s0952523800006441. [DOI] [PubMed] [Google Scholar]
- 44.Stella SL, Jr, Thoreson WB. Differential modulation of rod and cone calcium currents in tiger salamander retina by D2 dopamine receptors and cAMP. Eur J Neurosci. 2000;12:3537–48. doi: 10.1046/j.1460-9568.2000.00235.x. [DOI] [PubMed] [Google Scholar]
- 45.Krizaj D, Gábriel R, Owen WG, Witkovsky P. Dopamine D2 receptor-mediated modulation of rod-cone coupling in the Xenopus retina. J Comp Neurol. 1998;398:529–38. [PMC free article] [PubMed] [Google Scholar]
- 46.Krizaj D, Witkovsky P. Effects of submicromolar concentrations of dopamine on photoreceptor to horizontal cell communication. Brain Res. 1993;627:122–8. doi: 10.1016/0006-8993(93)90755-c. [DOI] [PubMed] [Google Scholar]
- 47.Ko GY, Ko ML, Dryer SE. Circadian phase-dependent modulation of cGMP-gated channels of cone photoreceptors by dopamine and D2 agonist. J Neurosci. 2003;23:3145–53. doi: 10.1523/JNEUROSCI.23-08-03145.2003. [DOI] [PMC free article] [PubMed] [Google Scholar]
- 48.Akopian A, Witkovsky P. D2 dopamine receptor-mediated inhibition of a hyperpolarization-activated current in rod photoreceptors. J Neurophysiol. 1996;76:1828–35. doi: 10.1152/jn.1996.76.3.1828. [DOI] [PubMed] [Google Scholar]
- 49.Muresan Z, Besharse JC. D2-like dopamine receptors in amphibian retina: localization with fluorescent ligands. J Comp Neurol. 1993;331:149–60. doi: 10.1002/cne.903310202. [DOI] [PubMed] [Google Scholar]
- 50.Burns ME, Baylor DA. Activation, deactivation, and adaptation in vertebrate photoreceptor cells. Annu Rev Neurosci. 2001: 779–805. doi: 10.1146/annurev.neuro.24.1.779. [DOI] [PubMed] [Google Scholar]
- 51.Thoreson WB, Stella SL, Jr, Bryson EI, Clements J, Witkovsky P. D2-like dopamine receptors promote interactions between calcium and chloride channels that diminish rod synaptic transfer in the salamander retina. Vis Neurosci. 2002;19:235–47. doi: 10.1017/s0952523802192017. [DOI] [PMC free article] [PubMed] [Google Scholar]
- 52.Ogata G, Stradleigh TW, Partida GJ, Ishida AT. Dopamine and full-field illumination activate D1 and D2–D5-type receptors in adult rat retinal ganglion cells. J Comp Neurol. 2012;520:4032–49. doi: 10.1002/cne.23159. [DOI] [PMC free article] [PubMed] [Google Scholar]
- 53.George SR, Kern A, Smith RG, Franco R. Dopamine receptor heteromeric complexes and their emerging functions. Prog Brain Res 2014; 211:183–200. [PMID: 24968781]. [DOI] [PubMed] [Google Scholar]
- 54.Perreault ML, Hasbi A, O’Dowd BF, George SR. Heteromeric dopamine receptor signaling complexes: emerging neurobiology and disease relevance. Neuropsychopharmacology. 2014;39:156–68. doi: 10.1038/npp.2013.148. [DOI] [PMC free article] [PubMed] [Google Scholar]


