

Abstract
Introduction
Urban transmission patterns of influenza viruses are complex and poorly understood, and multiple factors may play a critical role in modifying transmission. Whole genome sequencing (WGS) allows the description of patient-to-patient transmissions at highest resolution. The aim of this study is to explore urban transmission patterns of influenza viruses in high detail by combining geographical, epidemiological and immunological data with WGS data.
Methods and analysis
The study is performed at the University Hospital Basel, University Children’s Hospital Basel and a network of paediatricians and family doctors in the Canton of Basel-City, Switzerland. The retrospective study part includes an analysis of PCR-confirmed influenza cases from 2013 to 2018. The prospective study parts include (1) a household survey regarding influenza-like illness (ILI) and vaccination against influenza during the 2015/2016 season; (2) an analysis of influenza viruses collected during the 2016/2017 season using WGS—viral genomic sequences are compared with determine genetic relatedness and transmissions; and (3) measurement of influenza-specific antibody titres against all vaccinated and circulated strains during the 2016/2017 season from healthy individuals, allowing to monitor herd immunity across urban quarters. Survey data and PCR-confirmed cases are linked to data from the Statistics Office of the Canton Basel-City and visualised using geo-information system mapping. WGS data will be analysed in the context of patient epidemiological data using phylodynamic analyses, and the obtained herd immunity for each quarter. Profound knowledge on the key geographical, epidemiological and immunological factors influencing urban influenza transmission will help to develop effective counter measurements.
Ethics and dissemination
The study is registered and approved by the regional ethics committee as an observational study (EKNZ project ID 2015–363 and 2016–01735). It is planned to present the results at conferences and publish the data in scientific journals.
Trial registration number
Keywords: transmission, whole genome sequencing, geography, questionnaire, influenza, study design
Strength and limitations of this study.
The first strength is that to date this is the largest study on influenza transmission in a city. The second strength is that it provides unprecedented high resolution and granularity of demographic, epidemiological and geographical data and that it links multiple dataset together. The third strength is that the analysis spans over several consecutive years.
A limitation of this study is that not all influenza infections can be captured in a city and also by this study design. The survey part may introduce bias, based on the selection of the population who replied.
Introduction
Seasonal influenza is associated with substantial morbidity, mortality and healthcare costs. Transmission of influenza has been explored with various methods and techniques.1–3 Whole genome sequencing (WGS) has the highest possible technical resolution for molecular typing of viruses and is increasingly used to understand and monitor transmission events of influenza viruses. Recently, WGS technology helped to explore important aspects of transmissions within households,4 hospitals,5–7 university campuses,8 and between countries.9 However, most studies lack crucial details on the epidemiological and demographic context of the infected patients and therefore cannot provide sufficient in-depth knowledge on risk factors for and pathways of transmission. Understanding pathogen transmission from patient-to-patient, especially within the urban context, may inform public health interventions targeting specific transmission chains.
Urban transmission clusters have not yet been explored in detail. The impact of host and environment factors within a city may greatly vary depending of the scale for example, direct person-to-person, within an urban quarter, within and between countries, and around the globe. Within cities, multiple factors may entertain transmission, such as population densities, available living space per person, usage of public transport, socioeconomic structures and behaviours, age, vaccine rates and herd immunity. Urban quarters often vary greatly in some of those factors. Therefore, the differences accumulating within urban quarters may allow us to study the impact of geographical, social and demographic factors in the context of urban transmission of influenza. So far, only a few epidemiological studies have conceptualised these ‘geographic area’ variables for influenza focused transmission and vaccine research.10–14
Combining detailed population related data with high-resolution WGS-based typing of influenza viruses may allow us to profoundly understand factors entertaining urban influenza transmission within the microenvironments of a city. Based on the generated knowledge, targeted public health policies can be informed. Furthermore, these findings may also be translated to other transmissible diseases. In this article, we describe in detail the study design of a 3-year research project funded by the Swiss National Science Foundation (www.snsf.ch) to explore urban influenza transmission.
Aims and objectives
The main objective of this project is to explore the transmission patterns of influenza within a city. Geographical, epidemiological, microbiological and immunological factors are analysed to explain urban transmission patterns.
The specific aims of the retrospective study parts are:
Analysing PCR-confirmed influenza cases (seasons 2013/2014 to 2017/2018):
Accessing PCR-confirmed influenza cases from various institutions across Basel.
Visualising the frequency and spread of incidences with the help of point pattern and other analytical techniques including georeferencing individual cases.
Analysis of influenza cases by mapping incidences with demographic data from the Statistical Office of the Canton Basel-City.
The specific aims of the prospective study parts are:
Household survey (season 2015/2016):
Conducting household surveys within 10 urban quarters.
Determination of the influenza-like illness (ILI) rate on individual and urban quarters levels, and exploring factors associated with ILI.
Determination of influenza vaccine rate on individual and urban quarters levels, and exploring factors associated with influenza vaccine rates.
Linkage and analysis of data from the household survey with demographic data from the Statistics Office of the Canton Basel-Basel for example, population density.
Transmission study:
Building a prospective biobank of PCR-confirmed influenza patients including nasopharyngeal swabs, serum and blood samples.
Sequencing of influenza viruses using WGS and performing phylogenetic analysis, revealing the relatedness of viral strains from individuals within Basel, as well as the relatedness of Basel sequences to foreign sequences obtained from public available databases.
Analysis of transmission patterns in association with clinical, demographic, immunological and geographical data.
Influenza-specific antibody titres
Determination of influenza-specific humoral immunity of healthy individuals and translating the titres to herd immunity levels within urban quarters during the influenza season.
Patient and public involvement
The study proposal was evaluated by the local ethical committee, reflecting a detailed evaluation of patient rights in conducting research. In the survey, the public was informed via the questionnaire and in the influenza transmission study, patients will be informed according to the laws and regulation of the Swiss Human Research Act including the previously mentioned evaluation by the local ethical committee. As this is a study protocol for an observational epidemiological study, no intervention was planned. All study participants in the prospective study parts received information material about the study purpose, aims and what will happen with the data collected.
Methods/design
Setting: In November 2015 the City of Basel had a total of 176 950 inhabitants distributed over 19 urban quarters. An estimated 5% of the population are thought to be infected with influenza viruses annually. The University Hospital Basel and the University Children Hospital Basel are tertiary academic institutions with more than 500 000 adult and 100 000 paediatric outpatient consultations annually. Both hospitals provide emergency department services during influenza seasons. The University Hospital Basel recruited adult patients and the University Children Hospital recruited paediatric patients for this study. In addition, a network of 24 paediatricians and family doctors also recruited patients (see section Influenza transmission using WGS). Some of the data and samples were received from Viollier, a private laboratory providing its services to a large part of private practices within the City of Basel.
Study design
The observational descriptive study consists of retrospective and prospective parts that are performed at the previously mentioned institutions. Figure 1 provides an overview on the different study elements.
Figure 1.
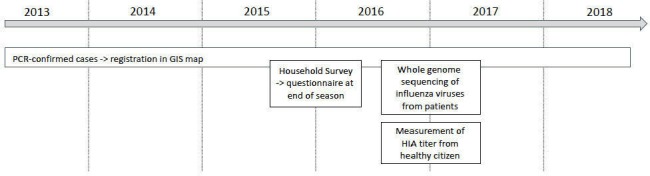
Study overview. Retrospective analysis of PCR-confirmed cases and household survey. prospective collection of influenza virus isolates for WGS analysis and measurement of HIA titres from serum of healthy donors. GIS, geo-information system; HIA, haemagglutination inhibition assay; WGS, whole genome sequencing.
Retrospective studies
PCR-confirmed influenza cases
For this study part, we collect all PCR-confirmed cases from the laboratory and clinical information systems of the University Hospital Basel, the University Children Hospital and the Viollier diagnostic laboratory for the influenza seasons 2013/2014 to 2017/2018 with daily resolution. Data from influenza diagnostic services of nasopharyngeal swabs and additional respiratory material is available since 2013. For all PCR-confirmed influenza A and B cases, further information is accessed (eg, age at infection, gender and residential address). From the Statistics Office of the Canton Basel-City, additional data on the specific housing block is available, for example, population density, net income and living space. The cases are mapped and areas with high occurrence identified using kernel densities (see below).
Prospective studies
Household survey
We designed a household survey for the influenza season 2015/2016 in order to collect data on ILI and influenza vaccination. Figure 2 shows in which urban quarters we distributed 30 000 questionnaires. We chose to study the level of official urban quarters, rather to postcode, as all the data from the Statistics Office of the Canton Basel-City was available at that level. In addition, the areas covered by postcodes and boundaries of official urban quarters do not correspond, making the use of data based on the postcode level unsuitable for the analysis of urban quarters. The distribution of questionnaires started in April 2016 when the incidence rate of the influenza cases dropped below official reported endemic threshold levels.
Figure 2.

Urban quarters of the Canton of Basel-City included into the household survey. The 10 selected urban quarters are highlighted, selected on influenza incidences and known socioeconomic differences. Base map data: department of construction and traffic of the Canton Basel-City, land charge register, specialist department for geoinformatics.
Participants and sample size
We used the probability-proportional-to-size sampling as a basis to plan the survey, as each quarter’s base population varies as well as the systematic equal probability of selection sampling method within each quarter, so that each household had an equal probability of being selected. Both sampling methods account for the heterogeneity of urban quarters. In order to gain insights into community variation in attitudes, beliefs and behaviours on influenza vaccination from a representative sample, the survey was distributed in ten selected urban quarters (figure 2) of Basel, which displayed a great variety in terms of sociodemographic and socioeconomic and building structures. Everyone not living in one of the ten selected urban quarters was excluded from the survey.
We calculated the number of responses needed (n) to make the data representative with the following equation:
| n=Households by urban quarter; e=sampling error 5%; K=1.96 confidence level (90%=1.64; 95%=1.96; 99%=2.58); V=distribution of responses (50%). |
We calculate the number of necessary questionnaires to be distributed per quarter by using the amount of responses needed per quarter, assuming a response rate of 12% (table 1). The questionnaire is translated into the six most commonly spoken languages (German, English, Italian, Serbo-Croatian, Albanian and Turkish). Distribution is according to the three most commonly spoken language per quarter based on data from the Statistics Office of the Canton Basel-City (table 2). Every household received a German questionnaire. The full-length English version of the questionnaire can be found in online supplementary material 1 and a German version in online supplementary material 2.
Table 1.
Representative sample of the household survey
| Urban quarter | No of private households in the quarter (N) | Minimum required returns (n) | No of necessary distributed questionnaires (if 12% response rate) |
| Am Ring | 5456 | 359 | 2991 |
| Gundeldingen | 10 085 | 370 | 3084 |
| Bruderholz | 4038 | 351 | 2924 |
| Bachletten | 6710 | 363 | 3028 |
| Gotthelf | 3764 | 349 | 2906 |
| Iselin | 8860 | 368 | 3069 |
| St. Johann | 9180 | 369 | 3073 |
| Matthäus | 8012 | 367 | 3055 |
| Klybeck | 3506 | 346 | 2886 |
| Kleinhüningen* | 1291 | 296 | 2469 |
| Total of 10 urban district | 60 902 | 3538 | 29 485 |
*The necessary number of questionnaires was calculated with an expected response rate of 12% and, due to statistical calculations, this means more households should have received a questionnaire than there actually are in Kleinhüningen. Source: Population Statistics 2014, Canton Basel-City.
Table 2.
Distribution of foreign-born population and foreign languages in the urban district of Basel
| Urban district | Population | Number of private households | Foreign born population | Foreign population by citizenship as a percentage of all foreigners in the urban quarter (March 2015) | |||
| Largest segment of the foreign population | Second largest segment | Third largest segment | Fourth largest segment | ||||
| Am Ring | 10 666 | 5456 | 3636 | Germany (27%) | Italy (10.3%) | Spain (5.9%) | United Kingdom (4.7%) |
| Gundeldingen | 18 917 | 10 085 | 7497 | Germany (20.5%) | Turkey (14.9%) | Italy (12.7%) | Serbia, Montenegro, Kosovo (9.8%) |
| Bruderholz | 9068 | 4038 | 2098 | Germany (32.6%) | Italy (11.8%) | UK (7.5%) | France (5.2%) |
| Bachletten | 13 549 | 6710 | 2918 | Germany (32.3%) | Italy (13.2%) | Spain (5.2%) | United Kingdom (4.9%) |
| Gotthelf | 6883 | 3764 | 1910 | Germany (32.2%) | Italy (12.5%) | Turkey (4.9%) | Spain (4.9%) |
| Iselin | 16 595 | 8860 | 6092 | Germany (18.3%) | Italy (15%) | Turkey (12.6%) | Serbia, Montenegro, Kosovo (7%) |
| St Johann | 18 835 | 9180 | 8245 | Germany (17.2%) | Turkey (12.2%) | Italy (10.8%) | Portugal (8.7%) |
| Matthäus | 16 303 | 8012 | 8403 | Germany (17%) | Italy (10.8%) | Turkey (10.6%) | Serbia, Montenegro, Kosovo (10.5%) |
| Klybeck | 7331 | 3506 | 3813 | Turkey (16.7%) | Italy (15.5%) | Germany 11.3%) | Serbia, Montenegro, Kosovo (10.9%) |
| Kleinhüningen | 2900 | 1291 | 1553 | Italy (15.7%) | Germany (14.5%) | Turkey (14.3%) | Serbia, Montenegro, Kosovo (10.5%) |
| Total | 121 047 | 60 902 | 46 165 | ||||
Population and foreign-born population were determined for November 2015. Number of private households was determined for 2014. Official language Montenegro: among other regional Serbo-Croatian and Albanian; Serbia: Serbo-Croatian; Kosovo: Albanian, Serbo-Croatian, Turkish.
bmjopen-2019-030913supp001.pdf (947.8KB, pdf)
bmjopen-2019-030913supp002.pdf (918.4KB, pdf)
Variables
A total of 54 questions are included in the survey covering the following topics: (a) ILIs and vaccination, (b) aspects of urban environment, (c) information collection about health and (d) person-related data.
Influenza transmission using WGS
In this project part, patients with ILI were recruited, and confirmed influenza viruses are sequenced using WGS.15 This allows us to determine the phylogeny and transmission interference within urban quarters of the city in the context of particular demographic, geographical and microbiological factors.
Participants and recruitment
All patients with suspected ILI seen at one of the study sites are qualified to participate. The inclusion criteria for ILI are: recent anamnestic fever, coughing, myalgia, arthralgia and sudden onset of disease. Then respiratory samples, mainly nasopharyngeal swabs, are collected. Patients are recruited at 15 study sites distributed throughout the city. The samples are delivered on the same day to the clinical microbiology laboratory for immediate sample processing and PCR testing.
Strain collection and influenza diagnostics
For the influenza season 2016/2017, all positive and negative samples are collected and stored at −80°C. In addition, additional influenza positive samples from the study season 2016/2017 are provided from a private diagnostic laboratory (Viollier AG, Allschwil, Switzerland). Both laboratories used the FluXpress (Cepheid), which allows the (semi-)quantitative determination of influenza A, influenza B and respiratory syncytial virus. Serial isolates from the same patients are also collected and stored until WGS workup.
Additional samples
In addition to the nasopharyngeal swab for influenza, we also collect the following materials: whole blood (EDTA) samples for analysis of host genetics and serum samples for measurement of haemagglutination inhibition assay (HIA) titres as previously described (Kaufmann L et al. JOVE 2017)16 against vaccine and circulating influenza strains.
Additional data
Patient data from influenza cases were merged with metadata from the Statistics Office of the Canton Basel-City. In addition, the patients were provided with two questionnaires. The first one covers the most recent events during ILI of the last few days, the second one focuses on the behaviour while being ill. Patient are instructed to send the second questionnaire 2 weeks after the ILI episode.
WGS of viruses
We use a molecular epidemiological approach to characterise the collected influenza viruses from individual patients with the highest possible resolution. The sequencing procedure has been described in detail.15 Briefly, all samples from patients with ILI are analysed by influenza specific PCRs. PCR-confirmed samples are further processed: first, RNA is extracted from nasopharyngeal swab/fluid; then reverse transcription and PCR is used to amplify all eight RNA viral segments; then PCR products are sequenced with high coverage using a MiSeq system (Illumina).
Determination of herd immunity in health individuals
Participants and recruitment
Blood donors from the local Swiss Red Cross blood donation centre living in Basel are recruited for this study part. All blood donors included are above the age of 18 years and lived in Basel. At two time-points, before and after the 2016/2017 influenza season, serum samples are provided to determine antibody titres. The time between serum collections was three to 9 months. In addition, the vaccine status is documented with a questionnaire.
Measurement of antibody titres
Antibody titres are determined as previously described.16 Briefly, antibody titres are determined using HIA against the following viruses: influenza A/Hong Kong/4801/2014 (H3N2); influenza A/California/7/2009 (H1N1); influenza B/Brisbane/60/2008; and influenza B/Phuket/3073/2013. HI titres of ≥1:40 are considered as seroprotection against this particular virus strain. The predominant virus in the 2016/2017 influenza season is influenza A/HongKong/H3N2. Within an urban quarter, the seroprotective titre is expressed as percentage of the measured population.
Quantitative data analyses and modelling
A retrospective study
General aspects of geo-information system mapping
By including the spatial environment of the urban districts, the study aims to understand whether spatial spreading patterns of influenza coincide significantly with aspects of the urban environment and/or the socioeconomic structure. Influenza incidences and relevant aspects of the urban environment are visualised in ArcGIS (Esri, Switzerland) and combined with oblique aerial photography of urban quarters that are structured differently in terms of the built environment. Geo-information system (GIS)-assisted analyses of the spatial distribution and spreading of influenza incidences blended with block level statistical data from the Statistics Office of the Canton Basel-City are designed to determine close contact environments for example, infrastructure in the quarter, population density, living density, housing density. In addition, we can determine the urban social structure such as age distribution, social life situations, education status, migration background, housing and living arrangements, that may be related to higher occurrences of influenza cases. The possible association between influenza cases and relevant environmental factors are then analysed with spatial statistics. Thus, it can be determined, for example, if the number of influenza cases is higher in densely built, densely populated areas and in areas with certain age structures.
Data processing, GIS mapping for the Canton Basel-City. All maps are generated using ArcGIS V.10.3. The base-map showing individual statistical blocks/urban quarters/cantonal boundaries was obtained from the ‘Office for Geoinformatics, City of Basel’ (download via Geoshop). It should be noted that, while for the City of Basel, the road network defines the boundaries of the statistical blocks in most cases, this is not the case outside the city boundaries. Due to the small size of the individual statistical blocks, their street patterns are not displayed, allowing the presentation of the statistical data as truthfully as possible. ArcGIS allows the georeferencing of individual living addresses by using the tool ‘Geocode Addresses’. The resulting shapefile indicates each influenza case with an individual point feature which can be classified according to added attributes like influenza type, month or week of examination. However, for data protection and ethical reasons, individual cases are not displayed with the address of residence, but only at the at the statistical block level.
Kernel densities
Kernel density estimation is a fundamental data smoothing method where inferences about the population are made, based on a finite data sample. The kernel density tool (ArcGIS) calculates the density of features (here influenza cases) in a certain area and generates a surface for each feature. Then the values of all overlaying kernel surfaces are summed up for each raster cell, resulting in a raster data set showing the kernel density. The kernel density are calculated for the influenza datasets of seasons 2013/2014, 2014/2015, 2015/2016, 2016/2017 and 2017/2018, as well as for the influenza cases of all seasons at once. The resulting raster dataset are reclassified into five shares (five for highest, 1 for lowest values) based on Jenks natural breaks. This raster dataset is then converted into polygon features using the raster-to-feature tool in order to allow more options in terms of cartography (raster datasets can only be displayed in uniform/blank colours; no outlines or hatching possible).
Household survey
The data from the questionnaires is documented in a database (SPSS V.25). A codebook for each variable was determined. Next, we perform a data cleansing, rejecting incompletely filled out questionnaires from the system at entry. Then, a thorough data cleaning and editing process is carried out including harmonisation of codes, words and terms given in free answers, and recoding such answers into new codes and labels, thus creating new standardised variables from the original data. This includes identifying incomplete data and assigning missing values, detecting and correcting coarse data or removing inaccurate records from the database. The data cleaning also involves validity checks, that is, validating and correcting values against a prespecified list of possible options (such as value labels). The coding is checked for each variable for the entire database in respect to the hierarchical order and determine if certain variables should be recoded. As the questionnaires are uniquely identified by urban quarters, and an identification number which is also entered into the data entry mask, we can compare original questionnaire data to data entered in the statistics programme and thereby crosscheck cases that seem to be inconsistent with codes used.
Data classification
From variables such as date of birth, a new variable is created which defines age groups. From the two variables persons per household and square metres per household, a new variable is created which uses stated square metres per person to give an indication of residential density. Socioeconomic factors of all postal-code districts of the city of Basel will be summarised as counts (medians and IQRs) for continuous variables and proportions and percentages for categorical variables. Responses of all participants will be summarised as counts (medians and IQRs) for continuous variables and proportions and percentages for categorical variables and summarised for each postal-code district.
Data enhancement and appendices
The data set is also enhanced by additional information for example, we analyse the variable of the self-stated medication of the respondents and classified it according to the Anatomical Therapeutic Chemical Classification (ATC) system used by the WHO. Thereby study participants can be classified into a risk group and non-risk group for influenza, according to their ATC-Level. The gained information is entered as new variables. We also include the location of a surveyed person within the urban quarter. This information is obtained from surveyed persons who precisely locate their place of residence on a map or by roughly indicating their location within a grid map of the city that we developed for this purpose. Locations are georeferenced and added to the data set.
Data quality
The data cleaning and harmonisation procedure yields a data set that is accurate, complete and consistent, that allows us to go back to original source data (questionnaires), accounts for incomplete or missing values, and that conforms with data handling and anonymity requirements required by Swiss data protection laws and the regulations of the Ethics Commissions.
Data analysis
Various demographic, epidemiological and geographical variables will be compared regarding the outcome variables. The primary outcomes of the household survey are (1) reported ILI and (2) reported influenza vaccine status. Variables and endpoint data was descriptively analysed using SPSS V.25, Stata 1V.5.1 and Prism V.7.0d (2017; www.graphpad.com). Data will be shown as median and IQRs for continuous data and absolute numbers and percentage for categorical data. The statistical methods used to estimate an association between the variables are based on studies with similar topics.17–21
Analytical analysis
Comparisons between different postal-code areas: Different socioeconomic measures will be compared between the different postal-code districts by χ2 tests (or the Fisher’s exact test, when appropriate) for categorical variables and by the Kruskal-Wallis test for continuous variables. Summary measures of individual risk factors for influenza will be compared between the different postal-code districts by χ2 tests (or the Fisher’s exact test, when appropriate) for categorical variables and by the Kruskal-Wallis test for continuous variables. Outcome variables will be compared between the different postal-code districts by χ2 tests (or the Fisher’s exact test, when appropriate) for categorical variables and by the Kruskal-Wallis test for continuous variables.
Individual risk factors and postal-code district related socioeconomic factors and their associations with ILI: Relative risks for ILI will be estimated by Poisson regression with robust error variance. To deal with possible confounding, all variables found to differ significantly in univariable analyses between participants with and without ILI will be included in the multivariable, multilevel mixed-effects generalised linear model.
Individual risk factors and postal-code district related socioeconomic factors and their associations with influenza-vaccination: Relative risks for influenza vaccination will be estimated by Poisson regression with robust error variance. To deal with possible confounding, all variables found to differ significantly in univariable analyses between participants with and without influenza vaccination will be included in the multivariable, multilevel mixed-effects generalised linear model.
Model checking: The Pearson and deviance goodness-of-fit tests will be performed to assess the fit of the data to a Poisson distribution in the final regression models. Furthermore, the distributions of the deviance residuals will be analysed.
Sensitivity analyses: The final regression models will be repeated after exclusion of outliers in the dataset and with changing some of the underlying baseline assumptions (depends on the variables to be included).
Influenza transmission
The combined analysis of the viral sequencing data, the metadata from the Statistics Office of the Canton Basel-City, and the two questionnaires is done using phylodynamic methods. The data collected in the questionnaires filled out by the patients is cleaned up and processed analogue to the data in the Household survey section.
In phylodynamics, the transmission chain between hosts is reconstructed using the sequenced influenza genomes. We assume that two hosts with very similar viral genomes are close to each other in the transmission chain, whereas two hosts which have very distanced viral genomes are far apart in the transmission chain. The reconstructed transmission chain is typically incomplete, as we cannot capture every single case in a city and the direction of transmission is not fully clear. We employ and extend the available phylodynamic framework within BEASTv222 to allow the transmission rate to depend on host factors such as age, family status or socioeconomic characteristics. We aim to quantify the transmission rates as a function of the host factors. Intuitively, if say many adults cluster in the phylogeny, this indicates frequent ongoing transmission between adults, while if adults occur in children clades, this indicates frequent transmission from children to adults.
Determination of herd immunity in health individuals
The herd immunity estimates per urban quarter as percentage above a sero-protection threshold is visualised using GIS mapping as previously described. The distribution of herd immunities in urban quarters will be correlated with incidence rates of influenza and transmission patterns.
Strength and limitations
Retrospective PCR-confirmed influenza cases
From 2013 to 2018 all available cases are included. However, the included PCR-confirmed cases do not represent every single influenza case in the city. Many cases either presented at a family physician not participating in our study, or did not receive a diagnosis to confirm the viral infections. The number of ILI cases in the population is estimated to be 4%–5% by the Federal Office of Public Health (http://www.bag.ch)—this would correspond to between 7000 and 8700 cases in the city of Basel. Based on our experience from the emergency department, around 50% of ILI cases can be attributed to influenza viruses. Therefore, we would expect around 3500 to 4300 PCR-confirmed influenza cases. To capture every single case of influenza will not be possible.
Prospective household survey
Given the distribution of the foreign-born or persons in the urban quarter who speak other languages than German (table 2), the Basel Cantonal Statistics Office provides the total number of households to be surveyed and the number of households that should receive questionnaires in the major foreign languages (table 3). Nevertheless, a language bias is likely induced into the questionnaire as not every spoken language could be captured with the questionnaire. Data entry and data handling errors can almost be excluded. In population (census) surveys performed by the Federal Office of Statistics of Switzerland, a 6% error margin is usually expected.
Table 3.
Number of households to be surveyed in selected urban quarters and languages provided
| Number of private households | Questionnaires needed when return rate 12% | German, English, Italian |
Serbo- Croatian |
Albanian | Turkish | Household/questionnaire ratio | Distribution Each household |
Every other household | Every third household | |
| Kleinhüningen | 1291 | 2469 | x | x | x | x | 0.52 | x | ||
| Klybeck | 3506 | 2886 | x | x | x | x | 1.21 | x | ||
| Matthäus | 8012 | 3055 | x | x | x | x | 2.62 | x | ||
| St. Johann | 9180 | 3073 | x | x | 2.99 | x | ||||
| Iselin | 8860 | 3069 | x | x | x | x | 2.89 | x | ||
| Gotthelf | 3764 | 2906 | x | 1.30 | x | |||||
| Am Ring | 5456 | 2991 | x | 1.82 | x | |||||
| Bachletten | 6710 | 3028 | x | 2.22 | x | |||||
| Gundeldingen | 10 085 | 3084 | x | x | x | x | 3.27 | x | ||
| Bruderholz | 4038 | 2924 | x | 1.38 | x | |||||
| Total | 29 485 | 14 563 | 14 563 | 20 542 |
Finally, for logistic and cost reasons, we cannot distribute the household survey to all 19 official urban quarters but focus our questionnaire on 10 selected quarters. Although this might induce a certain selection bias, we feel that the included quarters reflect the diversity similar in a representative number. Also, the questionnaires distributed and received per quarters allows us to perform a statistical representative analysis.
Prospective study of influenza transmission
The prospective trial aims to include as many influenza infected patients as possible. The recruitment is distributed at sites with large influenza case numbers. However, recruitment may have introduced a certain bias of study participants. Some patients will not present at a physician or emergency ward and therefore will not be diagnosed but still contribute to the transmission chain. This may be particularly true for children, where PCR-based influenza diagnostics is rarely used.
Prospective measurement of antibody titres in healthy individuals
The measurement of herd immunity per quarter is based on the recruitment of healthy blood donors. The study participants may not reflect the average citizen of Basel.
Discussion
Profound knowledge on the key geographical, epidemiological and immunological factors influencing influenza transmission in a city will significantly help to develop effective counter measurements. The project is performed during the several subsequent years and large interconnected datasets are collected. The retrospective study parts clearly will show typical bias of a retrospective analysis such as missing data. In the prospective study part, the questionnaire may have a reply bias in the sense that influenza and vaccine interested people are more likely to respond. In addition, during patient recruitment not all influenza cases will be captured by the study. In the prospective study part, we include patients with ILI and use in a second step a PCR to confirm an influenza infection. However, as with the retrospective study, not all patients with influenza infection can be captured within a city as only symptomatic and patients presenting at the family doctor will be included.
We have recently finished the recruitment for the study and started with data analysis and manuscript writing. We expect that results will be available by end of 2019.
Ethics and dissemination
The results of this study will be published in peer-reviewed medical journals.
We plan to present the results of this research project at national and international scientific meetings. We aim to publish our results in open-access journals so they are widely available to interested international audiences. We aim to make our sequencing data available to the research community so that distribution of viruses can be assessed on both a national and international level.
Supplementary Material
Acknowledgments
We would like to thank the clinical trial unit (Karin Wild and Silke Puschke) for organisational help with the prospective study part. Finally, we thank the family doctors for helping in the patient recruitment: Dr Schneider and Dr von Hornstein, Gundeldingen. Gemeinschaftspraxi Dornacherstrasse, Gundeldingen (Drs Bruger, Eggenschwilder, Wyss Lustenberger, Gessler, Nonnemacher). Praxisgemeinschaft Bruderholz (Drs Dreyfus and Gürke), Bruderholz. Dr Marti, Bachletten. Praxis Büdnerhof (Drs Müller, Peters and Hantke), Büdnerhof. Dr Banderet and Dr Malè, Iselin. Drs Legendre and Legendre, St. Johann. Davidsbodenpraxis (Drs Hug and Isay-Utzinger), St. Johann. Praxis Dr Bär (Drs Bär and Türkoglu), St. Johann. Hammerpraxis (Professor Zeller), Matthäus. Dr Gordon and Dr Landolt, Clara. Dr Buess, Am Ring.
Footnotes
TS and RS-S contributed equally.
Contributors: Author contributions: AE, MBa, RSS and TS planned the study and reviewed the paper. AE drafted the first version paper. DW, DMM and HMBSS advised on sequencing methodology. DW, HMBSS, TS and NM advised on phylogenetic analysis and reviewed the paper. NA, MB, JB (Geography) generate GIS maps. AE, DV, YH, ER, OD, MN, AZ, STS, CHN, AB, NR and NM provide data and samples. AE, NG, CS, TV and RSS planned and conducted the questionnaire. DV and MS organised biobanking, CS, MB, TV, MS, NG, NAS, TS and RSS performed data entry.
Funding: This work is supported by the Swiss National Science Foundation (interdisciplinary research grant CR32I3_166258/1; www.snsf.ch) and a grant by the Freiwillige Akademische Gesellschaft, Basel (www.fag.ch). AE received a salary grant by the Swiss National Science Foundation (Ambizione PZ00P3_154709 /1).
Map disclaimer: The depiction of boundaries on the map(s) in this article do not imply the expression of any opinion whatsoever on the part of BMJ (or any member of its group) concerning the legal status of any country, territory, jurisdiction or area or of its authorities. The map(s) are provided without any warranty of any kind, either express or implied.
Competing interests: None declared.
Patient consent for publication: Not required.
Ethics approval: The study is approved by the regional ethical review board (Project-ID 2015–363 and 2016-01735).
Provenance and peer review: Not commissioned; externally peer reviewed.
References
- 1. Stockton J, Ellis JS, Saville M, et al. Multiplex PCR for typing and subtyping influenza and respiratory syncytial viruses. J Clin Microbiol 1998;36:2990–5. [DOI] [PMC free article] [PubMed] [Google Scholar]
- 2. Thai PQ, Mai LQ, Welkers MRA, et al. Pandemic H1N1 virus transmission and shedding dynamics in index case households of a prospective Vietnamese cohort. J Infect 2014;68:581–90. 10.1016/j.jinf.2014.01.008 [DOI] [PMC free article] [PubMed] [Google Scholar]
- 3. Ziegler T, Hall H, Sánchez-Fauquier A, et al. Type- and subtype-specific detection of influenza viruses in clinical specimens by rapid culture assay. J Clin Microbiol 1995;33:318–21. [DOI] [PMC free article] [PubMed] [Google Scholar]
- 4. McCrone JT, Woods RJ, Martin ET, et al. Stochastic processes constrain the within and between host evolution of influenza virus. Elife 2018;7 10.7554/eLife.35962. [Epub ahead of print: 03 May 2018]. [DOI] [PMC free article] [PubMed] [Google Scholar]
- 5. Houghton R, Ellis J, Galiano M, et al. Haemagglutinin and neuraminidase sequencing delineate nosocomial influenza outbreaks with accuracy equivalent to whole genome sequencing. J Infect 2017;74:377–84. 10.1016/j.jinf.2016.12.015 [DOI] [PubMed] [Google Scholar]
- 6. Pagani L, Thomas Y, Huttner B, et al. Transmission and effect of multiple clusters of seasonal influenza in a Swiss geriatric hospital. J Am Geriatr Soc 2015;63:739–44. 10.1111/jgs.13339 [DOI] [PMC free article] [PubMed] [Google Scholar]
- 7. Valley-Omar Z, Nindo F, Mudau M, et al. Phylogenetic exploration of nosocomial transmission chains of 2009 influenza A/H1N1 among children admitted at red cross war Memorial children's Hospital, Cape town, South Africa in 2011. PLoS One 2015;10:e0141744 10.1371/journal.pone.0141744 [DOI] [PMC free article] [PubMed] [Google Scholar]
- 8. Virk RK, Gunalan V, Lee HK, et al. Molecular evidence of transmission of influenza A/H1N1 2009 on a university campus. PLoS One 2017;12:e0168596 10.1371/journal.pone.0168596 [DOI] [PMC free article] [PubMed] [Google Scholar]
- 9. Ghedin E, Sengamalay NA, Shumway M, et al. Large-Scale sequencing of human influenza reveals the dynamic nature of viral genome evolution. Nature 2005;437:1162–6. 10.1038/nature04239 [DOI] [PubMed] [Google Scholar]
- 10. Bloom-Feshbach K, Alonso WJ, Charu V, et al. Latitudinal variations in seasonal activity of influenza and respiratory syncytial virus (RSV): a global comparative review. PLoS One 2013;8:e54445 10.1371/journal.pone.0054445 [DOI] [PMC free article] [PubMed] [Google Scholar]
- 11. Sammon CJ, McGrogan A, Snowball J, et al. Factors associated with uptake of seasonal and pandemic influenza vaccine among clinical risk groups in the UK: an analysis using the general practice research database. Vaccine 2012;30:2483–9. 10.1016/j.vaccine.2011.11.077 [DOI] [PubMed] [Google Scholar]
- 12. Tamerius JD, Shaman J, Alonso WJ, et al. Environmental predictors of seasonal influenza epidemics across temperate and tropical climates. PLoS Pathog 2013;9:e1003194 10.1371/journal.ppat.1003194 [DOI] [PMC free article] [PubMed] [Google Scholar]
- 13. Walter D, Böhmer MM, Heiden Mander, et al. Monitoring pandemic influenza A(H1N1) vaccination coverage in Germany 2009/10 - results from thirteen consecutive cross-sectional surveys. Vaccine 2011;29:4008–12. 10.1016/j.vaccine.2011.03.069 [DOI] [PubMed] [Google Scholar]
- 14. Yu H, Alonso WJ, Feng L, et al. Characterization of regional influenza seasonality patterns in China and implications for vaccination strategies: spatio-temporal modeling of surveillance data. PLoS Med 2013;10:e1001552 10.1371/journal.pmed.1001552 [DOI] [PMC free article] [PubMed] [Google Scholar]
- 15. Wüthrich D, Lang D, Müller NF, et al. Evaluation of two workflows for whole genome sequencing-based typing of influenza A viruses. J Virol Methods 2019;266:30–3. 10.1016/j.jviromet.2019.01.009 [DOI] [PubMed] [Google Scholar]
- 16. Kaufmann L, Syedbasha M, Vogt D, et al. An optimized hemagglutination inhibition (HI) assay to quantify Influenza-specific antibody titers. J Vis Exp 2017. 10.3791/55833. [Epub ahead of print: 01 Dec 2017]. [DOI] [PMC free article] [PubMed] [Google Scholar]
- 17. Vaux S, Van Cauteren D, Guthmann J-P, et al. Influenza vaccination coverage against seasonal and pandemic influenza and their determinants in France: a cross-sectional survey. BMC Public Health 2011;11:30 10.1186/1471-2458-11-30 [DOI] [PMC free article] [PubMed] [Google Scholar]
- 18. Raude J, Setbon M. Predicting the lay preventive strategies in response to avian influenza from perceptions of the threat. PLoS One 2011;6:e24943 10.1371/journal.pone.0024943 [DOI] [PMC free article] [PubMed] [Google Scholar]
- 19. Böhmer MM, Walter D, Müters S, et al. Seasonal influenza vaccine uptake in Germany 2007/2008 and 2008/2009: results from a national health update survey. Vaccine 2011;29:4492–8. 10.1016/j.vaccine.2011.04.039 [DOI] [PubMed] [Google Scholar]
- 20. Böhmer MM, Walter D, Krause G, et al. Determinants of tetanus and seasonal influenza vaccine uptake in adults living in Germany. Hum Vaccin 2011;7:1317–25. 10.4161/hv.7.12.18130 [DOI] [PubMed] [Google Scholar]
- 21. Dunlop S, Coyte PC, McIsaac W. Socio-Economic status and the utilisation of physicians' services: results from the Canadian national population health survey. Soc Sci Med 2000;51:123–33. 10.1016/S0277-9536(99)00424-4 [DOI] [PubMed] [Google Scholar]
- 22. Bouckaert R, Heled J, Kühnert D, et al. Beast 2: a software platform for Bayesian evolutionary analysis. PLoS Comput Biol 2014;10:e1003537 10.1371/journal.pcbi.1003537 [DOI] [PMC free article] [PubMed] [Google Scholar]
Associated Data
This section collects any data citations, data availability statements, or supplementary materials included in this article.
Supplementary Materials
bmjopen-2019-030913supp001.pdf (947.8KB, pdf)
bmjopen-2019-030913supp002.pdf (918.4KB, pdf)