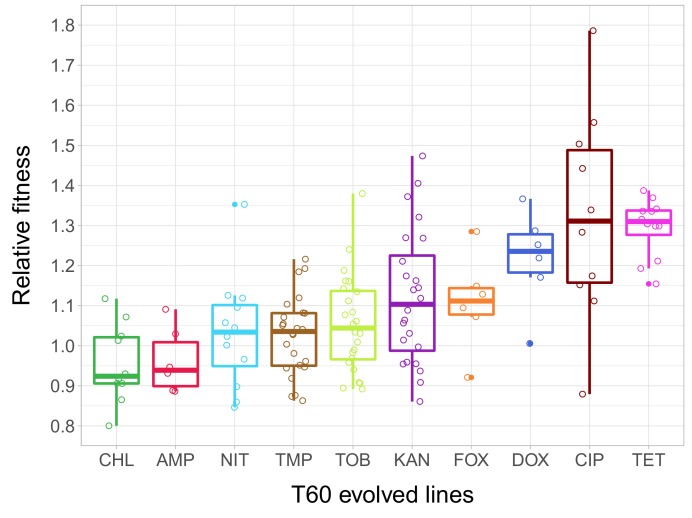
Figure 2. Relative fitness of the T60 evolved lines.
The figure shows the relative fitness of 6 parallel lines of 23 antibiotic-adapted strains (T0) after laboratory evolution in an antibiotic-free medium. Relative fitness was calculated by normalizing the T60 fitness to the fitness of the corresponding T0 antibiotic-resistant strain. Fitness was measured as the area under the growth curve in an antibiotic-free medium. Relative fitness varied significantly across populations initially resistant to different antibiotics (N = 138, p<0.0001, Kruskal–Wallis test). For antibiotic abbreviations, see Table 1. Boxplots show the median, first and third quartiles, with whiskers showing the 5th and 95th percentiles of the relative fitness of all T60 evolved lines originally adapted to different antibiotics. Individual data points represent the median relative fitness of each of the 138 T60 evolved lines (3 biological and five technical replicates per each). Source file is available as Figure 2—source data 1.

