Abstract
Electrophoresis has demonstrated utility as tool for screening of small molecule modulators of protein-protein interactions and enzyme targets. Screening of large chemical libraries requires high throughput separations. Such fast separation can be accessed by microchip electrophoresis. Here, microchip gel electrophoresis separations of proteins are achieved in 2.6 s with 1,200 V/cm and 3 mm separation lengths. However, such fast separations can still suffer from limited overall throughput from sample introduction constraints. Automated introduction of microfluidic droplets has been demonstrated to overcome this limitation. Most devices for coupling microfluidic droplets to microchip electrophoresis are only compatible with free solution separations. Here, we present a device that is compatible with coupling droplets to gel and free-solution electrophoresis. In this device, automated sample introduction is based on a novel mechanism of carrier phase separation using the difference in density of the carrier phase and the running buffer. This device is demonstrated for microchip gel electrophoresis and free solution electrophoresis separations of protein-protein interaction and enzyme samples, respectively. Throughputs of about 10 s per sample are achieved and over 1,000 separations are demonstrated without reconditioning of the device.
Keywords: Microfluidics / Microfabrication, Capillary electrophoresis / Electrophoresis, proteins, droplets
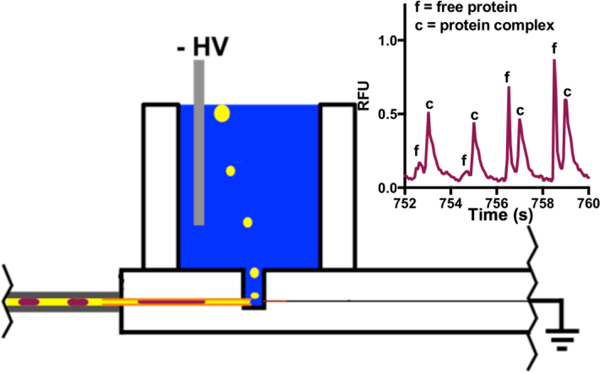
Graphical Abstract
Introduction
Capillary electrophoresis (CE) has demonstrated potential in screening for modulators of enzymes and protein-protein interactions [1,2]. While many screening targets are enzymatic, recent successes in targeting protein-protein interactions have led to increased interest in screening for modulators of them. [3] An advantage of CE is low false positive rates in screening [4] because it directly detects reactants and products and discriminates against potential sources of interference including optically active test compounds, non-specific protein aggregation and test compound precipitation [2,4,5]. It also requires minimal alteration of reactants so that there is less chance for off-target effects. Although CE has these advantages, to reach throughputs compatible with screening large chemical libraries, rapid separations are required. Microchip electrophoresis (MCE) can provide separations on the milliseconds timescale by free-solution electrophoresis [6] and seconds by gel electrophoresis [7]; however, one of the biggest challenges to achieving high-throughput electrophoresis is attaining sample introduction rates commensurate with this separation speed. For MCE, samples are typically manually loaded into reservoirs on the device limiting the actual throughput achievable for large numbers of samples. One exception is the commercial LabChip instrument (Perkin Elmer). This instrument introduces samples to a microchip directly from a multiwell plate, affording a throughput of about 1 min per sample per channel. In this work, we describe a system that has potential for higher throughput from nanoliter samples in a droplet format. The system is compatible with both gel and free solution electrophoresis as demonstrated for separations of protein-protein complexes and enzyme reaction mixtures.
Several methods of using droplet microfluidics for automated sample introduction in microchip or capillary electrophoresis have been reported [8–13]. In these methods, samples are contained within nanoliter volume aqueous droplets segregated from one another by an immiscible carrier phase. The low volume droplets are sequentially transferred to an aqueous separation channel for electrophoresis. This strategy can provide rapid, sequential, and automated sample introduction; however, such systems must avoid injection of immiscible, non-conductive segmenting liquid in the separation channel since these fluids may cause electroosmotic flow instability and plug formation leading to open circuits and dielectric device breakdown [8,9,14].
Approaches for introducing droplet samples without allowing segmenting phase into the electrophoresis channel have relied on surface patterning [8,9,13,15], modified channel geometries [16], use of an oleophilic membrane [16], or spontaneous injection [17]. These methods provide analysis times as short as 2 s/sample [18]; however, most such methods are not compatible with gel electrophoresis because they require electroosmotic flow which is greatly suppressed in gel electrophoresis. This is limiting because gel electrophoresis is particularly useful for PPI assays and other samples where size-based separation is effective. Only one droplet microfluidic system has previously been demonstrated to be compatible with microchip gel electrophoresis [16]. In that case, an oleophilic membrane was used to extract the carrier phase from the droplet stream while the entire droplet was injected into the separation channel. This device provided 60 s separations per sample, quantitative sample transfer, and automated injection; however, separation resolution was sacrificed due to injection of relatively large sample volumes.
Here, we report a chip for coupling droplets to MCE based on a novel mechanism of separating carrier fluid from sample based on their differential density. The system is compatible with both gel and free solution MCE, allows controlled injection size, and rapid separations with high efficiency. The compatibility of the device design with both free-solution and gel electrophoresis allows for diverse application without any modification to the device. For example, protein-protein complexes can be reliably separated under gel electrophoresis conditions [19], whereas free solution electrophoresis is suitable for enzymatic assays among other applications. To demonstrate this utility, the system is coupled to separation of a free protein from its protein complex by gel electrophoresis and from the substrate and product of an enzymatic reaction using free solution electrophoresis. The model systems used have previously been well-characterized by CE [4,18,20]. Here, microchip gel electrophoresis separations of proteins are fast (2.6 s). The speed is a significant improvement over our previously reported 1.25 min/sample separation for such samples [19] and the resolving power for standard proteins is superior to previous reports of sieving electrophoresis in comparable times [21]. The utility of the device is demonstrated for both enzyme and protein-protein interaction (PPI) samples at a throughput of ~10 s per sample with multiple injections per sample.
Experimental
Chemicals and Materials
Benchmark™ fluorescent protein standard ladder was purchased from Life Technologies (Carlsbad, CA). Chemicals and reagents were purchased from Sigma-Aldrich, Saint Louis, MO, unless otherwise stated.
Device Fabrication
Microfluidic devices were fabricated from glass slides (Telic Company, Valencia, CA) by photolithography and etching with hydrofluoric acid as previously described [22–24]. For the capillary insertion channel, both top and bottom slides were etched to 75 µm depth. For separation channels, the top slide was etched to 8.8 µm depth. Access holes were drilled in the top slide with 400 µm drill bits (Kyocera Precision Tools, Henderson, NC). Both slides were aligned under microscope such that insertion channels on each slide were flush. Chips were thermally annealed at 610 ˚C for 8 h. Subsequently, reservoirs and fused silica capillary 150 µm o.d. 75 µm i.d. (Polymicro Technologies; Phoenix, AZ) were secured to the device using Loctite Epoxy Marine (Loctite, Düsseldorf, Germany). The outlet of the fused silica capillary was approximately 300 µm from the sampling channel.
Microchip Operation
For imaging, an Olympus IX71 (Tokyo, Japan) fluorescence microscope was used. For all other experiments a previously described in-house epiilumination laser-induced fluorescence (LIF) detector was used. [12] A 488 nm laser (CrystaLaser, Reno, NV) was used for excitation with emission filtered through a 520 nm filter. During operation, nitrogen was flowed across the bottom of the chip to promote heat dissipation. Data were analyzed using Cutter 7.0 [25] and Graphpad Prism 7.
Microchip Gel Electrophoresis
For gel electrophoresis, microchips were conditioned sequentially with 1 M sodium hydroxide, water, ultratrol LN (Target Discovery, Palo Alto, CA) and water by pulling vacuum at the waste reservoir. Rain-X (ITW Global Brands, Houston, TX), a consumer grade water repellant, was then pulled through the fused silica capillary by applying vacuum at the sample reservoir for 1 min. Next, all channels were filled with air by applying vacuum until all channels were observed to be empty. Finally, gating and sample reservoirs were filled with sieving matrix and vacuum was applied at the waste reservoir to fill all channels with gel. Sieving matrix used was 90 mM Tris 100 mM borate, 1 mM EDTA, 13.8 mM sodium dodecyl sulfate (SDS), 3.5% dextran (1,500–2,800 kDa). Gated injections [6] were carried out for 100 ms, except for protein standard ladder which was injected for 200 ms. Separations were at 1,200 V/cm except for protein standard ladder which was at 800 V/cm. Detection was at 3 mm downstream of the injection cross, unless otherwise stated.
Free-solution Microchip Electrophoresis
For free-solution electrophoresis, Rain-X was pulled by vacuum through the fused silica transfer capillary for 1 min to coat the inner surface of the capillary and facilitate droplet transfer. Reservoirs were filled with 10 mM sodium tetraborate, 0.9 mM 2-hydroxypropyl-β-cylcodextrin, pH 10 and vacuum was applied at the waste reservoir for at least 5 min to fill all channels with this buffer. For separation, 800 V/cm was applied with 100 ms gated injections every 900 ms. The separation length to detector was 3 mm.
Droplet Generation and Introduction to Microchip
Approximately 5 nL volume droplets were generated from a multiwell plate into 360 µm o.d. 150 µm i.d. PFA Plus teflon tubing (Idex Health & Science, Oak Harbor, WA), as previously described [26], with the following exceptions: a flow rate of 0.3 µL/min was used and the carrier phase was silicone oil (10 cSt). The train of droplets was connected to the microchip by threading the 150 µm o.d. fused silica capillary into the lumen of the teflon tubing. The junction was secured using Loctite Marine Epoxy to prevent leaking.
Droplet Analysis of Enzyme Samples
Sirtuin 5 (SIRT5) was expressed and purified as previously described [12]. Enzymatic reactions were carried out using purified protein as previously described [12]. Briefly, the substrate peptide, based on succinate dehydrogenase protein, GGQSLK[succ]FGKG was labeled with 5-carboxyfluorescein (GenicBio Limited, Shanghai, China). Desuccinylation with SIRT5 yields GGQSLKFGKG product. SIRT5 reactions were carried out in 10 µL of 45 nM SIRT5, 1 µM substrate peptide, 10 mM Tris, 1 mM 1,4-dithiothreitol, 0.5 mM NAD+, 4.5 % (v/v) glycerol, 30 mM NaCl, and 2 mM sodium phosphate. Reactions were allowed to proceed for 15 min prior to quenching with 45 µL of free solution electrophoresis buffer (described above). Samples were analyzed by electrophoresis allowing detection of both substrate and product.
Droplet Analysis of Protein-Protein Interaction Samples
Proteins were expressed, purified, and labeled as previously described [18,20]. Hsp70-Alexafluorophore 488 (Hsp70*) and Bag3 samples were prepared in 25 mM HEPES, 10 mM KCl, 5 mM MgCl2, 10 mM ATP, pH = 7.5. Proteins were cross-linked as previously described [19]. Test compounds (JG-258 [27], JG-231 [28], JG-311, rolitetracyline, YM-01 [29], and JG-98 [27]) were assayed at 10 µM against 1 µM Bag3 and Hsp70*. The negative control test compounds was JG-258 (a compound that has been previously demonstrated not to affect the Hsp70-Bag3 complex [27]) and the positive control sample was prepared by addition of assay buffer in the place of Bag3. Internal standard (1 µM fluorescein) was added to alternating samples. Samples were prepared as described before [19]. Briefly, proteins and inhibitors were allowed to equilibrate at the desired concentrations for at least 15 min. Proteins were cross-linked by adding glutaraldehyde at a final concentration of 2% for 10 s prior to quenching with Tris to a final concentration of 400 mM. SDS was added to each sample at a final concentration of 0.2%w/v SDS.
Results and Discussion
Fast Microchip Gel Electrophoresis.
Rapid separations are essential to achieving high throughput screening by electrophoresis. As previously reported, sieving separations in entangled polymer media are well-suited for resolving protein-protein complexes; however, previous work only achieved separation times of 60 s in capillaries [19]. Microchip electrophoresis allows short separations lengths and high electric fields to be readily accessed enabling decreased separation times relative to conventional CE.
We first established conditions for rapid sieving separations on microchips. Figure 1 demonstrates the separation of standard protein ladder in less than 2.6 s by SDS-microchip gel electrophoresis. The 70 consecutive injections and separations overlaid in figure 1 were collected in 196 s. Overlapping injections were used to minimize separation time and maximize the number of injections per droplet sample. In this approach, injections and separations are overlapped such that the peaks from the first injection migrate past the detector after the second injection has been made. Migration times were relatively reproducible over the 70 injections, for example, a 0.05 s shift in migration time was observed for the 40 kDa protein. Relative peak heights were within a percent RSD of <10%. Resolution of 5.3 between standard 21 and 63 kDa proteins was achieved in this case. This result can be compared to previous work which reported a separation time of 2.7 s with resolution of 1.66 between 22 and 67 kDa proteins. [21] The higher resolution achieved here is attributed to the longer separation length and higher electric field along with differing sieving media and device material. This high-speed will enable higher throughput for screening of PPIs. The higher resolution, in principle, allows more challenging screens, such as protein complexes with smaller molecular weight shifts or samples with multiple complexes.
Figure 1.
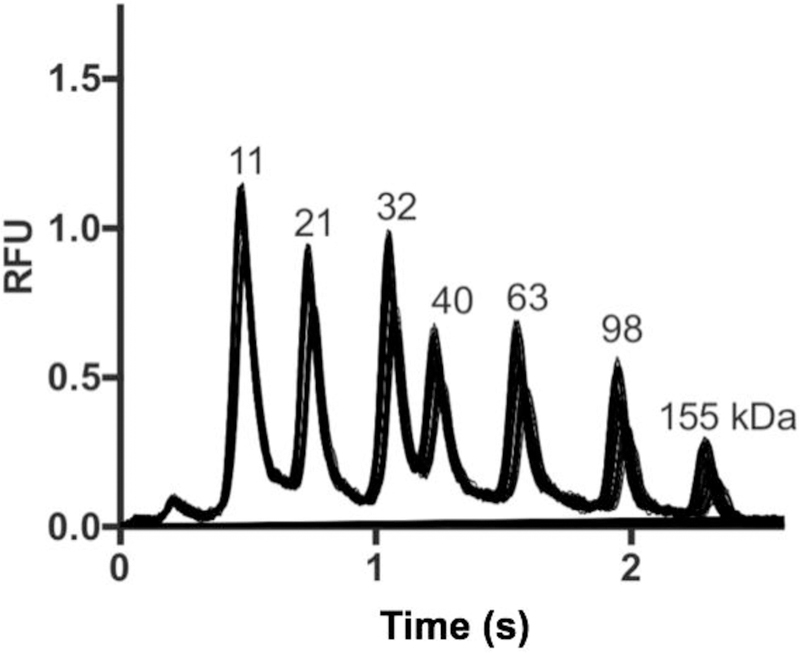
SDS-microchip gel electrophoresis separation of 11, 21, 32, 40, 63, 98 and 155 kDa standard protein ladder on microchip with 70 consecutive separations over 196 s overlaid. Separation length was 3 mm, electrokinetic injection time was 200 ms, separation time was 2.6 s and electric field was 800 V/cm.
While several reports of rapid gel electrophoresis separations exist [7,21,30] none have demonstrated sample introduction throughput and stability needed to fully take advantage of such rapid separations. Previously, throughputs of ~1 min/sample were achieved for separation of standard protein ladders using commercial CE [20] and microchip instrumentation [30]. To take advantage of the rapid separation reported here automated sample introduction is required. In this work we evaluated a novel droplet sample introduction method for microchip gel electrophoresis to address this issue.
Density-Based Oil Drain for Injection of Droplet Samples for Microchip Gel Electrophoresis.
For these experiments, removal of oil from the droplet train was performed by taking advantage of the difference in density of the segmenting phase (ρoil) and the background electrolyte (ρBGE). Silicone oil was chosen as the segmenting phase for its relatively low density (0.93 g/mL). Other lower density oils, such as light mineral oil caused difficulties in droplet generation likely due to relatively higher viscosity (data not shown).
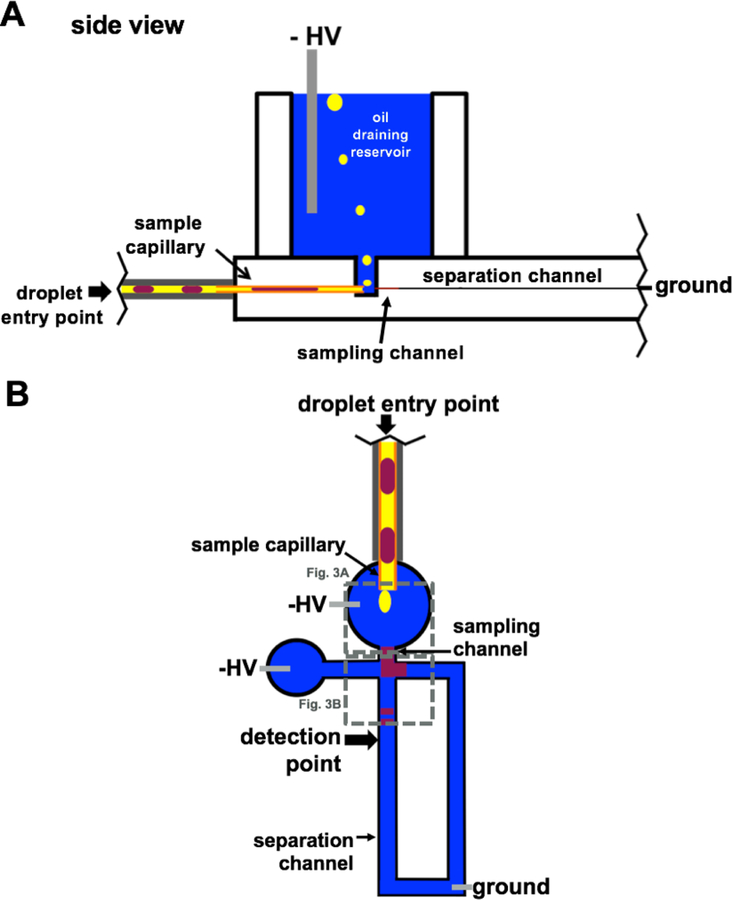
In this system (Figure 2), the train of droplets is driven into the microchip via syringe pump. Droplets first enter the fused silica transfer capillary which directs the droplets into the area beneath a reservoir filled with background electrolyte. As the droplet train flows into the device, the segmenting phase, which is immiscible with and less dense than the background electrolyte, pools at the outlet of the transfer capillary and floats to the top of the buffer-containing reservoir after a sufficient volume (approximately 30 nL) has accumulated at the outlet. This observation is consistent with the net buoyancy force (Fnet) being able to overcome the force of gravity (g) once a certain volume of oil displaces the running buffer (Vdisplaced) at the outlet of the transfer capillary:
| (Eq 1) |
Figure 2.
Schematic of cross-section (A) and top-down view (B) of density-based oil drain microchip. Nanoliter volume droplets are pumped into the device (purple) and the low-density segmenting phase (yellow) drains to the top of the buffer filled reservoir (blue) where high voltage (HV) is applied. Aqueous droplets merge with the buffer and analytes are electrophoresed toward grounded reservoir (not shown).
With this design a stable electrophoresis current was obtained, and no oil was observed to enter the separation channel. High voltage is continuously applied at the oil removal reservoir such that upon exiting the transfer capillary the droplet coalesces with the background electrolyte and the analytes are electrophoresed toward the grounded waste reservoir (Figure 3A). Importantly, the outlet of the droplet transfer capillary and the inlet of the sampling channel are on the same plane such that the analytes migrate a short distance to enter the sampling channel. This geometry was designed to minimize diffusion prior to electrophoresis, nevertheless some dilution of the sample is inevitable as it crosses from transfer channel to the MCE sampling channel. After analytes enter the sampling channel, they migrate to the injection cross where gated injection affords control of injection size. As sample reaches the injection cross, multiple discrete injections can be made from each sample droplet (Figure 3B). Multiple injections per droplet allow for averaging of signal across multiple electropherograms. In this design, the number of injections made from each droplet depends upon how long the droplet sample is present in the sampling channel and how frequently the injections are made. These times in turn depend upon the volume of the droplet, the flow rate of transfer, the separation time, and the electric field applied.
Figure 3.
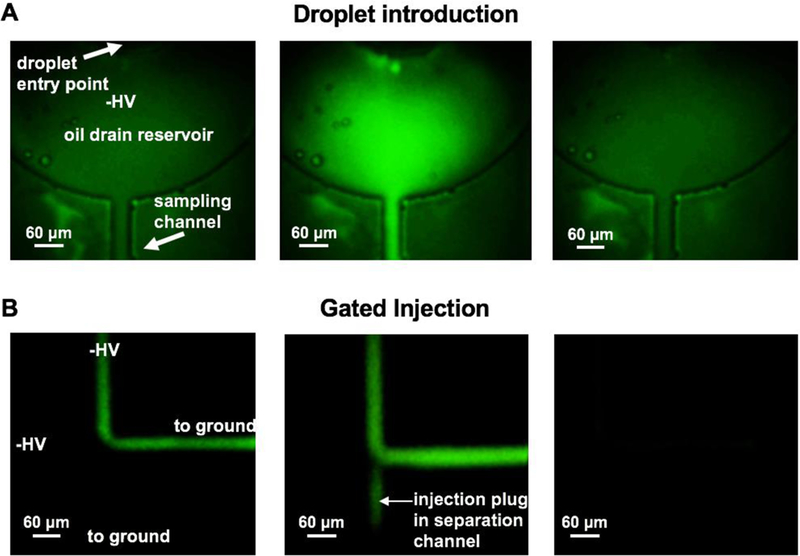
Fluorescence imaging of droplet introduction. (A) Before droplet enters the reservoir (1), as droplet arrives from the transfer capillary it fills the reservoir and is electrophoresed into the sampling channel (2), and finally the droplet clears (3). As droplets enter the sampling channel (B), they are gated away from the electrophoresis channel by negative high voltage (HV,1), then injected (2) and finally cleared as the droplet is washed out. Imaging of droplet exiting transfer capillary (A) and sample gating (B) were taken from separate droplets, time in A does not correlate with time in B. Scale bar corresponds to 60 µm.
Figure 4 illustrates the detector signal from a series of injections obtained as an array of ~5 nL droplets containing 2 µM FITC-insulin were pumped into the chip at 0.3 μL/min and injections were made at 1.3 s intervals. Under these conditions, we typically obtained about 5 injections that contained some signal from a given droplet. Injection volumes were ~40 pL, corresponding to 5% of separation channel volume. As shown, discrete sets of peaks are observed for each droplet; however, the peak height varies across each droplet. This variation may be attributed to dilution of the sample droplet when it was released from the oil and began mixing with the surrounding aqueous buffer. Essentially the rapid electrophoresis traces allow the sampling of the droplet as it enters and exits the sampling capillary. Increasing droplet volume may allow for more injections of equivalent peak heights, however, droplet splitting was observed when increased volume droplets were used.
Figure 4.
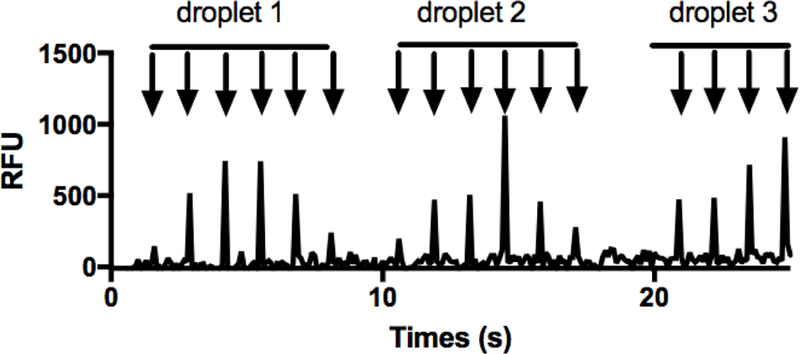
Signal from droplet introduction for microchip gel electrophoresis immediately downstream of injection cross. Injections of 2 µM FITC-insulin were carried out every 1.3 s with detection directly downstream of injection cross. Injection time was 100 ms and the electric field was 1,200 V/cm. Each peak (indicated with arrow) corresponds to a single injection.
The electric field that is applied controls the time required for a sample droplet to clear the injection cross. To facilitate rapid clearing of samples and subsequently maximize throughput, the highest accessible electric field is preferred. In this system, for microchip gel electrophoresis, the maximal electric field allowed without causing detrimental heating effects was determined by Ohm’s plot to be approximately 1,200 V/cm (see Electronic Supplementary Material (ESM) Fig. S1). This high electric field was used for all further experiments.
Microchip Gel Electrophoresis of Droplets.
To determine if the density oil drain was compatible with the fast microchip gel electrophoresis separation of protein-protein interaction samples, droplets containing Hsp70* and Bag3 were generated and analyzed. The cross-linked protein-protein complex (Hsp70*-Bag3) could be separated in 2 s by microchip gel electrophoresis (Figure 5). For comparison, separation of the same protein complex from free protein (Hsp70*) has been completed in 3 min using CZE [4] and 1.25 min by CGE separation after protein cross-linking [19].
Figure 5.
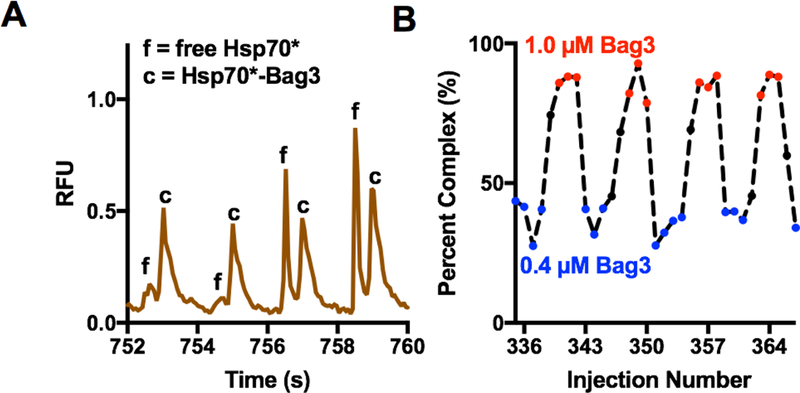
Electrophoresis and performance of density-based oil drain for analysis of Hsp70*-Bag3 samples by microchip gel electrophoresis. (A) Four concatenated sample electropherograms, taken from the trace in ESM Fig. S2A, for separation of Hsp70* (f) from Hsp70*-Bag3 complex (c). (B) Quantification of relative percent Hsp70*-Bag3 complex present in each electropherogram. Red indicates 1 µM Bag3 and blue indicates 0.4 µM Bag3.
To determine how the device would perform for multiple samples, 175 droplets with 1 µM Hsp70* and alternating concentrations of Bag3 (1 µM and 0.4 µM) were introduced into the device (Figure 5A, B). Hsp70-Bag3 complex has a relatively high affinity with a Kd value of 25 nM [20], therefore 1 µM and 0.4 µM Bag3 in the presence of Hsp70 is expected to result in differing degrees of complex formation. Trace 5B illustrates the change in bound and free peaks that are detected corresponding to samples with high to low Bag3 concentrations. As discussed above, the peak height varies for injections across the same droplet (Figure 4). To account for this variation, the complex peak area was quantified as a percentage of total peak area from each electropherogram (ESM Fig. S2). A total of 630 separations were obtained from the 175 sample droplets without reconditioning the device, the largest number attempted. Resolution of 1.3 was achieved for the separation of free Hsp70* and Hsp70*-Bag3 complex, this is comparable to previous work which achieved a resolution of 1.3 with a 1 min separation [19]. A throughput of approximately 10 s/sample was obtained here. This is an improvement in separation throughput of 30-fold and a sample throughput improvement of 6-fold compared to a previous droplet-microchip gel electrophoresis device. The oil drain system described here was also more suitable for long term operation as the previous work was shown to have decreased performance over just three separations [16].
Alternation in samples entering the chip was evident from quantifying the percent complex for each sample (Figure 5). A signal to noise ratio of 26 was achieved for the Hsp70* peak in the presence of 0.4 µM Bag3. In the transition between high and low Bag3 concentration, some data points corresponding to intermediate complex were observed before the complex area stabilized (Figure 5B). This result may be attributed to the discontinuous nature of the droplet injection and mixing between droplets. One possible source of carry-over is the fused silica transfer capillary. In future device designs this could be eliminated allowing direct transfer of droplets from the Teflon tubing to the oil removal reservoir. Another possibility is that sample does not completely clear the injection cross before the next sample enters. This effect could potentially be mitigated with larger spacing between droplets, the incorporation of dedicated wash droplets, smaller volume droplets, or higher electric fields. Nevertheless, injections resulting from clearing between samples may be easily detected. The average and standard deviations of complex peak area (percent of complex peak area relative to total of complex and free peak areas) for the high and low Bag3 concentrations was 86 ± 5% and 35 ± 7%, respectively. This is in good agreement with the expected percent complex values of 85% and 38% based on the Kd.
The system was then tested for the ability to detect presence of PPI inhibitors in samples, as required for a screen. For our test screen, samples contained Hsp70* and Bag3 at 1 µM and inhibitors at 10 µM. The inhibitors tested were JG-231, JG-311, rolitetracycline, YM-01, and JG-98. They have previously been found to inhibit the binding of Hsp70 to Bag3 by flow cytometry protein interaction assay (FCPIA) [4,20]. During screening, it is necessary to be able to track when new samples enter the injection region of the chip so that electropherograms in a long train can be attributed to the proper sample. A rapidly migrating fluorescent marker compound (fluorescein), easily resolved from the proteins, was added to alternating samples to enable such tracking. The alternating addition of internal standard results in a sinusoidal pattern for peak area of internal standard (Figure 6A) which can be used to track samples. This approach was similar to what had been used for screening of enzyme inhibitors in free solution chip electrophoresis [12].
Figure 6.
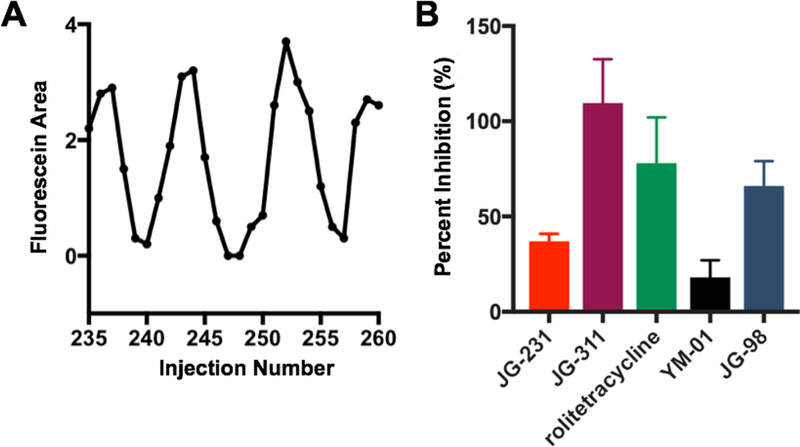
Demonstration of small molecule Hsp70-Bag3 screening using density drain microchip. Indexing of samples using fluorescein as internal standard (IS) (A). Percent inhibition determined for droplet samples containing potential small molecule Hsp70*-Bag3 interaction inhibitors (B). Hsp70* and Bag3 concentrations were both 1 µM and fluorescent inhibitors were assayed at 10 µM. Error bars are for n = 3 injections (from 3 droplets) for each sample.
To analyze results, fluorescein, Hsp70* and Hsp70*-Bag3 peaks are integrated by batch processing in Cutter 7.0. The presence or absence of a fluorescent marker peak is used to correlate the electropherograms back to the location on the multiwell plate where the sample was generated. The set of test compounds was bracketed by positive (no Bag3) and negative control (JG-258, a compound known to not affect the complex [28], ESM Fig. S3). Presence of inhibitors are expected to yield a decrease of Hsp70*-Bag3 complex and increase in free Hsp70*. The amount of complex formed was quantified by taking the complex peak area as a percentage of the complex and free peak areas. This calculation corrects for laser source instability and any injection variation. The calculated percentage is then normalized to the results for the positive and negative controls to give the percentage inhibition (Figure 6B) according to the following equation where A is the relative area of the complex peak.
| (Eq. 2) |
Reduced complex formation was detected for all known Hsp70*-Bag3 interaction inhibitors. Interestingly, large differences in the degree of inhibition by these compounds was detected, with JG-311 and JG-98 exhibiting the greatest inhibition. This observation is in agreement with the report that JG-311 and JG-98 have lower IC50 values than rolitetracycline, YM-01 and JG-231 [4,27].
Free-Solution Microchip Electrophoresis of Droplets.
To determine if the density-based oil drain device was compatible with free-solution microchip electrophoresis, we used the system for a Sirtuin 5 assay. SIRT5 is, to date, the only known enzyme for lysine desuccinylation [31], regulating the mitochondrial lysine succinylome [32]. SIRT5 has been demonstrated as responsible for cancer cell growth in non-small cell lung cancer [33] and is therefore an interesting screening target. For these experiments, we used succinylated peptide (labeled with fluorophore) as substrate. This peptide, which is based on succinate dehydrogenase, is desuccinlyated by Sirtuin 5 [18]. Droplets of alternating sample content (with and without enzyme) were generated and electrophoresed (Fig. 7; ESM Fig. S4). A total of 1,250 separations were performed without reconditioning of microchip with 160 sample droplets analyzed. The average reaction yield measured for the sample containing enzyme was 49 ± 5 % across all droplets analyzed, which is expected based on the kinetics of the reaction (Figure S-5).
Figure 7.
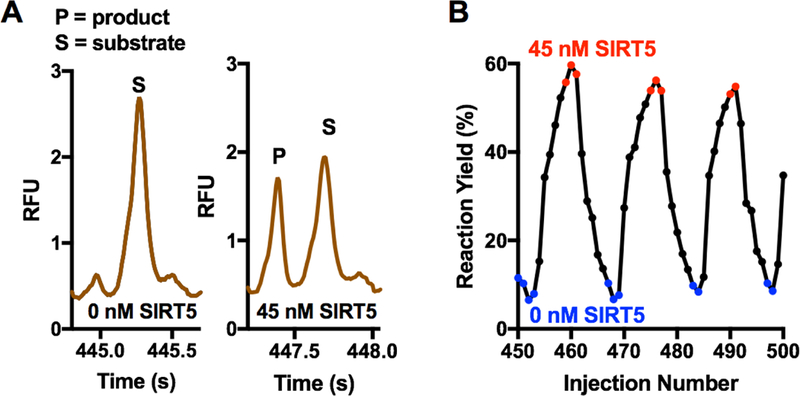
Electrophoresis and performance of density-based oil drain for analysis of SIRT5 reaction samples by free-solution microchip electrophoresis. (A) Raw trace collected for individual electropherograms, taken from the trace in ESM Fig. S4A, showing an example with 45 nM SIRT5 and no SIRT5. (B) Selection of a sequence of yields from electropherograms to better illustrate the transition from 0 to 45 nM SIRT5. Red indicates data from electropherograms of samples with 45 nM SIRT5 (red) and blue indicates no SIRT5. These colors correspond to the colored points in ESM Fig. S4. Electropherograms from transition between droplets are in black.
This separation was previously reported for screening of SIRT5 modulators using a hybrid PDMS-glass device with droplets extracted from the aqueous stream at the interface to the PDMS [18]. A throughput of ~10 s/sample was obtained using the density-based oil drain in comparison to the reported throughput of 2 s/sample reported with the hybrid PDMS-glass device [18]. Resolution of 1.8 was achieved here while a resolution of 2.5 was reported previously [18]. Separation time of 900 ms was achieved compared to a 250 ms separation time reported previously when a shorter separation length and higher field were employed. These differences were attributed to condition differences. Chips were etched to 8.8 µm whereas in previous report chips were etched to 3 µm. This lower depth allowed for higher fields to be applied without detrimental heating effects, however, fabrication of the density-based oil drain requires fewer steps and requires fewer connections compared to the hybrid device design. Further, this result demonstrates the versatility of the density-based interface of droplets for microchip electrophoresis, i.e. the system works for fast separations by both gel and free-solution electrophoresis.
Limitations and Considerations.
Several limitations inherent to the density-based oil drain device exist including sensitivity to sample matrix, decreased signal compared to bulk injection methods, and limited compatible carrier phases. The performance of this device is dependent on the droplet sample matrix. Salty sample matrices will increase conductivity of the background electrolyte causing an increase in current over continuous operation of the chip. This is a limitation of all currently reported devices for coupling droplets to electrophoresis. This limits device application either to low numbers of salty droplet samples or to samples where the sample matrix matches the background electrolyte. Automated refreshing of buffer reservoirs can alleviate this consideration.
An approximately 10-fold lower signal was observed when introducing samples via nanoliter volume droplets compared to introducing samples by manually filling a reservoir with microliter volumes of the same sample (Figure 8). This result may be attributed to dilution of the droplet sample in background electrolyte upon introduction to the device. It may be possible to engineer the system with smaller distances between droplet exit and entrance onto the electrophoresis chip to reduce this dilution. High electric fields are also expected to minimize the dilution effect by minimizing time before the injection cross. While the dilution effect may be difficult to fully eliminate quantification can be achieved using an internal standard within each electropherogram or by using peak area ratios.
Figure 8.
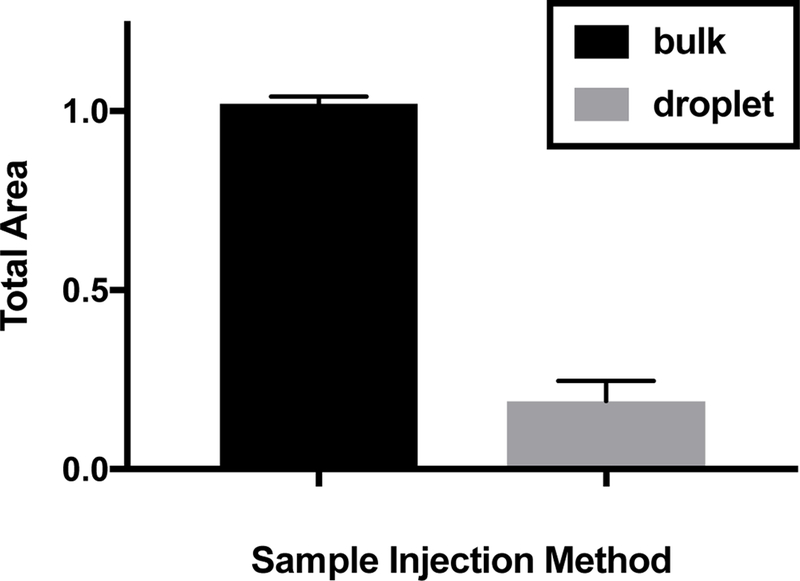
Comparison of signal obtained from injection of bulk sample to injection from droplet samples containing 500 nM Hsp70* diluted in water. Error bars are standard deviation for n = 3 injections.
The current design is limited to use with carrier phases with lower density than the background electrolyte. Often fluorinated carrier phases are preferred in droplet microfluidics for their inert properties and low partitioning of many analytes. Fluorinated carrier phases have relatively high densities which would allow them to be separated from a lower density background electrolyte by modification of the current device design. This is appealing for future applications of this device where molecules that are soluble in silicone oil may transfer between droplets.
Conclusions
This work demonstrated a novel method for coupling droplets to microchip separations by removing the carrier phase based on its density. The density-based oil drain was compatible with both sieving and free solution electrophoresis with throughput of about 10 s/sample. Interference of segmenting oil with electrophoresis was not observed for up to 175 samples analyzed. Similar to other devices, the operation is sensitive to sample matrix effects, limiting the number of samples that can be analyzed without reconditioning. The utility of this device was demonstrated for protein-protein interaction and enzyme assay samples suggesting future utility in screening of diverse targets.
Supplementary Material
Acknowledgement.
This work was supported by NIH R01GM102236 (RTK) and the American Chemical Society Division of Analytical Chemistry Graduate Fellowship sponsored by Eli Lilly and Company (CMO). The authors gratefully acknowledge Jason Gestwicki, Hao Shao, and Jennifer Rauch of the University of California-San Francisco for providing inhibitors and proteins used in this work.
Footnotes
Publisher's Disclaimer: This Author Accepted Manuscript is a PDF file of a an unedited peer-reviewed manuscript that has been accepted for publication but has not been copyedited or corrected. The official version of record that is published in the journal is kept up to date and so may therefore differ from this version.
Compliance with Ethical Standards
The authors declare no conflict of interest in this work.
References
- 1.Ouimet CM, D’Amico CI, Kennedy RT. Advances in Capillary Electrophoresis and the Implications for Drug Discovery. Expert Opin Drug Discov [Internet]. Taylor & Francis; 2017;12(2):213–24. [DOI] [PMC free article] [PubMed] [Google Scholar]
- 2.Perrin D, Frémaux C, Shutes A. Capillary microfluidic electrophoretic mobility shift assays: application to enzymatic assays in drug discovery. Expert Opin Drug Discov [Internet] 2009;15:51–63. [DOI] [PubMed] [Google Scholar]
- 3.Wells JA, McClendon CL. Reaching for high-hanging fruit in drug discovery at protein–protein interfaces. Nature [Internet] 2007;450(7172):1001–9. [DOI] [PubMed] [Google Scholar]
- 4.Rauch JN, Nie J, Buchholz TJ, Gestwicki JE, Kennedy RT. Development of a capillary electrophoresis platform for identifying inhibitors of protein-protein interactions. Anal Chem 2013;85(20):9824–31. [DOI] [PMC free article] [PubMed] [Google Scholar]
- 5.Perrin D, Frémaux C, Scheer A. Assay Development and Screening of a Serine/Threonine Kinase in an On-Chip Mode Using Caliper Nanofluidics Technology. J Biomol Screen [Internet] 2006;11(4):359–68. [DOI] [PubMed] [Google Scholar]
- 6.Jacobson SC, Hergenroder R, Koutny LB, Ramsey JM. High-speed Separations. Anal Chem 1994;66(7):1114–8. [Google Scholar]
- 7.Lo CT, Throckmorton DJ, Singh AK, Herr AE. Photopolymerized diffusion-defined polyacrylamide gradient gels for on-chip protein sizing. Lab Chip 2008;8(8):1273–9. [DOI] [PubMed] [Google Scholar]
- 8.Roman GT, Wang M, Shultz KN, Jennings C, Kennedy RT. Sampling and electrophoretic analysis of segmented flow streams using virtual walls in a microfluidic device. Anal Chem 2008;80(21):8231–8. [DOI] [PMC free article] [PubMed] [Google Scholar]
- 9.Wang M, Roman GT, Perry ML, Kennedy RT. Microfluidic chip for high efficiency electrophoretic analysis of segmented flow from a microdialysis probe and in vivo chemical monitoring. Anal Chem 2009;81(21):9072–8. [DOI] [PMC free article] [PubMed] [Google Scholar]
- 10.Niu XZ, Zhang B, Marszalek RT, Ces O, Edel JB, Klug DR, et al. Droplet-based compartmentalization of chemically separated components in two-dimensional separations. Chem Commun (Camb) [Internet] 2009;(41):6159–61. [DOI] [PubMed]
- 11.Pei J, Nie J, Kennedy RT. Parallel electrophoretic analysis of segmented samples on chip for high-throughput determination of enzyme activities. Anal Chem 2010;82(22):9261–7. [DOI] [PubMed] [Google Scholar]
- 12.Guetschow ED, Steyer DJ, Kennedy RT. Subsecond Electrophoretic Separations from Droplet Samples for Screening of Enzyme Modulators. Anal Chem 2014;86:10373–9. [DOI] [PMC free article] [PubMed] [Google Scholar]
- 13.Delamarre MF, Shippy SA. Development of a Simplified Microfluidic Injector for Analysis of Droplet Content via Capillary Electrophoresis. Anal Chem 2014;86:10193–200. [DOI] [PubMed] [Google Scholar]
- 14.Edgar JS, Pabbati CP, Lorenz RM, He M, Fiorini GS, Chiu DT. Capillary electrophoresis separation in the presence of an immiscible boundary for droplet analysis. Anal Chem 2006;78(19):694–54. [DOI] [PMC free article] [PubMed] [Google Scholar]
- 15.Austin C, Pettit SN, Magnolo SK, Sanvoisin J, Chen W, Wood SP, et al. Fragment screening using capillary electrophoresis (CEfrag) for hit identification of heat shock protein 90 ATPase inhibitors. J Biomol Screen 2012;17(7):868–76. [DOI] [PubMed] [Google Scholar]
- 16.Niu X, Pereira F, Edel JB, Demello AJ. Droplet-interfaced microchip and capillary electrophoretic separations. Anal Chem 2013;85(18):8654–60. [DOI] [PubMed] [Google Scholar]
- 17.Li Q, Zhu Y, Zhang N-Q, Fang Q. Automatic Combination of Microfluidic Nanoliter-Scale Droplet Array with High-Speed Capillary Electrophoresis 2016;6:26654. [DOI] [PMC free article] [PubMed] [Google Scholar]
- 18.Guetschow ED, Kumar S, Lombard DB, Kennedy RT. Identification of sirtuin 5 inhibitors by ultrafast microchip electrophoresis using nanoliter volume samples. Anal Bioanal Chem [Internet] 2016;1–11. [DOI] [PMC free article] [PubMed]
- 19.Ouimet CM, Dawod M, Grinias J, Assimon VA, Lodge J, Mapp AK, et al. Protein cross-linking capillary electrophoresis at increased throughput for a range of protein – protein interactions. Analyst. Royal Society of Chemistry; 2018;143:1805–12. [DOI] [PMC free article] [PubMed] [Google Scholar]
- 20.Ouimet CM, Shao H, Rauch JN, Dawod M, Nordhues BA, Dickey CA, et al. Protein Cross-linking Capillary Electrophoresis for Protein-Protein Interaction Analysis. Anal Chem 2016;88(16):8272–8. [DOI] [PMC free article] [PubMed] [Google Scholar]
- 21.Nagata H, Tabuchi M, Hirano K, Baba Y. High-speed separation of proteins by microchip electrophoresis using a polyethylene glycol-coated plastic chip with a sodium dodecyl sulfate-linear polyacrylamide solution. Electrophoresis 2005;26:2687–91. [DOI] [PubMed] [Google Scholar]
- 22.Harrison DJ, Fluri K, Seiler K, Fan Z, Effenhauser CS, Manz A. Micromachining a Miniaturized Capillary Electrophoresis-Based Chemical Analysis System on a Chip. Science (80- ) 1993;261(5123):895–7. [DOI] [PubMed] [Google Scholar]
- 23.Roper MG, Shackman JG, Dahlgren GM, Kennedy RT. Microfluidic Chip for Continuous Monitoring of Hormone Secretion from Live Cells Using an Electrophoresis-Based Immunoassay. Anal Chem 2003;75(18):4711–7. [DOI] [PubMed] [Google Scholar]
- 24.Simpson PC, Woolley AT, Mathies R a. Microfabrication technology for the production of capillary array electrophoresis chips. Biomed Microdevices 1998;1(12):7–26. [Google Scholar]
- 25.Shackman JG, Watson CJ, Kennedy RT. High-throughput automated post-processing of separation data. J Chromatogr A 2004;1040(2):273–82. [DOI] [PubMed] [Google Scholar]
- 26.Chabert M, Dorfman KD, De Cremoux P, Roeraade J, Viovy JL. Automated microdroplet platform for sample manipulation and polymerase chain reaction. Anal Chem 2006;78(22):7722–8. [DOI] [PubMed] [Google Scholar]
- 27.Li X, Srinivasan SR, Connarn J, Ahmad A, Young ZT, Kabza AM, et al. Analogues of the allosteric heat shock protein 70 (Hsp70) inhibitor, MKT-077, as anti-cancer agents. ACS Med Chem Lett 2013;4(11):1042–7. [DOI] [PMC free article] [PubMed] [Google Scholar]
- 28.Shao H, Li X, Moses MA, Gilbert LA, Kalyanaraman C, Young ZT, et al. Exploration of Benzothiazole Rhodacyanines as Allosteric Inhibitors of Protein − Protein Interactions with Heat Shock Protein 70 (Hsp70) 2018;70. [DOI] [PMC free article] [PubMed] [Google Scholar]
- 29.Koren J, Miyata Y, Kiray J, O’Leary JC, Nguyen L, Guo J, et al. Rhodacyanine derivative selectively targets cancer cells and overcomes tamoxifen resistance. PLoS One 2012;7(4). [DOI] [PMC free article] [PubMed] [Google Scholar]
- 30.Bousse L, Mouradian S, Minalla a., Yee H, Williams K, Dubrow R. Protein sizing on a microchip. Anal Chem 2001;73(6):1207–12. [DOI] [PubMed] [Google Scholar]
- 31.Du J, Zhou Y, Su X, Yu JJ, Khan S, Jiang H, et al. Sirt5 Is a NAD-Dependent Protein Lysine Demalonylase and Desuccinylase. Science (80) 2011;334(6057):806–9. [DOI] [PMC free article] [PubMed] [Google Scholar]
- 32.Park J, Chen Y, Tishkoff DX, Peng C, Tan M, Dai L, et al. SIRT5-Mediated Lysine Desuccinylation Impacts Diverse Metabolic Pathways. Mol Cell. Elsevier Inc; 2013;50(6):919–30. [DOI] [PMC free article] [PubMed] [Google Scholar]
- 33.Lu W, Zuo Y, Feng Y, Zhang M. SIRT5 facilitates cancer cell growth and drug resistance in non-smal cell lung cancer. Tumor Biol 2014;10699–705. [DOI] [PubMed]
Associated Data
This section collects any data citations, data availability statements, or supplementary materials included in this article.


