

Summary
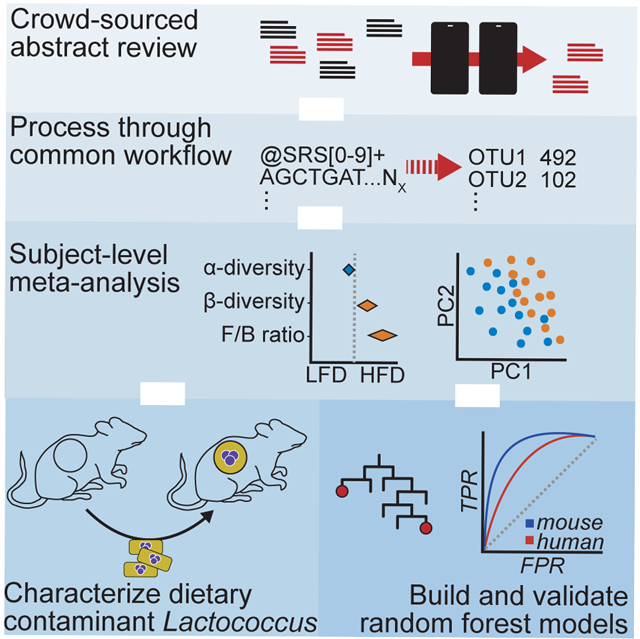
Multiple research groups have shown that diet impacts the gut microbiome; however, variability in experimental design and quantitative assessment have made it challenging to assess the degree to which similar diets have reproducible effects across studies. Through an unbiased subject-level meta-analysis framework, we re-analyzed 27 dietary studies including 1101 samples from rodents and humans. We demonstrate that a high-fat diet (HFD) reproducibly changes gut microbial community structure. Finer taxonomic analysis revealed that the most reproducible signal of a HFD are Lactococcus species, which we experimentally demonstrate are common dietary contaminants. Additionally, a machine learning approach defined a signature that predicts the dietary intake of mice and demonstrated that phylogenetic and gene-centric transformations of this model can be translated to humans. Together, these results demonstrate the utility of microbiome meta-analyses in identifying robust and reproducible features for mechanistic studies in preclinical models.
Keywords: Microbiome, Meta-analysis, High-fat diet, Murine
Graphical Abstract
Introduction
Numerous studies have evaluated the impact of macronutrient intake on community composition of the distal gut microbiota (Turnbaugh, 2017). Perhaps, the most often-studied dietary intervention is the consumption of a high-fat diet (HFD) given evidence for a causal role of HFD-induced shifts in the gut microbiota in multiple disease models (Turnbaugh et al., 2008; Upadhyay et al., 2012). Despite the use of murine models, which have more homogeneous gut microbiota than human populations, many reports are qualitative in nature, and a lack of quantitative definition directly limits understanding of what signals are reproducible across studies.
This lack of definition is emblematic of the broader “reproducibility crisis” in scientific literature (Baker, 2016), wherein technical and/or biological inconsistencies between studies can complicate interpretation of the effect, or lack thereof, of diet on a given phenotype of interest (in this particular case, gut microbial community structure). On shallow examination, many studies appear to examine the same variables and outputs; however, this is often not the case. Differences between studies likely reflect a complex interaction between the specific diet formulations used, the host species, use of gnotobiotic models, animal vendor, and technical differences in how the microbiota is profiled (Sinha et al., 2017). Scientific meta-analysis can help to address these discrepancies in an unbiased manner, providing a stronger foundation for follow-up studies (Gurevitch et al., 2018).
Here, we present the results of a large-scale meta-analysis of sequencing-based studies investigating the effect of HFD on the gut microbiome in murine models. We also re-analyze data from two human dietary intervention studies (David et al., 2013; Wu et al., 2011). Despite major differences in experimental design, we are able to identify microbial signatures that are consistent and predictive of HFD intake. Utilizing consistent computational tools across datasets, this analysis partially accounts for interstudy differences and employs the statistical power of the collected studies to define a reproducible molecular signal indicative of the response to HFD feeding and demonstrate translatability to humans.
Results
Study selection and characteristics.
427 unique studies were retrieved by our search methodology (Figure 1A). 11 reviewers working in the microbiome field and who were familiar with relevant terminology and methodology, redundantly reviewed the studies to determine the relevance of study design and methodology for inclusion. Of these 427 studies, 79 studies were chosen through a web-based crowd-sourced consensus to be eligible for this meta-analysis. Of these 79 studies, 44 lacked clear information regarding a specific, public location of sequencing data. Of the remaining 35 studies, 10 lacked metadata sufficient for pairing sequencing data to diet. This left 25 murine studies for inclusion in our meta-analysis. Two additional human studies were identified to examine translatability of mouse studies to humans (David et al., 2013; Wu et al., 2011). As a case study in the difficulties of obtaining data post-publication, a highly relevant manuscript was published during the course of review without publicly available metadata. Over the course of 35 days we attempted to contact the corresponding author via email and phone but did not obtain a response. Relevant per-study descriptions and metadata are listed in Table S1. These studies encompassed 1073 murine samples (477 HFD, 596 LFD), and 29 human samples (14 HFD, 15 LFD).
Figure 1. Study characteristics.

(A) A total of 427 studies were identified for potential inclusion of which 25 murine studies were ultimately selected. (B) Macronutrient composition (by % kCal) of studied HFD and LFD diets demonstrates diets are generally isocaloric in protein content while there is great variability in what fat content is considered high (linked diets represent those used in the same study). (C) Sample breakdown by sequencing strategy, platform, variable region and host strain demonstrate that Illumina sequencing of the V4 hypervariable region of the 16S rRNA gene in C57BL/6 hosts are most common
Studies varied significantly by dietary fat content, immediately suggesting that a portion of variability is likely due to lack of specificity surrounding terminology. The range of reported dietary fat across all groups was 4.4-65% kCal (Figure 1B). Furthermore, the range of fat composition that constituted a LFD or a “control” diet and a HFD varied significantly. The range of fat content in LFD was 4.4-24% but this nearly overlapped HFD (27.1-65%). The majority of studies varied dietary fat at the expense of carbohydrate content (range 11-80%). On the other hand, protein content was more consistent across most studies (range 13%-48%).
Studies also varied considerably in technical considerations including: sequencing strategy, platform, variable regions, and host strain (Figure 1C), in addition to study size and sequencing depth (Figure S1AB). The majority of samples were derived from outbred and C57BL/6 mice profiled via V4 16S rRNA amplicon sequencing on an Illumina-platform sequencer. Raw reads were obtained on a per sample basis for 1101 samples from the NCBI Sequence Read Archive (SRA) and/or MGRAST where they were consistently processed for closed-reference OTU picking against the 13-8 Greengenes release. A total of 29,937 OTUs were observed across all samples before any form of filtering or quality control.
Effect of HFD on microbial diversity.
We calculated common metrics for alpha diversity: Chao1 richness, Shannon's diversity, and Faith's phylogenetic diversity, and beta diversity: Bray-Curtis dissimilarity, weighted/unweighted UniFrac, Jensen-Shannon divergence, PhILR Euclidean distance (Silverman et al., 2017), and CLR Euclidean distance (i.e. Aitchison distance, (Gloor et al., 2017)). The ratio of the phyla Firmicutes and Bacteroidetes was also calculated due to its frequent use in the literature. To visualize the data and account for varied baseline states, all values were scaled to the geometric mean of LFD samples on a per-study basis. In visualizing these metrics, it is apparent that altered alpha diversity is not a consistent feature of HFD across all studies with considerable heterogeneity in the direction of effect observed (Figure 2A-C). Considering all studies together, there is a modest significant decrease in Chao1 richness (−0.215 [−0.270 to −0.159], P=8.73e-14), Shannon’s diversity (−0.048 [−0.084 to − 0.013], P=7.83e-3), and Faith’s phylogenetic diversity (−0.122 [−0.157 to −0.088], P=7.26e-12) (log2(fold change) [95% CI]). To consider dietary fat content as a continuous variable, we also examined the correlation between fat content and diversity (Figure S1C), finding no meaningful relationship (P≥0.05 Spearman’s Correlation).
Figure 2. Forest plot of commonly described community metrics in murine studies.

Measures of alpha diversity including (A) Chao1 richness, (B) Shannon's diversity, and (C) Faith's phylogenetic diversity demonstrate inconsistent effects of diet between studies. (D) The ratio of the Firmicutes phylum to the Bacteroidetes phylum is a consistent feature of the HFD. Points represent mean and 95% confidence interval (panels A-D, individual studies computed by Welch's t-test and combined by linear mixed effects model with study as random effect). Anhe 2015 was excluded from plotting due to n=2/group. (E) ADONIS tests of various distance metrics demonstrates consistent within-study effects on community composition as measured by the % variation explained (R2) by diet classification (Combined with study as stratum).
Next, the ratio of Firmicutes to Bacteroidetes was calculated and found to be consistently increased in 15 of 25 murine studies, which was supported statistically when all studies were considered in aggregate (log2FC=1.84 [1.65 to 2.03], P=3.4e-69). This trend is even apparent when visualized in the commonly reported phylum-level bar plot (Figure S1D). Unlike alpha diversity, the F/B ratio was significantly correlated with fat content (Figure S1C).
HFD reproducibly alters community composition.
We next employed visualization strategies and statistically tested the effect of HFD on community composition using principal coordinates analysis of multiple distance metrics with statistical testing via ADONIS (analysis of variance using distance matrices; Figure 2E, Figure 3). With the exception of Howe 2016, Hu 2015, and Lu 2017, which suffer from a lack of power (n=3/group), all remaining studies demonstrated a significant effect of diet on community composition (P<0.05, ADONIS), albeit with the variance explained ranging from 0.035 to 0.891 (R2). Due to matrix sparsity (96.7% zero-observations), significant distance saturation was observed when all studies were aggregated (Figure S2A), so only phylogeny-aware metrics were employed: weighted/unweighted UniFrac, and PhILR Euclidean (Figure 3), associated scree plot (Figure S2B). Clear visual clustering independent of study was observed; which was supported by ADONIS (P<0.001) for weighted and unweighted UniFrac, and PhILR Euclidean data types (R2=0.116, 0.049, 0.034 respectively). The interstudy-variation outweighed the effect of diet (R2=0.267-0.480, Table S2). These results were robust to multiple subsampling and subsampling depth (Data S1). Given the clear evidence for an underlying HFD-signal from multivariate analyses, we sought to further understand which specific features of the microbiota are responsive to diet intervention.
Figure 3. Principal coordinate analysis of conventional murine samples by diet (A) and study (B).

Ordination, where compositionally related samples are co-localized, provides clear visual evidence for a significant effect of study as well as an effect of diet composition (n=978 samples, P<0.001 ADONIS; Table S2).
Predictive microbial responses to HFD.
We used a random forest classifier to define reliable biomarkers of the gut microbial response to HFD. As a first pass, we conducted a leave-one-dataset-out analysis (Pasolli et al., 2016) in which each study using conventionally-colonized mice was systematically excluded from training and then subsequently predicted using the model (Figure S2C) demonstrating excellent reproducibility with a median area under the receiver curve (AUROC) of 0.93 (interquartile range=0.22) using OTU abundances.
Next, to minimize issues related to overfitting, we established 5 independent groups for training and validation: murine samples were randomly selected with two thirds of the resulting set used for training (Murine Training Set n=569) and one third for validation (Murine Test Set n=284). Next 3 randomly selected external validation sets were predicted whose samples were not used to inform the initial model (Everard 2014, Xiao 2015, and Evans 2014; External Murine Sample n=173) followed by Humanized Mice (n=46), and Human (n=29) samples. A summary of these datasets is provided in Table S3. The classifier was trained using dietary fat as a binary variable given the importance and commonality of this variable across studies.
Using only the Murine Training Set, 10-fold cross validation was applied to determine the optimal number of features included in the model required to minimize error rates. We noted that with even with as few as 4 OTUs (Figure S2D) classification error rates of <15% could be obtained, emphasizing the high predictive power of the top features. To visualize these, a phylogenetic tree of the 229 most-informative OTUs was created (Figure 4A). The most predictive OTUs belonged to the genus Lactococcus based on mean decrease in GINI coefficient (Figure S2E) which was significantly elevated in 14 of the examined murine studies and was significantly different in aggregate (Figure 4B). Given that the particular OTUs in question (716006 and 571744) mapped to Lactococcus lactis, we reasoned that this signal may represent contamination in the food rather than a response of the microbiota itself. While we and others have previously reported this possibility (Carmody et al., 2015; Dalby et al., 2017; Dollive et al., 2013), this highly reproducible finding across multiple labs and studies drove us to more definitively test this hypothesis.
Figure 4. A reproducible signature of the HFD-associated gut microbiome.

(A) Phylogenetic tree of informative OTUs (n=229) demonstrates highly informative clades of Lactococcus, Ruminococcaceae UCG-014 and Lachnospiraceae. Size of circle correlates with mean decrease GINI coefficient and data are colored by log2(fold change). (B) Lactococcus genus abundance across LFD and HFD groups reveals a significant increase in HFD diets (***P<0.001 linear mixed effect model with study as random effect). (C) Fecal bacterial DNA content (expressed as 16S rRNA gene copies/gram wet weight) in culture-negative germ-free mice on various diets (n=1 mouse per diet analyzed in triplicate; **P<0.01, ***P<0.001 ANOVA with TukeyHSD). (D) Microscopy reveals Gram-positive cocci within stool sample of culture-negative germ-free mice fed a high-fat diet 0. (E) Receiver operator curves for Lactococcus depleted OTUs, phylogenetic node balances (PhILR), KEGG orthologies (KO), and F/B ratio. Area under the receiver operator curve (AUROC) are provided in Table S5. (F) Area under the receiver operator curve (AUROC) by study excluding training samples demonstrates that PhILR and KO models are generalizable to most studies (abbreviations: ext - external murine sample, hum - human sample, humd-humanized murine sample). A subset of small studies with insufficient samples in the test set were removed from plotting. Rows are ordered by UPGMA clustering
We began by feeding 6 semi-purified diets and our standard chow diet to 7 germ-free adult mice housed in individual Techniplast gnotobiotic isolators. In contrast to our standard chow controls (LabDiet 5021) which does not contain detectable levels of background DNA, the feces of mice fed all tested semi-purified diets contained detectable microbial DNA content orders of magnitude higher than negative controls (Figure 4C). To attempt to identify the nature of the Lactococcus signal, we sequenced two near-full length 16S amplicons from the semi-purified diets TD.88137 and TD.05230, which were found to match the L. lactis OTUs we identified (>99.2% nucleotide identity to OTU 716006, Genbank Accessions MK248688 and MK248689). Reasoning that casein may be the source of contamination due to the use of Lactococcus in dairy processes, we analyzed regular, hydrolyzed, and ethanol washed casein finding microbial DNA content in all 3 preparations. A 1,000-fold reduction in ethanol washed casein (Figure S2F) was observed, suggesting ethanol washed casein may be appropriate as the basis for formulating diets for future studies as it may be easily substituted in custom diet formulation. Attempts to culture bacteria using multiple rich medias under aerobic and anaerobic conditions, as well as M17 Lactococcus selective media, failed despite the presence of cell morphologies consistent with intact Lactococcus cells in the feces of culture-negative germ-free mice (Figure 4D, TD.88137). Together, these results suggest that high levels of intact but likely dead bacterial cells are present in casein-containing HFDs.
To prevent Lactococcus from creating a false signal of HFD in the entirety of our meta-analysis, we stripped all OTUs descendent from the most recent common ancestor of named Lactococcus OTUs in Green Genes 13-8 tree (64 OTUs). We then replicated all aspects of the analysis to this point observing that our findings have been robust to the removal of Lactococcus (Data S1).
The classifier was retrained as before finding that 228 OTUs, 438 KOs, and 456 Phylogenetic Nodes could predict the training set with a 10.37%, 8.96%, and 9.49% error rate respectively. These OTUs were heavily enriched in 3 major clades of Lachnospiraceae, Ruminococcaceae, and S24-7 Muribaculaceae OTUs within the Bacteroidetes (Figure 4A). Receiver operator curves were contrasted against a simple logistic regression model using the F/B ratio (Figure 4E). The calculated area under the curves (AUROCs) are provided in Table S5 and on a per-study basis in Figure 4F excluding training samples. Likely due to data sparsity and interspecies variation in OTU content, the model trained on OTUs was capable of predicting murine samples (AUROC>0.91), but failed to translate to humanized mice and humans (AUROC<0.62). By contrast, PhILR and KO-transformed data, which reduce dimensionality but preserve phylogenetic signals and functional information, provided considerably improved performance for both humanized gnotobiotic mice and humans (AUROC>0.73, Table S5). In all cases, these data outperformed the ratio of Firmicutes to Bacteroidetes demonstrating that this reproducible feature of murine HFD is not necessarily translatable across species. Humanized mice were not better predictors of human diet than conventional mice; however, this may be a function of dataset size and limited diversity of studies as opposed to a reflection on underlying physiology (Data S1). Interestingly, the inclusion of Lactococcus in one of the models increased accuracy in predicting humans (Table S5), likely due to the consumption of cheese during HFD (David et al., 2013), highlighting that careful accounting of dietary microbes is necessary.
In considering the predictive performance of these models across studies (Figure 4F), it is apparent that these models are not heavily biased in favor of the prediction of only a minority subset of studies, but are generalizable across studies with the exception of the logistic model for F/B whose predictive performance mirrors the data presented in Figure 2D.
Discussion
We report the findings of a meta-analysis of murine microbiota-sequencing studies. Our results establish the effect of HFD on the gut microbiome in an effort to address reproducibility within the microbiome-diet field and identify targets around which to build future experimental work. Although we only examined 25 studies in detail, it is notable that this group of studies has a wide range of diets, size, sequencing technologies employed, targets of sequencing, and rodent models examined.
Interestingly, the F/B ratio is reproducibly increased following HFD feeding. This ratio was originally reported to be significantly increased in early studies of obesity (Ley et al., 2005; 2006), but is not a reproducible marker across human cohorts examining BMI (Finucane et al., 2014; Sze and Schloss, 2016). BMI and dietary feeding are two separate phenomena, and the implications of differing responses of the F/B ratio change in mice fed a HFD and obese humans is not clear. Recent work has indicated that the use of refined HFD relative to the more complex plant-polysaccharide-rich chow diets may be responsible (Dalby et al., 2017).
Our ability to translate mouse-derived higher-level abstractions of microbiota composition (PhILR and KEGG) data to human datasets demonstrates the utility of mouse research in understanding human communities, although it should be noted the actual strain, or species-level, representation across these communities shares little overlap. Future investigation will be required to understand the physiological implications of the phylogenetic clades and gene functions that we have correlated with dietary fat consumption.
Our findings also highlight the considerable technical and experimental variation across studies. Differences in sequencing methodology impact the taxonomic resolution with the potential to alter compositional profiles (Luo et al., 2012). There are also experimental variables not consistently reported with the potential to shift microbiota profiles such as animal handling policies and drinking water treatment that many researchers may be effectively blinded to. These collective variables contribute to what we term a “study effect” which has a major impact on microbial community composition (Table S2), but whose individual effects are difficult to estimate due to potential issues of multicollinearity among variables.
Given multivariate evidence of consistent microbiota features of HFD-response, we defined a core set of features for follow up experimental studies. We were surprised that given the very high number of OTUs identified across our meta-analysis (n=29,937), merely 228 OTUs readily discriminated between HFD and LFD fed states (0.76%). This relatively small subset provides unique experimental opportunities which can be further prioritized based on their relative contributions to the models (Table S4). A major next step would be to isolate representatives of each OTU or to identify isolates (Lagkouvardos et al., 2016) that have similar functional profiles to colonize gnotobiotic animals and explore their impact on growth under HFD conditions in a gnotobiotic model, although it should be noted it is probable that not every OTU will have a cultured or culturable representative.
We detected a strong signal generated by Lactococcus spp. Future studies should account for these, and other dietary contaminants, to prevent an artificial microbial signature of diet and consider avoiding formulations with a high Lactococcus- content. This is especially important as recent evidence suggests that non-viable Lactococcus cells can impact colonic inflammation (Ballal et al., 2015). Additional experiments are warranted to determine whether or not latent Lactococcus contamination in food is similarly able to alter host physiology.
There are several caveats worth noting. To render all datasets directly comparable, a closed reference OTU picking approach was applied which misses much of the resolution possible from denoised exact sequence variant-based approaches and may compress the true sample diversity (Amir et al., 2017; Edgar, 2016). This strategy also restricts the number of possible observed OTUs to only those within the 13-8 version of the Green Genes database (DeSantis et al., 2006). Furthermore, taxonomic assignment has been demonstrated to vary by length of sequencing product and variable region which inherently introduces and magnifies noise already present within these datasets (Edgar, 2017). Also, published research is biased towards those studies with positive results (Gurevitch et al., 2018), termed the “file drawer problem”. This is likely why 21 out of our 25 murine studies demonstrate some effect with respect to influence of HFD on beta-diversity.
The statistical power of our meta-analysis is also reduced by the large extent of missing data for published studies. While obesity and metabolic abnormalities have been linked to changes in gut microbiota, subject level metadata is not available from all studies for details regarding these variables, and as a result our analysis focuses primarily on dietary fat consumption. This brings to our attention that we are at a unique time in biology where significant quantities of data are being generated; making raw sequencing data and corresponding metadata readily available will enable secondary analyses aimed at unearthing biologic principles reproducible across laboratories. Finally, a limited number of relevant human controlled-feeding studies have been conducted and it is our hope to revisit these findings in the future as more studies become available.
Despite clear inter-study variation, and issues in reproducing simple ecological metrics, the intention of this analysis was to examine the consistent features of the murine gut microbiota's response to HFD to yield tangible targets for mechanistic studies. These results were generated from collective data across multiple laboratories and may be a robust foundation for future work geared on dissecting the links between shifts in microbial ecology, dietary intake, and the downstream consequences for host health and disease.
STAR METHODS
CONTACT FOR REAGENT AND RESOURCE SHARING
Further information and requests for resources and reagents should be directed to the Lead Contact Peter Turnbaugh (Peter.Turnbaugh@ucsf.edu).
EXPERIMENTAL MODEL AND SUBJECT DETAILS
Mice
All mouse studies were conducted under protocols AN170098 and AN170378 approved by the Institutional Animal Care and Use Committee at the University of California, San Francisco. Mice were bred and socially housed in sterile flexible film gnotobiotic isolators (Class Biologically Clean) with ALPHA-dri bedding and fed Lab Diet 5021 with a 12 hour light/dark cycle. Sterility was confirmed via aerobic and anaerobic culturing on a variety of rich media and through qPCR of the 16S rRNA gene. Prior to experiment, mice (female, aged 10-19 weeks) were transferred to individual Tecniplast rack-mounted isolators. Both BALB/c and C57BL/6J strains were studied. Animals were fed the following diets: LabDiet 5021 (C57BL/6J) and Envigo TD.05230 (BALB/c), TD.88137 (BALB/c), TD.160239 (C57BL/6J), TD.160153 (C57BL/6J), and TD.06414 (BALB/c).
METHOD DETAILS
Study Selection.
The following all encompassing search term was entered into PubMed and the NCBI Sequence Read Archive (SRA) in July 2017 to generate an unbiased representation of studies studying the effect of diet composition on the murine gut microbiome: “high fat diet”[All Fields] AND “microbiome”[All Fields] OR “high fat diet”[All Fields] AND “microbiota”[All Fields] OR “diet induced obesity”[All Fields] AND “microbiome”[All Fields] OR “diet induced obesity”[All Fields] AND “microbiota”[All Fields] OR “ketogenic diet”[All Fields] AND “microbiome”[All Fields] OR “ketogenic diet”[All Fields] AND “microbiota”[All Fields] OR “western diet”[All Fields] AND “microbiome”[All Fields] OR “western diet”[All Fields] AND “microbiota”[All Fields] OR (high-fat[All Fields] AND high-sugar[All Fields] AND (“diet”[MeSH Terms] OR “diet”[All Fields])) AND “microbiome”[All Fields] OR (high-fat[All Fields] AND high-sugar[All Fields] AND (“diet”[MeSH Terms] OR “diet”[All Fields])) AND “microbiota”[All Fields] OR ((“obesity”[MeSH Terms] OR “obesity”[All Fields]) AND promoting[All Fields] AND conditions[All Fields]) AND (“microbiota”[MeSH Terms] OR “microbiota”[All Fields]) OR ((“obesity”[MeSH Terms] OR “obesity”[All Fields]) AND promoting[All Fields] AND conditions[All Fields]) AND (“microbiota”[MeSH Terms] OR “microbiota”[All Fields] OR “microbiome”[All Fields]) OR ((microbiome[All Fields] OR microbiota[All Fields] OR microflora[All Fields] OR “microbial ecology”[All Fields]) AND (mouse[All Fields] OR murine[All Fields] OR “mus musculus”[All Fields]) AND (diet[All Fields]) AND (sugar[All Fields] OR high-sugar[All Fields] OR low-sugar[All Fields] OR fat[All Fields] OR high-fat[All Fields] OR low-fat[All Fields] OR ketogenic[All Fields]) AND (sequenc*[All Fields] OR 16S[All Fields] OR metagenom*[All Fields]) AND (fecal[All Fields] OR feces[All Fields] OR digest*[All Fields] OR gut[All Fields] OR intestin*[All Fields])).
The search yielded 427 potential studies for inclusion. To filter these studies on relevance, we employed a crowdsourcing approach wherein the studies were randomly distributed to 11 laboratory-based volunteers via a purpose-built web application AbstractReviewR (source code and reviewer instructions available: https://www.github.com/jbisanz/AbstractReviewR). Reviewers were provided the title, abstract, year, journal, and author list (as automatically retrieved from NCBI). Each study was reviewed by 2 adjudicators who were blinded to each other’s decisions. One author (VU) reviewed all abstracts and this vote was used to resolve a split decision. For a study to be included in the meta-analysis, reviewers were asked to ensure that the study was primary research including a sequencing methodology to study the distal gut microbiota in a rodent model with a high-fat and control group. Consensus conclusions were accepted with the exception of 6 studies that were included post-review due to clear relevance and available metadata and sequencing data.
Studies that fulfilled criteria for the meta-analysis were then evaluated for sample type. In the event that studies varied another variable besides diet (i.e. genetic manipulation, use of a probiotic, addition of a non-dietary based supplement etc.), samples were selected where dietary fat content was the principal variable modulated and controlled for, and all other samples were discarded. In the case of cross-sectional longitudinal sample collection, only end point samples were analyzed. In the case of interventional time-course, only baseline and endpoint samples were analyzed. Categorization of HFD or LFD was done on a per study basis; some studies had three diets that were studied, and the diet highest in fat or animal fat content was assigned the designation of HFD. During metadata review, an additional study was excluded due to not including a relevant LFD group and was counted as incomplete metadata.
Data Retrieval and OTU picking.
Sequence data was downloaded directly from the SRA and MGRAST by listed accessions Data S1. When only multiplexed runs were available, they were demultiplexed using either usearch -fastx_demux or custom code in R using the shortRead package. Other studies were retrieved from their respective lab repositories (https://gordonlab.wustl.edu/TurnbaughSE_10_09/STM_2009.html) but have been redeposited to the Sequence Read Archive under BioProject PRJNA482456.
Where paired reads were available, reads were overlapped using vsearch 2.4.4 (Rognes et al., 2016). If >50% of reads could be overlapped, the merger was carried forward for analysis; otherwise, only the forward reads were considered. Reads were filtered on quality (where available) again using vsearch with the following parameters -- fastq_trunqqual 20, --fastq_maxns 0, --fastq_minlen 60, --fastq_maxee 2. Next reads were prefiltered using SortMeRNA (Kopylova et al., 2012) using the SILVA-Bac-16S-id90 database. Finally, OTUs were picked against the 13-8 Green Genes release clustered at 97% identity using usearch 10.0.240 (Edgar, 2010) -closed_ref with the following parameters: -strand both, -id 0.97. The resulting table was converted to a biom file for processing with PICRUSt (Langille et al., 2013) with the following scripts: normalize_by_copy_number.py and predict_metagenomes.py.
Diversity analysis.
For analysis on a per study basis, samples were rarefied (Subsample.Table, MicrobeR 0.32[https://www.github.com/jbisanz/MicrobeR]) to the lowest depth sample within the study for generating alpha diversity metrics. The diversity and estimateR functions of Vegan (Dixon, 2003) were used to generate Shannon's diversity index (log base e) and Chao1 estimates respectively and Picante (Kembel et al., 2010) was used to generate Faith's phylogenetic distance. To generate the Firmicutes to Bacteroidetes ratio, the OTU table was summarized to phylum level (Summarize.Taxa, MicrobeR) and the log2 of the ratio of proportional abundances was calculated with a prior count of 0.1%. UniFrac and Jensen-Shannon divergence were calculated using the parallel-enabled distance function of Phyloseq (McMurdie and Holmes, 2013) on subsampled proportional abundances. Bray-Curtis dissimilarity was also calculated (vegdist, Vegan) on subsampled proportional abundances. The CLR Euclidean distance was calculated by carrying out a centered log2-ratio transformation (Make.CLR, MicrobeR) with count zero multiplicative replacement (zCompositions, (Martín-Fernández et al., 2014)) followed by calculating the Euclidean distance (dist, base R 3.5.3). The PhILR Euclidian distance was calculated by first carrying out the phylogenetic isometric log ratio transformation (philr, PhILR, (Silverman et al., 2017)) and calculating the distance matrix as before. Principal coordinates analysis was carried out using the pcoa function of APE (Paradis et al., 2004). ADONIS calculations were carried out (adonis, Vegan) with 999 replications on each distance/dissimilarity metric. All studies were internally normalized against the geometric mean of the LFD group and statistical analysis was determined using Welch's t-test (t.test, base R 3.5.3) to determine significance and the 95% confidence interval. Anhe 2015 was not included in Figure 2 due to n=2 per group. The combined analysis was conducted using a linear mixed effects model using the lmer function of LmerTest (Kuznetsova et al., 2017) with the formula log2(difference)~Diet+(1∣Study), significance was determined with Satterthwaite's method using the anova function and 95% confidence interval using the confint function. For calculation of distance matrices on all studies aggregated, 51-iterations of subsampling were performed and the median feature count per sample was carried forward.
Random Forest Classifiers.
3 murine studies were randomly sampled to be used as external validation studies and the remaining samples were randomly separated into a training set and validation set (2/3 and 1/3 respectively). CLR normalized abundances, PhILR abundances, and CLR normalized PICRUSt abundances were used as predictor variables for the HFD/LFD cases. 10-fold cross validation (rfcv, RandomForest, (Breiman, 2001)) was carried out to determine the optimal number of features for classifier accuracy. The number of predictor variables was determined by selecting the point of saturation in minimizing error rate and selecting the features based on ranked MeanDecreaseGINI, all other features were excluded from the model. Mtry and Ntree were left as default values (Mtry=sqrt(Nfeatures) and Ntree=500).The final model was trained (randomForest, RandomForest) and then applied to all datasets. Predictions and performance metrics were generated using the predict, prediction, and performance functions of ROCR. Low power studies were excluded from plotting in the AUROC heat map (Figure 4F), due to insufficient samples. The entirety of the analysis was repeated after removing Lactococcus spp., by finding the most recent common ancestor in the reference tree to all named Lactococcus spp. (getMRCA, APE), finding its constituent tips (extract.clade, APE) and removing these OTUs from the OTU table and tree (drop.tip, APE).
Lactococcus content of diets and casein.
To examine microbial DNA content of casein, we obtained complementary samples from Envigo of the following varieties: standard casein (cat num. 032.0024, lot 18322), ethanol washed vitamin-free casein (0.32.0352 lot 2458429), and hydrolyzed casein (0.33.2599 lot 7333). To confirm the lack of viable cultures, feces was used to inoculate LB, YPD, and sheep's blood agar (aerobically) and BHI and sheep's blood agar (anaerobically, COY anaerobic system) and incubated for 48h at 37C. Selective culture of Lactococcus was carried out using MRS and M17 media (Oxoid) supplemented with 1% lactose and incubation at 30°C aerobically for 48h. DNA was extracted from fecal pellets and casein using the Zymbiomics 96 MagBead DNA kit following the manufacturer’s instructions with an additional 10 minute incubation at 65°C after cell disruption. Quantification against a standard curve of purified gDNA from Eggerthella lenta was performed by qPCR of the V6 region using BioRad iTaq Universal Probes Supermix in 10 μL reactions using 200 nM of the following oligonucleotides: 5'-TGGAGCATGTGGTTTAATTCGA-3', 5'-TGCGGGACTTAACCCAACA-3', 5'-[Cy5]CACGAGCTGACGACARCCATGCA[BHQ3]-3'. Reactions were conducted in a BioRad CFX384 with the following cycle parameters: 95°C 5min followed by 40 cycles of 95°C for 5 sec, 60°C for 15 sec.
QUANTIFICATION AND STATISTICAL ANALYSIS
Unless otherwise specified, statistical analysis was carried out in R 3.5.3 using the appropriate base function. Individual data points have been shown where possible but are otherwise represented as the mean ± standard error. Significance was determined as P<0.05 unless otherwise stated. Randomization was carried out using the sample function of R 3.5.3 with a fixed seed for reproducible sampling as identified in Data S1 which was the year and month of the original date of analysis. Total samples by study and diet can be found in Table S1 with their allocation for model-generation and prediction found in Table S3. Descriptions of samples size are available in accompanying figure legends wherein n typically denotes a single sample (animal or human). All qPCR quantifications were carried out in replicate technical reactions (n=3) from triplicate biological samples (n=3) derived from a single mouse or lot of commercially prepared diet/casein (n=1).
DATA AND SOFTWARE AVAILABILITY
All datasets analyzed in this study are available from public sources as identified in Data S1 and the STAR Key Resources Table. Precomputed feature tables are available for download both in Data S1 and in the GitHub repository available at jbisanz.github.io/MetaDiet/.
KEY RESOURCES TABLE
| REAGENT or RESOURCE | SOURCE | IDENTIFIER |
|---|---|---|
| Deposited Data | ||
| Anhe 2015 | SRA | SRP038874 |
| Carmody 2015 | SRA | SRP154925 |
| Chan 2016 | SRA | SRP026050 |
| Cox 2014 | SRA | SRP042293 |
| David 2014 | SRA | SRP154925 |
| Evans 2014 | MGRAST | mgp7038 |
| Everard 2014 | MGRAST | mgp6153 |
| Goodman 2011 | SRA | SRP006081 |
| Howe 2016 | MGRAST | mgp5882 |
| Hu 2015 | SRA | SRP057943 |
| Kulecka 2016 | SRA | ERP014834 |
| Lu 2017 | SRA | SRP095937 |
| Moya-Perez 2015 | ENA | ERP008902 |
| Park 2013 | SRA | ERP000935 |
| Perry 2016 | SRA | ERP015064 |
| Roopchand 2015 | MGRAST | mgp13326 |
| Ruan 2016 | SRA | SRP074626 |
| Turnbaugh 2008 | SRA | SRP154925 |
| Turnbaugh 2009 | SRA | SRP154925 |
| Ussar 2015 | SRA | ERP010838 |
| Volynets 2017 | SRA | SRP072537 |
| Wu 2011 | SRA | SRP002424 |
| Xiao 2015 | SRA | ERP008710 |
| Xiao 2017 | SRA | ERP011540 |
| Zeng 2016 | SRA | SRP056632 |
| Zietak 2016 | SRA | SRP075839 |
| Voigt 2014 | SRA | SRP029435 |
| Experimental Models: Organisms/Strains | ||
| Germ-free C57BL6/J Mice | UCSF Gnotobiotics | NA |
| Germ-free BALB/c Mice | UCSF Gnotobiotics | NA |
| Oligonucleotides | ||
| 16S_Forward 5-TGGAGCATGTGGTTTAATTCGA-3 | Sigma | NA |
| 16S_Reverse 5-TGCGGGACTTAACCCAACA-3 | Sigma | NA |
| 16S_Probe 5-CACGAGCTGACGACARCCATGCA-3 | Sigma | NA |
| Software and Algorithms | ||
| R v3.5.3 | CRAN | r-project.org |
| Vsearch v2.4.4 | Rognes et al. (201) | github.com/torognes/vsearch |
| SortMeRNA v2.1b | Kopylova et al. (2012) | bioinfo.lifl.fr/RNA/sortmerna/ |
| Usearch v10.0.240 | Edgar (2010) | drive5.com/usearch/ |
| PICRUSt v1.0 | Langille et al. (2013) | picrust.github.io |
| Ape v5.2 | Paradiset al. (2004) | ape-package.ird.fr |
| Picante v1.7 | Kembel et al. (2010) | github.com/skembel/picante |
| PhILR v1.6.0 | Silverman et al. (2017) | github.com/jsilve24/philr |
| Phyloseq v1.24.0 | McMurdie et al. (2013) | joey711.github.io/phyloseq/ |
| Vegan v2.5–2 | Dixon et al. (2003) | cc.oulu.fi/~jarioksa/softhelp/vegan.html |
| randomForest v4.6–14 | Breiman et al. (2001) | stat.berkeley.edu/~breiman/RandomForests/ |
| MicrobeR v0.32 | Github | github.com/jbisanz/MicrobeR |
| Tidyverse v 1.2.1 | Github | tidyverse.org |
| Other | ||
| iTaq Universal Probes Supermix | BioRad | 172–5132 |
| Gram-Stain Reagents | VWR | 10143–178 |
| Resource website for this paper V0.3 | This study | jbisanz.github.io/MetaDiet/ |
Supplementary Material
Table S1 relating to Figure 1. Descriptions of studies meeting inclusion criteria.
Table S2 relating to Figures 2 and 3. ADONIS tests for entire dataset.
Table S3 relating to Figure 4. Random Forest datasets.
Table S5 relating to Figure 4. Receiver operator curve (ROC) areas under the curve (AUC).
Data S1 Raw data and markdown documents describing analysis.
Table S4 relating to Figure 4. Random forest model features.
Highlights:
A generalizable approach is presented for meta-analysis of microbiome datasets
High-fat diets induce reproducible shifts in the mouse gut microbiome
Nonviable Lactococcus contamination is widespread in experimental diets
Phylogenetic and gene signatures translate to human microbiomes
Bisanz and Upadhyay et al. execute a meta-analysis of previous studies evaluating the effect of high-fat diet on the gut microbiome. They define reproducible features across studies for mechanistic experimentation and uncover that residual DNA contamination in experimental diets should be measured and accounted for in study design.
Acknowledgments
We thank Robert Edgar for pivotal discussions and members of the Turnbaugh, Pollard, Spitzer, and Koliwad labs for their contributions of materials, critical feedback, and participation in abstract review. We also thank Katherine Pollard, Nirav Bhakta, Raman Khanna, and Jean Macklaim for critical feedback on the manuscript. This project was supported by the National Institutes of Health (R01HL122593; R21CA227232; P30DK098722). PJT is a Chan Zuckerberg Biohub investigator and a Nadia's Gift Foundation Innovator supported, in part, by the Damon Runyon Cancer Research Foundation (DRR-42-16) and the Searle Scholars Program (SSP-2016-1352). JEB was the recipient of a postdoctoral fellowship from Natural Science and Engineering Research Council of Canada.
Footnotes
Publisher's Disclaimer: This is a PDF file of an unedited manuscript that has been accepted for publication. As a service to our customers we are providing this early version of the manuscript. The manuscript will undergo copyediting, typesetting, and review of the resulting proof before it is published in its final citable form. Please note that during the production process errors may be discovered which could affect the content, and all legal disclaimers that apply to the journal pertain.
Declaration of Interests
Dr. Turnbaugh is on the scientific advisory boards for Kaleido, Seres, SNIPRbiome, uBiome, and WholeBiome; there is no direct overlap between the current study and these consulting duties. All other authors have no relevant declarations.
References
- Amir A, McDonald D, Navas-Molina JA, Kopylova E, Morton JT, Zech Xu Z, Kightley EP, Thompson LR, Hyde ER, Gonzalez A, Knight R. Deblur rapidly resolves single-nucleotide community sequence patterns. mSystems 2017;2(2):759. [DOI] [PMC free article] [PubMed] [Google Scholar]
- Baker M 1,500 scientists lift the lid on reproducibility. Nature 2016;533(7604):452–4. [DOI] [PubMed] [Google Scholar]
- Ballal SA, Veiga P, Fenn K, Michaud M, Kim JH, Gallini CA, Glickman JN, Quéré G, Garault P, Béal C, Derrien M, Courtin P, Kulakauskas S, Chapot-Chartier MP, van Hylckama Vlieg J, Garrett WS. Host lysozyme-mediated lysis of Lactococcus lactis facilitates delivery of colitis-attenuating superoxide dismutase to inflamed colons. Proc Natl Acad Sci U S A 2015;112(25):7803–8. [DOI] [PMC free article] [PubMed] [Google Scholar]
- Breiman L Random forests. Machine Learning 2001;45(1):5–32. [Google Scholar]
- Callahan BJ, McMurdie P, Holmes S. Exact sequence variants should replace operational taxonomic units in marker-gene data analysis. ISME J 2017;11(12):2639. [DOI] [PMC free article] [PubMed] [Google Scholar]
- Carmody RN, Gerber GK, Luevano JM, Gatti DM, Somes L, Svenson KL, Turnbaugh PJ. Diet dominates host genotype in shaping the murine gut microbiota. Cell Host Microbe 2015;17(1):72–84. [DOI] [PMC free article] [PubMed] [Google Scholar]
- Dalby MJ, Ross AW, Walker AW, Morgan PJ. Dietary uncoupling of gut microbiota and energy harvesting from obesity and glucose tolerance in mice. Cell Rep 2017;21(6):1521–33. [DOI] [PMC free article] [PubMed] [Google Scholar]
- David LA, Maurice CF, Carmody RN, Gootenberg DB, Button JE, Wolfe BE, Ling AV, Devlin AS, Varma Y, Fischbach MA, Biddinger SB, Dutton RJ, Turnbaugh PJ. Diet rapidly and reproducibly alters the human gut microbiome. Nature 2013;505(7484):559. [DOI] [PMC free article] [PubMed] [Google Scholar]
- DeSantis TZ, Hugenholtz P, Larsen N, Rojas M, Brodie EL, Keller K, Huber T, Dalevi D, Hu P, Andersen GL. Greengenes, a chimera-checked 16S rRNA gene database and workbench compatible with ARB. Appl Environ Microbiol 2006;72(7):5069–72. [DOI] [PMC free article] [PubMed] [Google Scholar]
- Dixon P VEGAN, a package of R functions for community ecology. J Veg Sci 2003;14(6):927–30. [Google Scholar]
- Dollive S, Chen YY, Grunberg S, Bittinger K, Hoffmann C, Vandivier L, Cuff C, Lewis JD, Wu GD, Bushman FD. Fungi of the murine gut: episodic variation and proliferation during antibiotic treatment. PLoS One 2013;8(8):e71806. [DOI] [PMC free article] [PubMed] [Google Scholar]
- Edgar RC. Search and clustering orders of magnitude faster than BLAST. Bioinformatics 2010;26(19):2460–1. [DOI] [PubMed] [Google Scholar]
- Edgar RC. UNOISE2: improved error-correction for Illumina 16S and ITS amplicon sequencing. bioRxiv 2016;:081257. [Google Scholar]
- Edgar RC. Accuracy of microbial community diversity estimated by closed- and open-reference OTUs. PeerJ 2017;5(6226):e3889. [DOI] [PMC free article] [PubMed] [Google Scholar]
- Finucane MM, Sharpton TJ, Laurent TJ, Pollard KS. A taxonomic signature of obesity in the microbiome? Getting to the guts of the matter. PLoS One 2014;9(1):e84689. [DOI] [PMC free article] [PubMed] [Google Scholar]
- Gloor GB, Macklaim JM, Pawlowsky-Glahn V, Egozcue JJ. Microbiome datasets are compositional: and this is not optional. Front Microbiol 2017;8:2224. [DOI] [PMC free article] [PubMed] [Google Scholar]
- Gurevitch J, Koricheva J, Nakagawa S, Stewart G. Meta-analysis and the science of research synthesis. Nature 2018;555(7695):175. [DOI] [PubMed] [Google Scholar]
- Kembel SW, Cowan PD, Helmus MR, Cornwell WK, Morlon H, Ackerly DD, Blomberg SP, Webb CO. Picante: R tools for integrating phylogenies and ecology. Bioinformatics 2010;26(11):1463–4. [DOI] [PubMed] [Google Scholar]
- Kopylova E, Noé L, Touzet H. SortMeRNA: fast and accurate filtering of ribosomal RNAs in metatranscriptomic data. Bioinformatics 2012;28(24):3211–7. [DOI] [PubMed] [Google Scholar]
- Kuznetsova A, Brockhoff PB, Christensen RHB. LmerTest package: tests in linear mixed effects models. J Stat Softw 2017;82(13). [Google Scholar]
- Lagkouvardos I, Pukall R, Abt B, Foesel BU, Meier-Kolthoff JP, Kumar N, Bresciani A, Martínez I, Just S, Ziegler C, Brugiroux S, Garzetti D, Wenning M, Bui TPN, Wang J, Hugenholtz F, Plugge CM, Peterson DA, Hornef MW, Baines JF, Smidt H, Walter J, Kristiansen K, Nielsen HB, Haller D, Overmann J, Stecher B, Clavel T. The mouse intestinal bacterial collection (miBC) provides host-specific insight into cultured diversity and functional potential of the gut microbiota. Nat Microbiol 2016;1 (10):16131. [DOI] [PubMed] [Google Scholar]
- Langille MGI, Zaneveld J, Caporaso JG, McDonald D, Knights D, Reyes JA, Clemente JC, Burkepile DE, Vega Thurber RL, Knight R, Beiko RG, Huttenhower C. Predictive functional profiling of microbial communities using 16S rRNA marker gene sequences. Nat Biotechnol 2013;31(9):814. [DOI] [PMC free article] [PubMed] [Google Scholar]
- Ley RE, Bäckhed F, Turnbaugh P, Lozupone CA, Knight RD, Gordon JI. Obesity alters gut microbial ecology. Proc Natl Acad Sci U S A 2005;102(31): 11070–5. [DOI] [PMC free article] [PubMed] [Google Scholar]
- Ley RE, Turnbaugh PJ, Klein S, Gordon JI. Human gut microbes associated with obesity. Nature 2006;444(7122):1022. [DOI] [PubMed] [Google Scholar]
- Luo C, Tsementzi D, Kyrpides N, Read T, Konstantinidis KT. Direct comparisons of Illumina vs. Roche 454 sequencing technologies on the same microbial community DNA sample. PLoS One 2012;7(2):e30087. [DOI] [PMC free article] [PubMed] [Google Scholar]
- Martín-Fernández JA, Hron K, Templ M, Filzmoser P, Palarea-Albaladejo J. Bayesian-multiplicative treatment of count zeros in compositional data sets. Stat Model 2015;15(2):134–58. [Google Scholar]
- McMurdie PJ, Holmes S. phyloseq: an R package for reproducible interactive analysis and graphics of microbiome census data. PLoS One 2013;8(4):e61217. [DOI] [PMC free article] [PubMed] [Google Scholar]
- Paradis E, Claude J, Strimmer K. APE: analyses of phylogenetics and evolution in R language. Bioinfor-matics 2004;20(2):289–90. [DOI] [PubMed] [Google Scholar]
- Pasolli E, Truong DT, Malik F, Waldron L, Segata N. Machine learning meta-analysis of large metagenomic datasets: tools and biological insights. PLOS Computational Biology 2016;12(7):1–26. [DOI] [PMC free article] [PubMed] [Google Scholar]
- Rognes T, Flouri T, Nichols B, Quince C, Mahé F. VSEARCH: a versatile open source tool for metagenomics. PeerJ 2016;4(17):e2584. [DOI] [PMC free article] [PubMed] [Google Scholar]
- Silverman JD, Washburne AD, Mukherjee S, David LA. A phylogenetic transform enhances analysis of compositional microbiota data. eLife 2017;6:e21887. [DOI] [PMC free article] [PubMed] [Google Scholar]
- Sinha R, Abu-Ali G, Vogtmann E, Fodor AA, Ren B, Amir A, Schwager E, Crabtree J, Ma S, The Microbiome Quality Control Project, Abnet CC, Knight R, White O, Huttenhower C. Assessment of variation in microbial community amplicon sequencing by the Microbiome Quality Control (MBQC) project consortium. Nat Biotechnol 2017;35(11):1077. [DOI] [PMC free article] [PubMed] [Google Scholar]
- Sze MA, Schloss PD. Looking for a signal in the noise: revisiting obesity and the microbiome. mBio 2016;7(4):e01018–16. [DOI] [PMC free article] [PubMed] [Google Scholar]
- Turnbaugh PJ. Microbes and diet-induced obesity: fast, cheap, and out of control. Cell Host Microbe 2017;21(3):278–81. [DOI] [PMC free article] [PubMed] [Google Scholar]
- Turnbaugh PJ, Bäckhed F, Fulton L, Gordon JI. Diet-induced obesity is linked to marked but reversible alterations in the mouse distal gut microbiome. Cell Host Microbe 2008;3(4):213–23. [DOI] [PMC free article] [PubMed] [Google Scholar]
- Upadhyay V, Poroyko V, Kim Tj, Devkota S, Fu S, Liu D, Tumanov AV, Koroleva EP, Deng L, Nagler C, Chang EB, Tang H, Fu YX. Lymphotoxin regulates commensal responses to enable diet-induced obesity. Nat Immunol 2012;13(10):947. [DOI] [PMC free article] [PubMed] [Google Scholar]
- Wu GD, Chen J, Hoffmann C, Bittinger K, Chen YY, Keilbaugh SA, Bewtra M, Knights D, Walters WA, Knight R, Sinha R, Gilroy E, Gupta K, Baldassano R, Nessel L, Li H, Bushman FD, Lewis JD. Linking long-term dietary patterns with gut microbial enterotypes. Science 2011. ;334(6052):105–8. [DOI] [PMC free article] [PubMed] [Google Scholar]
Associated Data
This section collects any data citations, data availability statements, or supplementary materials included in this article.
Supplementary Materials
Table S1 relating to Figure 1. Descriptions of studies meeting inclusion criteria.
Table S2 relating to Figures 2 and 3. ADONIS tests for entire dataset.
Table S3 relating to Figure 4. Random Forest datasets.
Table S5 relating to Figure 4. Receiver operator curve (ROC) areas under the curve (AUC).
Data S1 Raw data and markdown documents describing analysis.
Table S4 relating to Figure 4. Random forest model features.
Data Availability Statement
All datasets analyzed in this study are available from public sources as identified in Data S1 and the STAR Key Resources Table. Precomputed feature tables are available for download both in Data S1 and in the GitHub repository available at jbisanz.github.io/MetaDiet/.
KEY RESOURCES TABLE
| REAGENT or RESOURCE | SOURCE | IDENTIFIER |
|---|---|---|
| Deposited Data | ||
| Anhe 2015 | SRA | SRP038874 |
| Carmody 2015 | SRA | SRP154925 |
| Chan 2016 | SRA | SRP026050 |
| Cox 2014 | SRA | SRP042293 |
| David 2014 | SRA | SRP154925 |
| Evans 2014 | MGRAST | mgp7038 |
| Everard 2014 | MGRAST | mgp6153 |
| Goodman 2011 | SRA | SRP006081 |
| Howe 2016 | MGRAST | mgp5882 |
| Hu 2015 | SRA | SRP057943 |
| Kulecka 2016 | SRA | ERP014834 |
| Lu 2017 | SRA | SRP095937 |
| Moya-Perez 2015 | ENA | ERP008902 |
| Park 2013 | SRA | ERP000935 |
| Perry 2016 | SRA | ERP015064 |
| Roopchand 2015 | MGRAST | mgp13326 |
| Ruan 2016 | SRA | SRP074626 |
| Turnbaugh 2008 | SRA | SRP154925 |
| Turnbaugh 2009 | SRA | SRP154925 |
| Ussar 2015 | SRA | ERP010838 |
| Volynets 2017 | SRA | SRP072537 |
| Wu 2011 | SRA | SRP002424 |
| Xiao 2015 | SRA | ERP008710 |
| Xiao 2017 | SRA | ERP011540 |
| Zeng 2016 | SRA | SRP056632 |
| Zietak 2016 | SRA | SRP075839 |
| Voigt 2014 | SRA | SRP029435 |
| Experimental Models: Organisms/Strains | ||
| Germ-free C57BL6/J Mice | UCSF Gnotobiotics | NA |
| Germ-free BALB/c Mice | UCSF Gnotobiotics | NA |
| Oligonucleotides | ||
| 16S_Forward 5-TGGAGCATGTGGTTTAATTCGA-3 | Sigma | NA |
| 16S_Reverse 5-TGCGGGACTTAACCCAACA-3 | Sigma | NA |
| 16S_Probe 5-CACGAGCTGACGACARCCATGCA-3 | Sigma | NA |
| Software and Algorithms | ||
| R v3.5.3 | CRAN | r-project.org |
| Vsearch v2.4.4 | Rognes et al. (201) | github.com/torognes/vsearch |
| SortMeRNA v2.1b | Kopylova et al. (2012) | bioinfo.lifl.fr/RNA/sortmerna/ |
| Usearch v10.0.240 | Edgar (2010) | drive5.com/usearch/ |
| PICRUSt v1.0 | Langille et al. (2013) | picrust.github.io |
| Ape v5.2 | Paradiset al. (2004) | ape-package.ird.fr |
| Picante v1.7 | Kembel et al. (2010) | github.com/skembel/picante |
| PhILR v1.6.0 | Silverman et al. (2017) | github.com/jsilve24/philr |
| Phyloseq v1.24.0 | McMurdie et al. (2013) | joey711.github.io/phyloseq/ |
| Vegan v2.5–2 | Dixon et al. (2003) | cc.oulu.fi/~jarioksa/softhelp/vegan.html |
| randomForest v4.6–14 | Breiman et al. (2001) | stat.berkeley.edu/~breiman/RandomForests/ |
| MicrobeR v0.32 | Github | github.com/jbisanz/MicrobeR |
| Tidyverse v 1.2.1 | Github | tidyverse.org |
| Other | ||
| iTaq Universal Probes Supermix | BioRad | 172–5132 |
| Gram-Stain Reagents | VWR | 10143–178 |
| Resource website for this paper V0.3 | This study | jbisanz.github.io/MetaDiet/ |