Abstract
Brain cancer surgery has the goal of performing an accurate resection of the tumor and preserving as much as possible the quality of life of the patient. There is a clinical need to develop non-invasive techniques that can provide reliable assistance for tumor resection in real-time during surgical procedures. Hyperspectral imaging (HSI) arises as a new, noninvasive and non-ionizing technique that can assist neurosurgeons during this difficult task. In this paper, we explore the use of deep learning (DL) techniques for processing hyperspectral (HS) images of in-vivo human brain tissue. We developed a surgical aid visualization system capable of offering guidance to the operating surgeon to achieve a successful and accurate tumor resection. The employed HS database is composed of 26 in-vivo hypercubes from 16 different human patients, among which 258,810 labelled pixels were used for evaluation. The proposed DL methods achieve an overall accuracy of 95% and 85% for binary and multiclass classifications, respectively. The proposed visualization system is able to generate a classification map that is formed by the combination of the DL map and an unsupervised clustering via a majority voting algorithm. This map can be adjusted by the operating surgeon to find the suitable configuration for the current situation during the surgical procedure.
Keywords: Brain tumor, cancer surgery, hyperspectral imaging, intraoperative imaging, deep learning, supervised classification, convolutional neural network (CNN), classifier
1. INTRODUCTION
Cancer is a leading cause of mortality worldwide.1 In particular, brain tumor is one of the most deadly forms of cancer, while high-grade malignant glioma being the most common form (~30%) of all brain and central nervous system tumors.2 Within these malignant gliomas, glioblastoma (GBM) is the most aggressive and invasive type, accounting the 55% of these cases.3,4 Traditional diagnoses of brain tumors are based on excisional biopsy followed by histology. They are invasive with potential side effects and complications.5 In addition, the diagnostic information is not available in real-time during the surgical procedure since the tissue needs to be processed in a pathological laboratory. The importance of complete resection for low-grade tumors has been reported and it has proven to be beneficial, especially in pediatric cases.6 Although other techniques, such as computed tomography (CT), may be able to image the brain, they cannot be used in real time during surgical operation without significantly affecting the course of the procedure.7,8 In this sense, hyperspectral imaging (HSI) arises as a non-invasive, non-ionizing and real-time potential solution that allows precise detection of malignant tissue boundaries, while assisting guidance for diagnosis during surgical interventions and treatment.9–12
Previous works have investigated the classification and delineation of the tumor boundaries using HSI and traditional machine learning (ML) algorithms.12–16 In particular, head and neck cancer were extensively investigated using quantitative HSI to detect and delineate the tumor boundaries in in-vivo animal samples using ML techniques17–20 and in ex-vivo human samples using deep learning (DL) techniques.21 In case of brain tumors,15 quantitative and qualitative HSI analyses were accomplished with the goal of delineate the tumor boundaries by employing both the spatial and spectral features of HSI. Qualitative results were also obtained intraoperatively by performing an inter-patient validation using ML algorithms.12
In this study, the objective is to use deep learning architectures and create a surgical aid visualization system capable of identifying and detecting the boundaries of brain tumors during surgical procedures using in-vivo human brain hyperspectral (HS) images. This tool could assist neurosurgeons in the critical task of identifying cancer tissue during brain surgery.
2. MATERIALS AND METHODS
2.1. In-vivo Human Brain Cancer Database
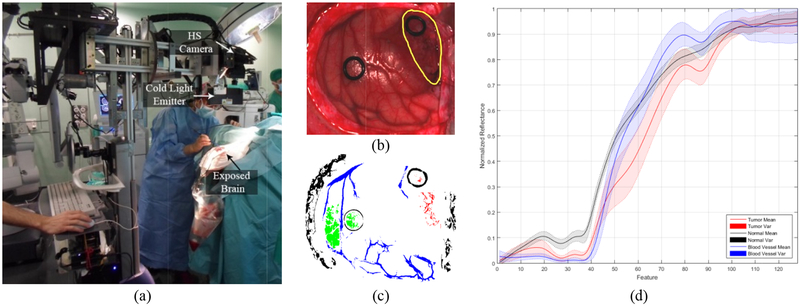
The HSI database employed in this work consists of 26 different hypercubes from 16 adult patients that were undergoing craniotomy of intra-axial brain tumor or other type of brain surgery at the University Hospital Doctor Negrin of Las Palmas de Gran Canaria in Spain. Six of these patients had grade IV glioblastoma (GBM) confirmed by histopathology. Eight HSI hypercubes were acquired from the GBM patients. The other ten patients were registered to obtain normal brain image samples. The HS images were acquired using a customized intraoperative HS acquisition system that captures images in the visible and near infra-red (VNIR) spectral range (400 to 1000 nm).12 This system employs a pushbroom camera (Hyperspec® VNIR A-Series, Headwall Photonics Inc., Fitchburg, MA, USA) to capture HS images composed by 826 spectral bands with a spectral resolution of 2–3 nm and a pixel dispersion of 0.74 nm. Since the camera is based on the pushbroom scanning technique (the 2-D detector captures the complete spectral dimensions and one spatial dimension of the scene), the complete HS cube is obtained by shifting the camera’s field of view relative to the scene, employing a stepper motor to perform the movement. The acquisition system employs an illumination device capable of emitting cold light in the range between 400 to 2200 nm, using a 150 W QTH (Quartz Tungsten Halogen) lamp connected to a cold light emitter via fiber optic cable. The cold light is mandatory in order to avoid the high temperatures of the light in the exposed brain surface. Figure 1a shows the intraoperative HS acquisition system capturing a HS image of the exposed brain surface during a neurosurgical operation at the University Hospital Doctor Negrin of Las Palmas de Gran Canaria (Spain).
Figure 1.
(a) Intraoperative HS acquisition system capturing an image during a surgical procedure. (b) Synthetic RGB etation of a HS cube from an in-vivo brain surfac unded in yello affected by GBM tumor (surro). (c) Golden wrepresen ith the semi-autmstandard wap obtained omatic labelling tool from the same HS cube. Normal, tumor, hypervascularizedand background classes are represented in green, red, blue and black color respectively. (d) Average and standard deviatiof the spectral signatures of the tumor (red), normal (black) and blood vessel/hypervascularized (blue) labelled pixels.
The procedure to obtain the HS images of the in-vivo brain intra-operatively was performed as follows.12 After craniotomy and resection of the dura, the operating surgeon initially identified the approximate location of normal brain and tumor (if applicable). Then, rubber ring markers were placed on these locations and the HS images were captured with markers in situ. After that, tissue samples were resected from the marked areas and sent to pathology for tissue diagnosis. Depending on the location of the tumor, images were acquired at various stages of the operation. In the cases with superficial tumors, some images were obtained immediately after the dura was removed, while in the cases with deep laying tumors, images were obtained during the actual tumor resection.
The raw HS images captured with the system were pre-processed employing a pre-processing chain based on the following steps:12 i) image calibration, where the raw data is calibrated using a white reference image and a dark reference image; ii) noise filtering and band averaging, where the high spectral noise generated by the camera sensor was removed and the dimensionality of the data was reduced without losing the main spectral information; and iii) normalization, where the spectral signatures were homogenized in terms of reflectance level. The final HS cube employed in the following experiments is formed by 128 spectral bands, covering the range between 450 and 900 nm.12
From these pre-processed cubes, a specific set of pixels was labelled using four different classes: tumor tissue, normal tissue, hypervascularized tissue (mainly blood vessels) and background (other materials or substances that can be presented in the surgical scene that are not relevant for the tumor resection process). These set of labelled pixels were employed to train and test the supervised algorithms evaluated in this work. The operating surgeon labelled the captured images using a semi-automatic tool based on the SAM (Spectral Angle Mapper) algorithm developed to this end.15 Figure 1b shows an example of the synthetic RGB representation of an HS cube from the HS brain cancer image database used in this study, where the tumor area has been surrounded with a yellow line. Figure 1c shows the golden standard map obtained from this HS cube, where the green, red, blue and black pixels represents the normal, tumor, hypervascularized and background labelled samples respectively. The pixels that were no labelled are represented in white color. In addition, the average and standard deviation of the labelled pixels from the tumor, normal and hypervascularized classes are presented in Figure 1d. Table 1 details the total number of labelled samples per class employed in this study.
Table 1.
Summary of the HS labeled dataset in this study.
| Class | #Labeled Pixels | #Images | #Patients |
|---|---|---|---|
| Normal | 102,419 | 26 | 16 |
| Tumor (GBM) | 11,359 | 8 | 6 |
| Hypervascularized | 38,566 | 25 | 16 |
| Background | 106,466 | 24 | 15 |
| Total | 258,810 | 26 | 16 |
2.2. Deep Learning Techniques
A 2D convolutional neural network (CNN) classifier was implemented in a batch-based fashion using TensorFlow on a Titan-XP NVIDIA GPU.22 From each pixel of interest, an 11×11 pixel mini-patch was constructed centered on the pixel of interest. The CNN was trained with a batch size of 12 patches, which were augmented to 96 patches during training by applying rotations and vertical mirroring to produce 8 times augmentation. The CNN architecture, detailed in Table 2, consisted of three convolutional layers, one average pooling layer, and one fully-connected layer. Gradient optimization was applied to the AdaDelta optimizer with a learning rate of 1.0 and with 200 epochs for the training data.
Table 2.
Schematic of the proposed CNN architecture. The input size is given in each row. The output size is the input size of the next row. All convolutions were performed with sigmoid activation and 40% dropout.
| Layer | Kernel size / Remarks | Input Size |
|---|---|---|
| Conv. | 3×3 / ‘same’ | 11×11×128 |
| Conv. | 3×3 / ‘same’ | 11×11×64 |
| Conv. | 3×3 / ‘same’ | 11×11×92 |
| Avg. Pool | 3×3 / ‘valid’ | 11×11×128 |
| Linear | Flatten | 9×9×128 |
| Fully-Conn. | - | 1×10368 |
| Linear | Logits | 1×1000 |
| Softmax | Classifier | 1×4 |
In addition, a deep neural network (DNN) was implemented in TensorFlow on a NVIDIA Quadro K2200 GPU and was trained using only the spectral characteristics of the HS samples. This 1D-DNN was composed of two hidden layers with 28 and 40 nodes, respectively. The learning rate was established as 0.1 and the network was trained for 40 epochs of training data. Cross-validation was performed in both algorithms using the leave-one-patient-out method. All parameters were maintained for each patient iteration. Furthermore, the training dataset was randomly balanced to the class with the minimum number of samples.
2.3. Traditional Supervised Classification Techniques
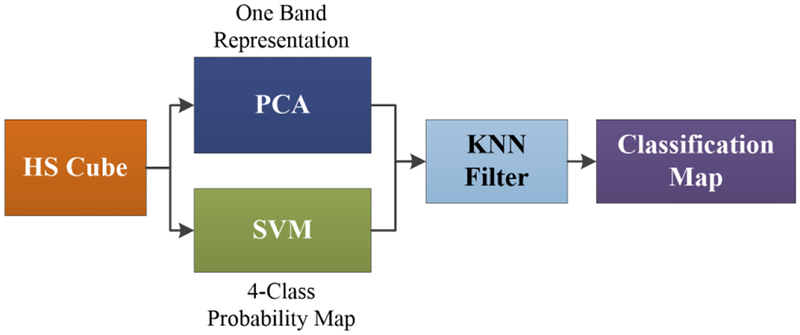
The results of the deep learning algorithms were compared with the results obtained by a spatial-spectral classification algorithm. In this spatial-spectral algorithm, the HS cube is dimensionally reduced using a principal component analysis (PCA) algorithm to obtain a one-band representation of the HS cube. This one-band representation is used as a guidance image to perform a spatial homogenization of the 4-class probability map obtained by a support vector machine (SVM) classifier. The spatial homogenization is performed by a K-nearest neighbors (KNN) filter that improves the classification results obtained by the SVM algorithm.15,23
Figure 2 shows the pipeline of the spatial-spectral supervised classification algorithm. The result of this algorithm is a classification map that includes both the spatial and the spectral features of the HS images. In addition, different configurations of the SVM classifier were tested using a binary dataset (tumor vs. normal tissue) in order to compare the performance of the algorithms. The LIBSVM was employed for the SVM implementation.24
Figure 2.
Block diagram of the spatial-spectral supervised algorithm pipeline.
2.4. Validation
The validation of the proposed algorithm was performed using an inter-patient classification, i.e., training on a group of patient samples that includes all the patients except the samples of the patient to be tested (the leave-one-out method). Eight images from six patients that had GBM diagnosed by histopathology were selected to compute the performance of the different classification algorithms. Table 3 shows the total number of labeled samples per each class and image in the validation dataset.
Table 3.
Summary of the test dataset employed for the algorithm validation.
| Patient ID | Image ID | #Labeled Pixels | |||
|---|---|---|---|---|---|
| N | T | H | B | ||
| 8 | 1 | 2,295 | 1,221 | 1,331 | 630 |
| 2 | 2,187 | 138 | 1,000 | 7,444 | |
| 12 | 1 | 4,516 | 855 | 8,697 | 1,685 |
| 2 | 6,553 | 3,139 | 6,041 | 8,731 | |
| 15 | 1 | 1,251 | 2,046 | 4,089 | 696 |
| 16 | 4 | 1,178 | 96 | 1,064 | 956 |
| 17 | 1 | 1,328 | 179 | 68 | 3,069 |
| 20 | 1 | 1,842 | 3,655 | 1,513 | 2,625 |
| Total | 8 | 21,150 | 11,329 | 23,803 | 25,836 |
(N) Normal tissue; (T) Tumor tissue; (H) Hypervascularized tissue; (B) Background.
Overall accuracy (Eq. 1), sensitivity (Eq. 2) and specificity (Eq. 3) metrics were calculated to evaluate the results, where TP is true positive, TN is true negative, FN is false negative, P is positive, and N is negative. In addition, the receiver operating characteristic (ROC) curve was used to obtain the optimal operating point where the classification offers the best performance for each patient image. Experiments were performed in the binary mode (tumor and normal samples) and in the multiclass mode (four classes available in the HSI dataset). Finally, using the classification models generated for each test patient, the classification of the entire HS image was performed to evaluate the results qualitatively.
| (1) |
| (2) |
| (3) |
2.5. Surgical Aid Visualization System
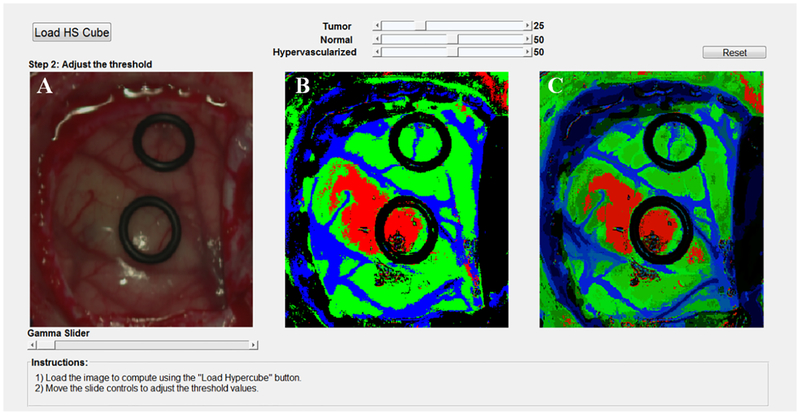
To develop the surgical aid visualization system, MATLAB® GUIDE was employed. In this software, the classification map obtained by the 1D-DNN can be optimized by adjusting the threshold (operating point) where each pixel is assigned to a certain class depending on the probability values obtained for each class. Three threshold sliders were employed in the visualization system that offer the possibility to adjust and overlap the DNN classification results for the tumor, normal and hypervascularized classes, following the same priority order to overlap the layers.
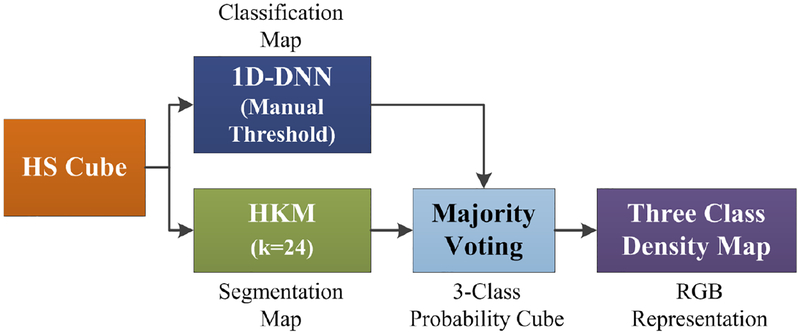
Furthermore, a new processing framework has been proposed (Figure 3). This framework is able to generate a density map where the three classes (normal, tumor and hypervascularized) are represented in gradient colors using the classification map of the 1D-DNN and an unsupervised segmentation map generated by a clustering algorithm. Concretely, the HS cube is processed by the 1D-DNN and a hierarchical K-Means (HKM) algorithm, which generate a 4-class classification map and an unsupervised segmentation map of 24 clusters, respectively. Both maps are merged using a majority voting (MV) algorithm, i.e., all pixels of each cluster on the segmentation map are assigned to the most frequent class in the same region of the classification map.15 At this point, a new classification map is obtained where the classes are determined by the 1D-DNN; and the boundaries of the class regions are determined by the HKM map. In addition, a 3-class probability cube is formed by using the probability values of each class in each cluster, where the first, second and third layers represent the probabilities for the tumor, normal, and hypervascularized classes, respectively. The background class is discarded due to the fact that it will be always represented in black color. Finally, the 3-class probability cube is used to generate the RGB density map where each pixel color value (red, green and blue) is proportionally degraded using the probability values of each layer. This algorithm for generating the three-class density map was previously reported.15 However, this paper uses the 1D-DNN architecture instead of the PCA, SVM and KNN filtering pipeline.
Figure 3.
Block diagram of the proposed surgical aid visualization algorithm to generate the three class density map. A hierarchical K-Means (HKM) algorithm and a 1D deep neural network (DNN) method were used to generate the maps for majority voting.
3. EXPERIMENTAL RESULTS
The algorithms were tested on the test dataset composed by 8 HS cubes obtained from 6 patients with GBM tumor. Table 4 shows the average classification results obtained using only the tumor and normal samples of the database. Both deep learning methods (2D-CNN and 1D-DNN) where compared with SVM-based machine learning methods, both employing linear and radial basis function (RBF) kernels with and without optimize their hyperparameters. After an exhaustive analysis, the optimal cost (C) established for both linear and RBF kernels were 26, while the optimal gamma for the RBF kernel was established as 21. The achievement of the optimal hyperparameters for the RBF kernel was performed using a grid-search method.25 The results obtained demonstrate that the deep learning methods improve the accuracy and the sensitivity up to 7% and 26%, respectively, as compared to the traditional machine learning techniques.
Table 4.
Binary classification results (mean and standard deviation).
| Method | Accuracy (%) | Sensitivity (%) | Specificity (%) | AUC |
|---|---|---|---|---|
| 1D-DNN | 95±8 | 88±12 | 100±1 | 0.99±0.01 |
| 2D-CNN | 90±21 | 76±29 | 100±1 | 0.97±0.04 |
| SVM RBF (C=26 & G=21) | 88±17 | 62±24 | 100±0 | 0.86±0.35 |
| SVM RBF Default | 87±13 | 57±19 | 100±0 | 0.97±0.07 |
| SVM Linear (C=26) | 86±21 | 56±38 | 100±0 | 0.86±0.35 |
| SVM Linear Default | 85±21 | 51±36 | 100±0 | 0.99±0.01 |
(C) Cost hyperparameter of the SVM algorithm; (G) Gamma hyperparameter of the RBF kernel.
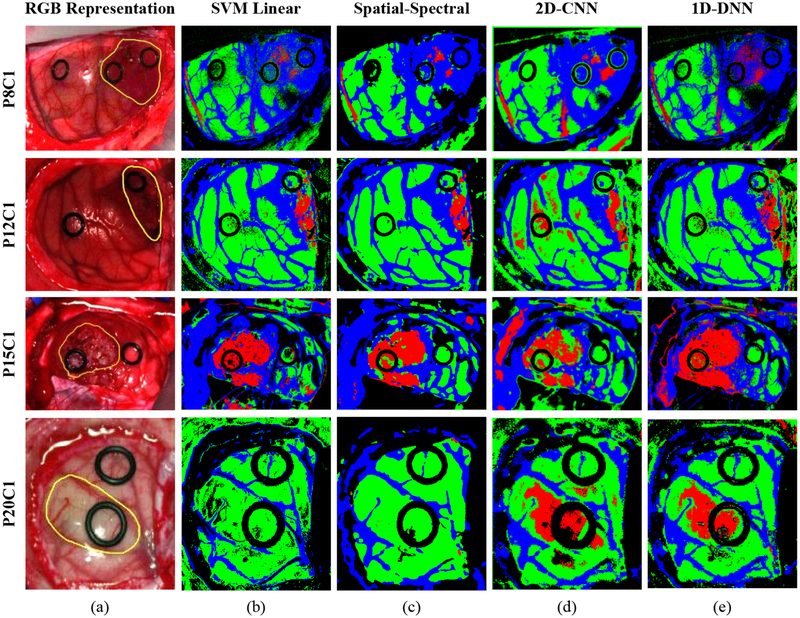
On the other hand, multiclass classification was studied by using the DL methods and the SVM-based methods to evaluate their performance in the discrimination of the four different classes established in the labeled dataset. Table 5 shows the average classification results of the multiclass classification using the validation dataset. In this case, the overall accuracy obtained with the 2D-CNN and the 1D-DNN are similar to the traditional ML algorithms, however, the sensitivity result of the tumor class has been increased by ~16%. In this particular case of in-vivo tissue, it is a challenging task to achieve a high sensitivity in the tumor class. The impact of this improvement in the generation of classification maps obtained when the entire HS cube is classified can be seen in Figure 4. This figure shows the classification maps generated for four images of four different test patients where is possible to observe that the DL methods highly improve the results of Patient 20 (Figure 4, fourth row). In this case, in both SVM-based methods the tumor area is not identified, however, in both DL methods, the tumor area is correctly classified. In addition, in this figure is possible to see that, although the 2D-CNN obtains better quantitative results, the qualitative results reveal that the 1D-DNN introduces less false positives in the classification map. This is especially clear in the classification maps obtained for patients 12 and 20 where normal pixels are misclassified as tumor out of the outlined tumor region. Taking this results in consideration and the fact that the 1D-DNN can classify the entire image in less time than using the 2DCNN (mainly due to time required for the creation and transmission of the image-patches), the 1D-DNN was selected to be used in the proposed surgical aid visualization system.
Table 5.
Multiclass classification results (mean and standard deviation).
| Method | Accuracy (%) | Sensitivity (%) | Specificity (%) | AUC | |||||||||
|---|---|---|---|---|---|---|---|---|---|---|---|---|---|
| N | T | H | B | N | T | H | B | N | T | H | B | ||
| 2D-CNN | 85±9 | 91±9 | 41±29 | 87±14 | 93±13 | 92±8 | 95±5 | 93±9 | 98±1 | 0.98±0.02 | 0.89±0.10 | 0.97±0.04 | 0.99±0.01 |
| PCA+SVM+KNN | 85±14 | 95±6 | 25±36 | 92±10 | 99±3 | 91±17 | 99±3 | 92±11 | 96±5 | 0.99±0.04 | 0.96±0.04 | 0.97±0.05 | 1.00±0.00 |
| 1D-DNN | 84±13 | 92±11 | 42±38 | 90±9 | 83±32 | 91±12 | 96±5 | 90±12 | 97±5 | 0.97±0.08 | 0.82±0.23 | 0.95±0.07 | 0.99±0.01 |
| SVM Linear | 84±14 | 95±5 | 26±33 | 91±10 | 96±7 | 90±16 | 98±3 | 92±11 | 96±5 | 0.99±0.02 | 0.92±0.05 | 0.97±0.04 | 1.00±0.01 |
(N) Tumor tissue; (T) Tumor tissue; (H) Hypervascularized tissue; (B) Background.
Figure 4.
Multiclass classification results obtained with four images of four different patients of the validation database. (a) Synthetic RGB image of each patient with the tumor area surrounded by a yellow line. (b), (c), (d) and (e) Multiclass classification maps obtained with the SVM, Spatial-Spectral, 2D-CNN and the 1D-DNN, respectively. Normal, tumor and hypervascularized tissue are represented in green, red and blue colors, respectively, while the background is represented in black color.
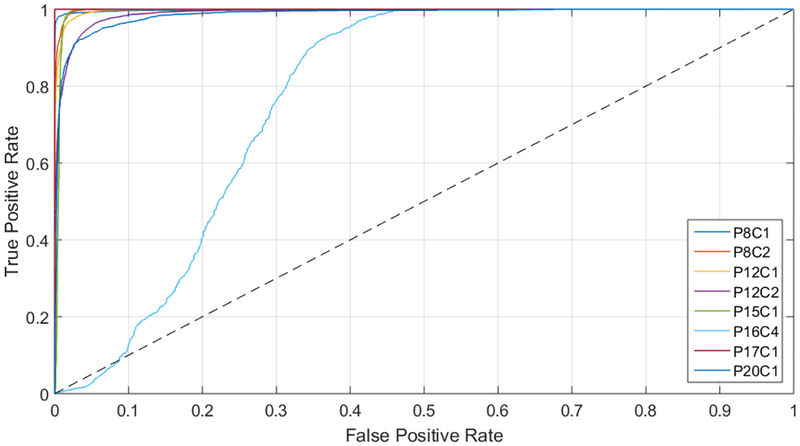
The creation of the surgical aid visualization system is based on the average results obtained by the ROC curves (presented in Table 5), where the area under the curve (AUC) reveals that each class has an optimal operating point where the algorithm is able to classify the samples with high accuracy. In this sense, the development of this system is based on the manual searching of this operating point. Particularly, Figure 5 shows the ROC curves of the tumor class obtained for each image of the validation dataset, where it is possible to observe that all the images (except P16C4) offer practically optimal ROC curves. In the case of P16C4, the ROC curve is not so optimal and this can be produced due to the reduced number of labeled tumor samples available in the dataset for this patient. Furthermore, this can reveal that the labeling of the tumor samples was no representative or even can show that the tumor samples were wrong labeled.
Figure 5.
ROC curves of the tumor class for each image of the validation dataset.
Finally, since the computation of the optimal operating point cannot be performed during the surgical procedures due to the absence of a golden standard of the undergoing patient, a surgical aid visualization system was developed to this end (Figure 6). In this system, the operating surgeon is able to determine the optimal result on the density map by manually adjusting the threshold values of the tumor, normal and hypervascularized classes. These threshold values establish the minimum probability where the pixel must correspond to a certain class in the classification map generated by the 1D-DNN (Figure 6b). After that, the majority voting algorithm is computed to generate the updated density map (Figure 6c), merging the 1D-DNN map with the segmentation map obtained by the HKM clustering.
Figure 6.
Surgical aid visualization system with manual adjustable threshold values. (a) Synthetic RGB image generated from the HS cube. (b) 1D-DNN classification map generated with the established threshold. (c) Density map generated merging the 1D-DNN classification map and the HKM segmentation via the MV algorithm and performing the cluster probability gradient.
Figure 7 shows the classification results and the density maps obtained using the surgical aid visualization system of four images from the same four patients with six different established tumor thresholds (0.75, 0.5, 0.25, 0.10, 0.05 and 0.005). As it can be seen in the results, in some cases, the density map is able to reveal different areas that cannot be clearly seen in the 1D-DNN map as well as remove some false positives that can be found in the classification results.
Figure 7.
Classification maps and density maps obtained using different tumor thresholds in the surgical aid visualizationsystem. (or threshold value of 0.75, 0.5, a) to (f) Classificdensity map obtained with a tumation map and 0.25, 0.10, 0.05 and 0.005, respectively.
Furthermore, the manual establishment of the tumor thresholds reveals in some cases more information about the localization of the tumor area. For example, for patient 8 (P8C1) is possible to observe that the threshold that better delineate the tumor area is located between 0.05 and 0.005, while in other cases, such as P20C1 and P15C1, the default threshold (0.5) is the one that better determine the tumor area.
4. CONCLUSIONS
The work presented in this paper employs deep learning techniques for the detection of in-vivo brain tumors using intraoperative hyperspectral imaging. In addition, a novel surgical aid visualization system based on a 1D-DNN combined with an unsupervised clustering algorithm, where the manually adjustment of the algorithm output can be fine-tuned by the user, has been presented. This user interface has the goal of intraoperatively assisting neurosurgeons during tumor resection, allowing the fine-tuning of the outcomes of the algorithm to better adjust the identification of the tumor area based on the operating surgeon criteria.
Different classification methods based on traditional SVM-based classifiers have been compared with DL techniques on binary and multiclass cancer detection in HS images. DL techniques have demonstrated that outperform the classification results. In addition, our investigations reveal that spectral-spatial classification with the 2D-CNN and pixel-wise classification with the 1D-DNN perform within statistical indistinguishable accuracy in the quantitative results. We believe that the high spectral resolution of the HS cameras used in this study allows the 1D-DNN to perform with comparable accuracy to CNN methods. Additionally, the limited spatial resolution of the pushbroom camera may also reduce the performance of CNN methods. On the other hand, the qualitative results presented in this work reveals that the 1D-DNN presents better results than the 2D-CNN when the entire HS cube is classified, producing less false positives in the results. For this reason, and taking into account also that the goal of this work is to achieve real-time processing within the operating room, the proposed surgical aid visualization system uses a DNN for classification because the CNN requires more execution time (~1 minute per image) compared to the DNN (~10 seconds per image).
As shown in Figure 4 and Figure 7, the predicted tumor area overlaps well with the golden standard cancer area in the most cases using the optimal threshold value. The ability to accurately localize the cancer area can also be seen in the high average AUC values for the tumor class ranging from 82% to 96% for the algorithms tested in this work. The reason for the low sensitivities is the large optimal threshold differences between the test patients, partially due to the lower number of tumor samples in the training set. Additionally, as it can be seen in Figure 1c, the golden standard used for obtaining the quantitative results did not comprise the entire tumor area. Only pixels with high certainty of class membership were selected, which could have also contributed to the low sensitivity results that do not accurately reflect the efficacy of the proposed method. In this sense, more data collection with more emphasis on collecting high-quality tumor samples could help in order to produce better training paradigms, which could potentially lead to better results. However, to solve this problem in the proposed surgical aid visualization system, the operating surgeon can visualize multiple thresholds to determine the sufficient operating point for cancer detection.
The results of this preliminary study show that deep learning outperforms traditional machine learning techniques in this application, although further experiments need to be conducted to optimize the deep learning algorithms. Additionally, the outcomes of this work demonstrate the feasibility of HSI for the use in brain surgical guidance.
ACKNOWLEDGMENTS
This research was supported in part by the U.S. National Institutes of Health (NIH) grants (R21CA176684, R01CA156775, R01CA204254, and R01HL140325). In addition, this work was supported in part by the Canary Islands Government through the ACIISI (Canarian Agency for Research, Innovation and the Information Society), ITHACA project “Hyperspectral identification of brain tumors” under Grant Agreement ProID2017010164 and it also was partially supported also by the Spanish Government and European Union (FEDER funds) as part of support program in the context of Distributed HW/SW Platform for Intelligent Processing of Heterogeneous Sensor Data in Large Open Areas Surveillance Applications (PLATINO) project, under contract TEC2017–86722-C4–1-R. This work was also supported in part by the European Commission through the FP7 FET (Future Emerging Technologies) Open Programme ICT-2011.9.2, European Project HELICoiD “HypErspectral Imaging Cancer Detection” under Grant Agreement 618080. Additionally, this work has been supported in part by the 2016 PhD Training Program for Research Staff of the University of Las Palmas de Gran Canaria and This work was completed while Samuel Ortega was beneficiary of a pre-doctoral grant given by the “Agencia Canaria de Investigacion, Innovacion y Sociedad de la Información (ACIISI)” of the “Conserjería de Economía, Industria, Comercio y Conocimiento” of the ”Gobierno de Canarias”, which is part-financed by the European Social Fund (FSE) (POC 2014–2020, Eje 3 Tema Prioritario 74 (85%)).
Footnotes
DISCLOSURES
The authors have no relevant financial interests in this article and no potential conflicts of interest to disclose. The study protocol and consent procedures were approved by the Comité Ético de Investigación Clínica-Comité de Ética en la Investigación (CEIC/CEI) of University Hospital Doctor Negrin and written informed consent was obtained from all subjects.
REFERENCES
- [1].Siegel RL, Miller KD and Jemal A, “Cancer statistics,” CA Cancer J Clin 66(1), 7–30 (2016). [DOI] [PubMed] [Google Scholar]
- [2].Goodenberger ML and Jenkins RB, “Genetics of adult glioma,” Cancer Genet. 205(12), 613–621 (2012). [DOI] [PubMed] [Google Scholar]
- [3].Van Meir EG, Hadjipanayis CG, Norden AD, Shu HK, Wen PY and Olson JJ, “Exciting New Advances in Neuro-Oncology: The Avenue to a Cure for Malignant Glioma,” CA. Cancer J. Clin 60(3), 166–193 (2010). [DOI] [PMC free article] [PubMed] [Google Scholar]
- [4].Goodenberger ML and Jenkins RB, “Genetics of adult glioma,” Cancer Genet. 205(12), 613–621 (2012). [DOI] [PubMed] [Google Scholar]
- [5].Sanai N and Berger MS, “Glioma extent of resection and its impact on patient outcome,” Neurosurgery 62(4), 753–764 (2008). [DOI] [PubMed] [Google Scholar]
- [6].Smith JS, Chang EF, Lamborn KR, Chang SM, Prados MD, Cha S, Tihan T, VandenBerg S, McDermott MW and Berger MS, “Role of Extent of Resection in the Long-Term Outcome of Low-Grade Hemispheric Gliomas,” J. Clin. Oncol 26(8), 1338–1345 (2008). [DOI] [PubMed] [Google Scholar]
- [7].Reinges MHT, Nguyen HH, Krings T, Hütter BO, Rohde V, Gilsbach JM, Black PM, Takakura K and Roberts DW, “Course of brain shift during microsurgical resection of supratentorial cerebral lesions: Limits of conventional neuronavigation,” Acta Neurochir. (Wien) 146(4), 369–377 (2004). [DOI] [PubMed] [Google Scholar]
- [8].Gerard IJ, Kersten-Oertel M, Petrecca K, Sirhan D, Hall JA and Collins DL, “Brain shift in neuronavigation of brain tumors: A review,” Med. Image Anal. 35, 403–420 (2017). [DOI] [PubMed] [Google Scholar]
- [9].Lu G and Fei B, “Medical hyperspectral imaging: a review.,” J. Biomed. Opt 19(1), 10901 (2014). [DOI] [PMC free article] [PubMed] [Google Scholar]
- [10].Li Q, He X, Wang Y, Liu H, Xu D and Guo F, “Review of spectral imaging technology in biomedical engineering: achievements and challenges,” J. Biomed. Opt 18(10), 100901 (2013). [DOI] [PubMed] [Google Scholar]
- [11].Akbari H, Kosugi Y, Kojima K and Tanaka N, “Detection and analysis of the intestinal ischemia using visible and invisible hyperspectral imaging,” IEEE Trans. Biomed. Eng 57(8), 2011–2017 (2010). [DOI] [PubMed] [Google Scholar]
- [12].Fabelo H, Ortega S, Lazcano R, Madroñal D, M. Callicó G, Juárez E, Salvador R, Bulters D, Bulstrode H, Szolna A, Piñeiro JF, Sosa C, J. O’Shanahan A, Bisshopp S, Hernández M, Morera J, Ravi D, Kiran BR, Vega A, et al. , “An intraoperative visualization system using hyperspectral imaging to aid in brain tumor delineation,” Sensors 18(2) (2018). [DOI] [PMC free article] [PubMed] [Google Scholar]
- [13].Fei B, Lu G, Wang X, Zhang H, Little JV, Patel MR, Griffith CC, El-Diery MW and Chen AY, “Label-free reflectance hyperspectral imaging for tumor margin assessment: a pilot study on surgical specimens of cancer patients,” J. Biomed. Opt 22(08), 1 (2017). [DOI] [PMC free article] [PubMed] [Google Scholar]
- [14].Lu G, Wang D, Qin X, Muller S, Wang X, Chen AY, Chen ZG and Fei B, “Detection and delineation of squamous neoplasia with hyperspectral imaging in a mouse model of tongue carcinogenesis,” J. Biophotonics 11(3) (2018). [DOI] [PMC free article] [PubMed] [Google Scholar]
- [15].Fabelo H, Ortega S, Ravi D, Kiran BR, Sosa C, Bulters D, Callicó GM, Bulstrode H, Szolna A, Piñeiro JF, Kabwama S, Madroñal D, Lazcano R, J-O’Shanahan A, Bisshopp S, Hernández M, Báez A, Yang G-Z, Stanciulescu B, et al. , “Spatio-spectral classification of hyperspectral images for brain cancer detection during surgical operations,” PLoS One 13(3), 1–27 (2018). [DOI] [PMC free article] [PubMed] [Google Scholar]
- [16].Akbari H, Halig LV, Schuster DM, Osunkoya A, Master V, Nieh PT, Chen GZ and Fei B, “Hyperspectral imaging and quantitative analysis for prostate cancer detection,” J. Biomed. Opt 17(7), 0760051 (2012). [DOI] [PMC free article] [PubMed] [Google Scholar]
- [17].Lu G, Little JV, Wang X, Zhang H, Patel MR, Griffith CC, El-Deiry MW, Chen AY and Fei B, “Detection of head and neck cancer in surgical specimens using quantitative hyperspectral imaging,” Clin. Cancer Res. 23(18), 5426–5436 (2017). [DOI] [PMC free article] [PubMed] [Google Scholar]
- [18].Pike R, Lu G, Wang D, Chen ZG and Fei B, “A Minimum Spanning Forest-Based Method for Noninvasive Cancer Detection With Hyperspectral Imaging,” IEEE Trans. Biomed. Eng 63(3), 653–663 (2016). [DOI] [PMC free article] [PubMed] [Google Scholar]
- [19].Lu G, Halig L, Wang D, Qin X, Chen ZG and Fei B, “Spectral-spatial classification for noninvasive cancer detection using hyperspectral imaging,” J. Biomed. Opt 19(10), 106004 (2014). [DOI] [PMC free article] [PubMed] [Google Scholar]
- [20].Lu G, Wang D, Qin X, Halig L, Muller S, Zhang H, Chen A, Pogue BW, Chen ZG and Fei B, “Framework for hyperspectral image processing and quantification for cancer detection during animal tumor surgery,” J. Biomed. Opt 20(12), 126012 (2015). [DOI] [PMC free article] [PubMed] [Google Scholar]
- [21].Halicek M, Lu G, Little JV, Wang X, Patel M, Griffith CC, El-Deiry MW, Chen AY and Fei B, “Deep convolutional neural networks for classifying head and neck cancer using hyperspectral imaging,” J. Biomed. Opt 22(6), 060503 (2017). [DOI] [PMC free article] [PubMed] [Google Scholar]
- [22].Abadi M, Barham P, Chen J, Chen Z, Davis A, Dean J, Devin M, Ghemawat S, Irving G, Isard M, Kudlur M, Levenberg J, Monga R, Moore S, Murray DG, Steiner B, Tucker P, Vasudevan V, Warden P, et al. , “TensorFlow: A System for Large-Scale Machine Learning TensorFlow: A system for large-scale machine learning,” 12th USENIX Symp. Oper. Syst. Des. Implement. (OSDI ‘16) (2016). [Google Scholar]
- [23].Huang K, Li S, Kang X and Fang L, “Spectral–Spatial Hyperspectral Image Classification Based on KNN,” Sens. Imaging 17(1), 1–13 (2016). [Google Scholar]
- [24].Chang C and Lin C, “LIBSVM : A Library for Support Vector Machines,” ACM Trans. Intell. Syst. Technol 2, 1–39 (2013). [Google Scholar]
- [25].Pourreza-Shahri R, Saki F, Kehtarnavaz N, Leboulluec P and Liu H, “Classification of ex-vivo breast cancer positive margins measured by hyperspectral imaging,” 2013 IEEE Int. Conf. Image Process. ICIP 2013 -Proc, 1408–1412 (2013). [Google Scholar]


