Abstract
Potassium-sensitive Hypokalemic and Normokalemic Periodic Paralysis (HypoPP, NormoPP) are inherited skeletal muscle diseases characterized by episodes of flaccid muscle weakness1,2. They are caused by mutations in one gating charge in an S4 transmembrane segment in the voltage sensor (VS) of voltage-gated sodium channel Nav1.4 or calcium channel Cav1.11,2. Mutations of the outermost arginine gating charges (R1 and R2) cause HypoPP1,2 by creating a pathogenic gating pore in the VS through which cations leak in the resting state3,4. Mutations of the third arginine gating charge (R3) cause NormoPP5 owing to cationic leak in activated/inactivated states6. Here we present high-resolution structures of these pathogenic gating pores in the model bacterial sodium channel NaVAb7,8. Mutation of R2 in NaVAb gives gating pore current in resting states, whereas mutation of R3 gives gating pore current in activated/inactivated states. Mutations R2G and R3G have no effect on backbone structures of VS, but create aqueous space near the hydrophobic constriction site (HCS) that controls gating charge movement through VS. The R3G mutation extends the extracellular aqueous cleft completely through the activated VS. Although the R2G mutation does not create a continuous aqueous pathway in the activated state, molecular modeling of the resting state reveals a complete water-accessible pathway. Crystal structures of NaVAb/R2G in complex with guanidinium define a potential drug target site. Molecular dynamics simulations illustrate the mechanism of Na+ permeation through the mutant gating pore in concert with conformational fluctuations of gating charge R4. Our results reveal pathogenic mechanisms of periodic paralysis at the atomic level and suggest designs of drugs that may prevent ionic leak and provide symptomatic relief from these episodic diseases.
Nav1.4 channels generate action potentials that initiate muscle contraction9. They are complexes of pore-forming α and auxiliary β1 subunits9–11. The α subunit contains four homologous domains (I-IV) with six transmembrane segments (S1-S6). Segments S1-S4 form the VS, with positively charged residues at every third position in the S4 segment. Upon depolarization, S4 moves outward through a narrow gating pore formed by S1-S3, catalyzed by exchange of interactions with negative/polar residues in S2 and S312. The VS has an hourglass shape, with a narrow HCS separating extracellular and intracellular compartments6,11. Water-filled crevices on either side of the HCS focus the membrane electric field, assuring efficient coupling of voltage to conformational changes that open the central pore12,13. Mutations in the arginine gating charge that fills the HCS cause a state-dependent cation leak through the VS, which we term ‘gating pore current’14,15.
Missense mutations in S4 arginine gating charges of Nav1.4 cause HypoPP and NormoPP1,2,16,17. Mutations of R1 in domains I or III to H/Q or R2 in domains I, II, and III to W/G/Q/S cause HypoPP1,2,16,17. Mutations of R3 in domain II to G/Q/W, or R3 in domain III to H/C cause NormoPP4,16,17. All these mutations create non-selective gating pore current through the VS3,4,16–19. Increased inward leak leads to Na+ overload, sustained depolarization, and action potential failure, which paralyzes skeletal muscles3,16–19. These pathophysiological effects predict that HypoPP mutations would cause an open aqueous pathway for ion movement through the resting state of the VS, but not the activated state, whereas NormoPP mutations would cause an open aqueous pathway in the activated state, but not the resting state. Molecular models and mutagenesis studies support this idea20–22. To provide direct structural evidence for this pathophysiological mechanism, we introduced periodic-paralysis mutations into NaVAb, whose structure has been solved at high resolution6,7 and analyzed by molecular dynamics (MD)23. We characterized the resulting gating pore currents, solved the structures of mutant gating pores without and with a permeant ion bound, and investigated MD of ion movement through pathogenic gating pores.
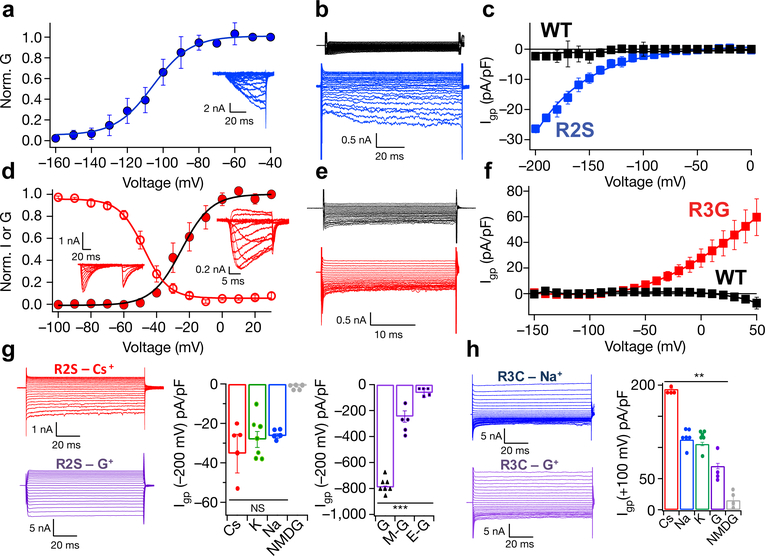
To reconstitute pathogenic HypoPP gating pore current in NaVAb, we mutated R2 to Ser (R2S, analogous to NaV1.4/R672S) and expressed the mutant in Trichopulsia ni insect cells. Transfected cells were voltage-clamped to −200 mV and depolarized in 10-mV steps to record Na+ currents. Half-maximal central pore currents were observed at V1/2= −105 ± 0.6 mV (Fig. 1a). To measure gating pore currents, cells were held at −100 mV, where NaVAb is in the slow-inactivated state and no central pore current is seen. Gating pore current was examined by applying pulses from +100 to −200 mV in −10 mV steps. A nonlinear component of leak current was observed in the resting state, beginning at −110 mV and increasing to −200 mV (Fig. 1b, c).
Figure 1: Functional properties of NaVAb/WT, NaVAb/R2S, and NaVAb/R3G.
a, Central pore Na+ currents (inset) and G/V curve for NavAb/R2S during 200-ms depolarizations from −200 mV to the indicated potentials. V1/2= −105 ± 0.6 mV, k=10±0.9 (n=4). b, c, Gating pore Na+ currents and I/V curves for NavAb/R2S (blue) or NavAb/WT (black) during depolarizations from −100 mV to the indicated potentials. n=10. d, Central pore Na+ currents (inset) and G/V curve for NavAb/R3G during depolarizations from-160 mV to the indicated potentials (filled circles; Va=−24.8 ± 1.1 mV, k=9±1 (n=4)). Voltage dependence of steady-state inactivation (open circles) for NavAb/R3G (Vh=−47.7±0.4 mV, k=7.5±0.3 (n=4)). e, f, Gating pore Na+ currents and I/V curves for NaVAb/R3G (red) or NaVAb/WT (black) for voltage steps from 0 mV to the indicated potentials (n=11). g, Gating pore current through NavAb/R2S for Cs+ (n=5), K+ (n=7), Na+ (n=5), N-methyl-D-glucamine (NMDG, n=5), guanidinium (G, n=7), methylguanidinium (M-G, n=5), and ethylguanidinium, (E-G, n=5).. ***, P=0.00029. h, Gating pore current through NavAb/R3C for Cs+ (n=4), Na+ (n=6), K+ (n=6), G (n=4), and NMDG. (n=4). **, P=0.0011. Student’s t-test, two-sided.
Mutations of the R3 gating charge that cause NormoPP (NaV1.4/R675G/Q/W) induce outward gating pore current in activated but not in resting states6. NaVAb/R3G central pore current activated from −50 mV to 0 mV (Fig. 1d; Va=−24.8 ± 1.1 mV). Steady-state inactivation was observed from −90 mV to −10 mV (Fig. 1d; Vh=−47.7±0.4 mV). NaVAb/R3G conducted outward gating pore current in activated/inactivated states at potentials more positive than −60 mV (Fig. 1e, f). These physiological studies demonstrate that NaVAb provides an accurate model of NaV1.4, because gating pore current is observed only in the resting state for R2S and only in the activated state for R3G.
The pathogenic effects of gating pore mutations depend on inward leak of Na+. The R2S gating pore was not significantly selective among Cs+, K+, or Na+ (Fig. 1g). As for NaV1.424, guanidinium was exceptionally permeant in the gating pore of NaVAb/R2S, with a ratio of PGua:PNa ∼28. Methylguanidine and ethylguanidine were less permeant (Fig. 1g). The ion selectivity of the outward gating pore current conducted by NaVAb/R3G was Cs+>K+~Na+ (Fig. 1h). However, the permeation of guanidinium was less than Na+ in NaVAb/R3G and >40-fold less than in NaVAb/R2S (Fig. 1h). The weak selectivity among inorganic cations for R2S and R3G and the high guanidinium permeability through R2S are characteristic of corresponding mutations in NaV1.42, further supporting NaVAb as a valid model for structural studies of gating pore mutations.
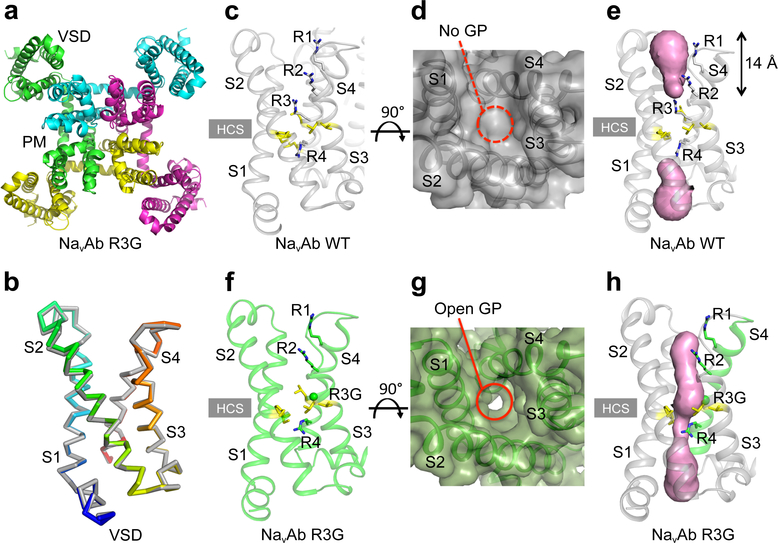
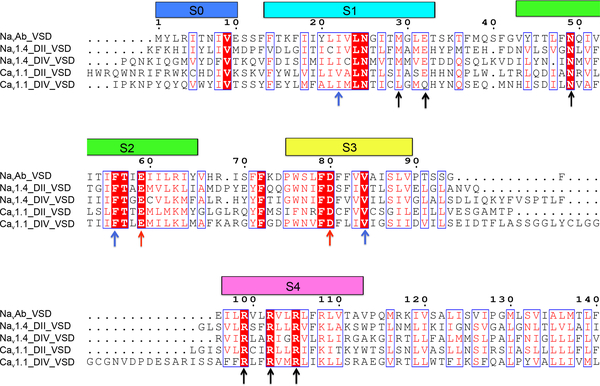
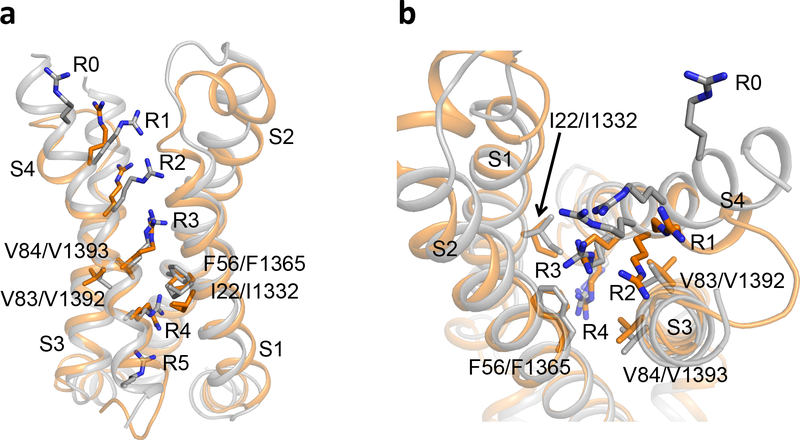
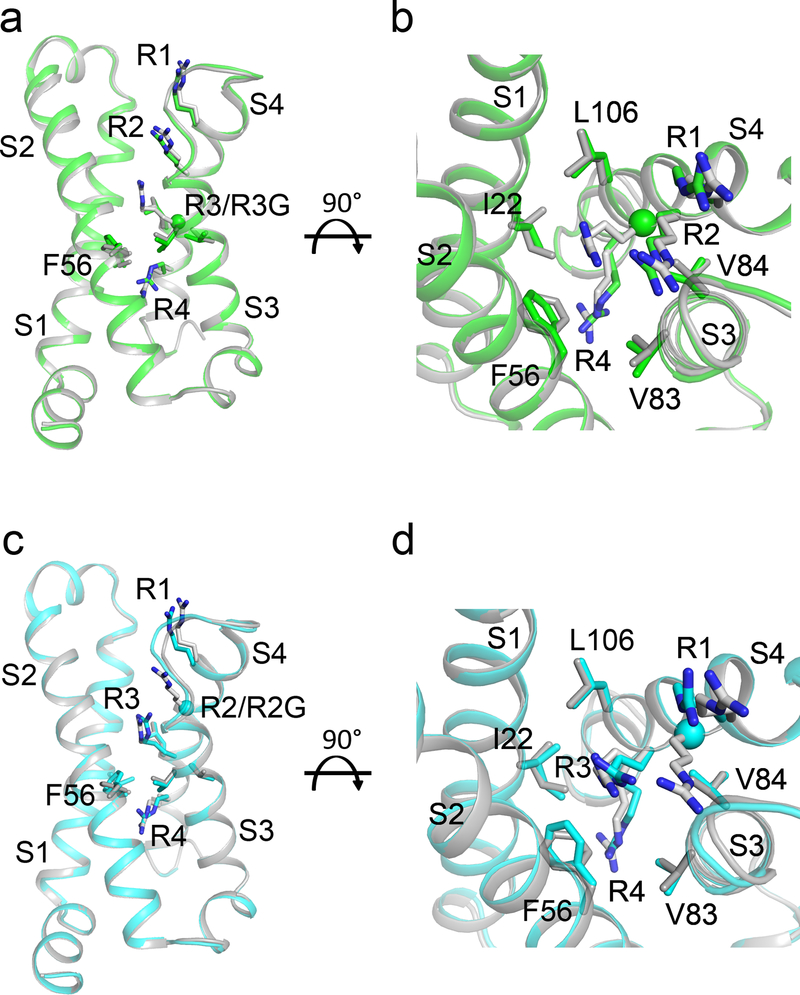
To elucidate the structure of a pathogenic gating pore in its conductive conformation in an activated VS, we solved the structure of the NormoPP analog NaVAb/R3G at 2.7 Å resolution (Fig. 2). NaV channels have a central pore module surrounded by four symmetrically located VS (Fig. 2a). The VS of NaVAb and NaV1.4 are very similar in amino acid sequence and structure (Extended Data Figs. 1 and 2). NaVAb/WT and NaVAb/R3G VS crystallize in the same conformation, with Cα RMSD of 0.39 Å (Fig. 2b, Extended Data Fig. 3). These results indicate that R3G does not perturb VS structure and must therefore have its pathogenic effects because of loss of the R3 side chain. These channels crystallize with activated VS (Fig. 2c)6,7, as expected at 0 mV. In NaVAb/WT, R1, R2, and R3 are located extracellular to the HCS, and their sidechains point upward toward the extracellular milieu (Fig. 2c). In contrast, the R4 is located intracellular to the HCS and its sidechain points downward toward the cytosol (Fig. 2c). When viewed from the extracellular side, there is no water-accessible pathway leading inward through the WT VS (Fig. 2d), but we observed a deep solvent-accessible cleft in NaVAb/R3G extending down to the R4 sidechain (Fig. 2g).
Figure 2. Structures of the VS of NavAb/WT and NavAb/R3G.
a, Structure of NaVAb/R3G in top view. b, Comparison of the conformations of NaVAb/WT (grey) and NaVAb/R3G (rainbow) VS in side view. c-e, Structures of NavAb/WT VS. (c) Side view highlighting gating charges in sticks. (d) Top view in spacefilling format. (e) MOLE2 analysis of water-accessible space in magenta. f-h, Structures of NavAb/R3G VS. (f) Side view highlighting gating charges. (g) Top view in spacefilling format. (h) MOLE2 analysis of water-filled space in magenta. Green balls in panels f and h indicate the positions of the missing sidechain of R3. In panels d and g, the dotted red line circles the position where the gating pore (GP) would be in the activated state and the solid red line circles the open GP. See Extended Data Table 1 for details.
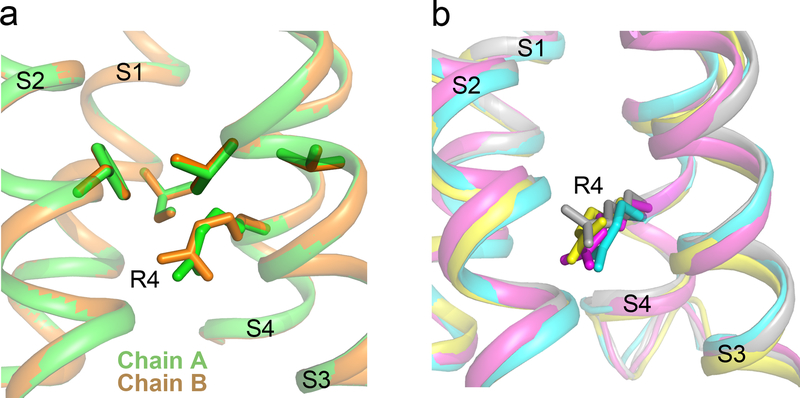
Analysis of the structure of Chain B of NaVAb/WT using the MOLE2 algorithm revealed an incomplete water-accessible pathway extending part way through the VS from the extracellular and intracellular sides, but interrupted at the HCS by R3 (Fig. 2e). Remarkably, the water-accessible pathway continues all the way through the VS in NaVAb/R3G, with 2Å diameter at its narrowest point, similar to the size of Na+ (Fig. 2h). In contrast, for Chain A, R4 was captured in a different rotamer conformation in which the arginine sidechain partially blocks the inner end of the gating pore in NaVAb/R3G (Extended Data Fig. 4a). Our previous structures of NaVAb in the slow-inactivated state captured R4 in four slightly different rotamer conformations, with the most open having a diameter of 3Å (Extended Data Fig. 4b)25. These results elucidate the molecular mechanism through which S4 mutations cause pathogenic gating pore current and further suggest that ion permeation through the gating pore is controlled dynamically by the state of the VS and by rotamer conformations of R4.
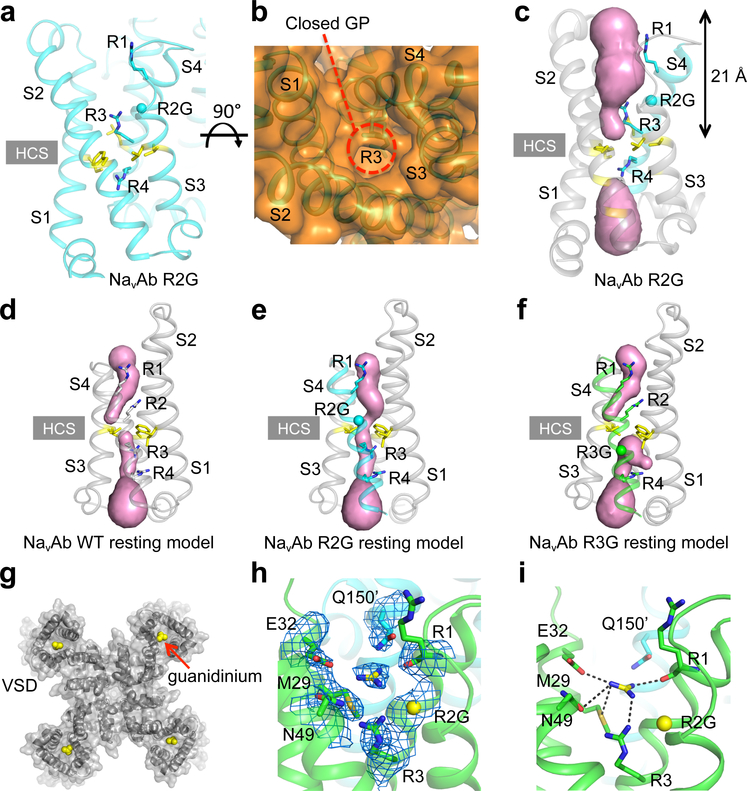
In contrast to NormoPP, HypoPP mutants conduct gating pore current in the resting state, and their gating pore is closed in the activated state (Fig. 1). Therefore, we hypothesized that NaVAb/R2G would not have a continuous water-accessible pathway through its gating pore in the activated state. At 2.9 Å resolution, the structure of R2G revealed a gap with extra solvent-accessible area in the extracellular aqueous cleft but no change in the backbone conformation (Fig. 3a, Extended Data Fig. 3). Although the increased opening of the aqueous cleft in the VS is evident in spacefilling models (Fig. 3b), the R3 and R4 sidechains seal the VS in this activated state, interrupting the transmembrane pathway and preventing ion conductance. The solvent accessible area is ∼21 Å deep from extracellular side (Fig. 3c), more than 7 Å deeper than NavAb/WT (Fig. 2e), but it does not penetrate through to the cytosolic side. This structure illustrates why NaVAb/R2G does not conduct gating pore current in the activated state (Fig. 1)
Figure 3. Structure of VS and guanidinium binding site of NaVAb/R2G.
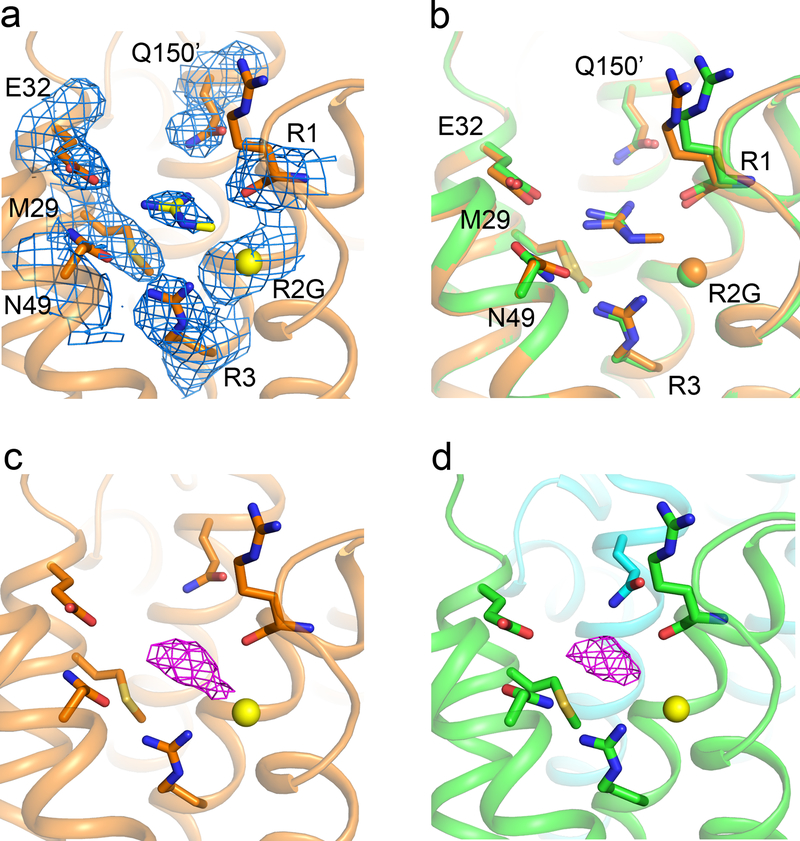
a-c, Structures of the activated VS of NaVAb/R2G. (a) Side view with gating charges highlighted in sticks. (b) Top view in spacefilling format. The dashed red line indicates the position of the closed gating pore (GP) (c) MOLE2 analysis of water-filled space in magenta blobs. d-f. Rosetta structural models of Resting State 2 of the VS were re-optimized with the amino-acid sequence of NaVAb for NaVAb/WT (d), NaVAb/R2G (e), and NaVAb/R3G (f). The perspective is rotated ∼180o around the vertical axis to better illustrate the arginine gating charges in Resting State 2. Green balls represent missing arginine side chains of R2 and R3, respectively. Magenta blobs represent solvent accessible volume modeled with MOLE2. g, Top view of NavAb/R2G with one guanidinium bound to each VS. h, 2mFo – DFc electron density map (blue mesh) of residues around the guanidinium binding site at 1σ. i, Interaction network between guanidinium and amino acids in the VS of NavAb/R2G. Grey dashed lines show interatomic distances shorter than 4 Å. See Extended Data Table 1 for details.
There are no crystal structures of a NaV VS in its resting state, because the resting state is only accessible at negative membrane potentials. However, we developed models of three resting states from disulfide-locking of substituted cysteine residues and structure prediction with the Rosetta algorithm26, which are consensus models of the actual resting states27,28. For a first glimpse of an open gating pore in the resting state of the VS, we introduced the R2G and R3G mutations into these resting state models and analyzed the resulting structures with the MOLE2 algorithm (Fig. 3d–f). The WT structure does not have a continuous transmembrane pathway through the VS (Fig. 3d), whereas the resting state of the NaVAb/R2G VS does indeed have a continuous water-accessible pathway (Fig. 3e). Loss of the sidechain of R2 leaves a gap at the HCS that is large enough for permeation of Na+ (Fig. 3e). In contrast, the transmembrane pathway is incomplete in NaVAb/R3G because the R2 sidechain occupies the HCS and blocks permeation (Fig. 3f). These structural models illustrate how HypoPP mutations in the R2 gating charge cause gating pore current in the resting state of the VS.
Guanidinium ions are highly permeant through the mutant gating pore of NaVAb/R2S, but much less permeant through NaVAb/R3G (Fig. 1)24. They are chemically similar to the distal moiety of the arginine side chain, and guanidine compounds with hydrophobic substituents can block mutant gating pores24. We probed our gating pore structures for guanidinium binding sites by soaking NavAb/R2G and NaVAb/R3G crystals with guanidinium and methylguanidinium to determine whether they would bind in place of the missing sidechain of R2 or R3. We did not find guanidinium bound to NaVAb/R3G. However, crystals of NaVAb/R2G soaked with guanidinium or methylguanidinium diffracted to 2.7 Å and 2.5 Å resolution, respectively, and unambiguous electron density was observed in place of each R2 side chain (Fig. 3g–i; Extended Data Fig. 5a, b). Bound guanidinium is clearly seen in 2Fo-Fc maps (Fig. 3h). E32 and M29 from S1, N49 from S2, R1 and R3 from S4, together with Q150 from an adjacent subunit form the binding site for guanidinium (Fig. 3i). M29 and R3 serve as a platform to bind guanidinium through two hydrogen bonds (Fig. 3h, i). The carbonyl group of E32 and the carbonyl oxygen of R1 further lock guanidinium in place (Fig. 3h, i). The binding site is flanked by hydrogen bonds from N49 and Q150 that stabilize guanidinium from opposite sides (Fig. 3h, i). The binding site for methylguanidinium is almost identical (Extended Data Fig. 5c, d). These images capture guanidinium bound at a specific site in the closed R2G gating pore. Amino acid residues responsible for guanidinium binding are highly conserved in NaVAb, NaV1.4, and CaV1.1 (Extended Data Fig. 1). Because substituted guanidinium ions can block gating pore current without major effects on NaV1.4 function24, guanidinium-containing compounds specific for this binding site could possibly be developed by structure-based drug design and used effectively in therapy of HypoPP.
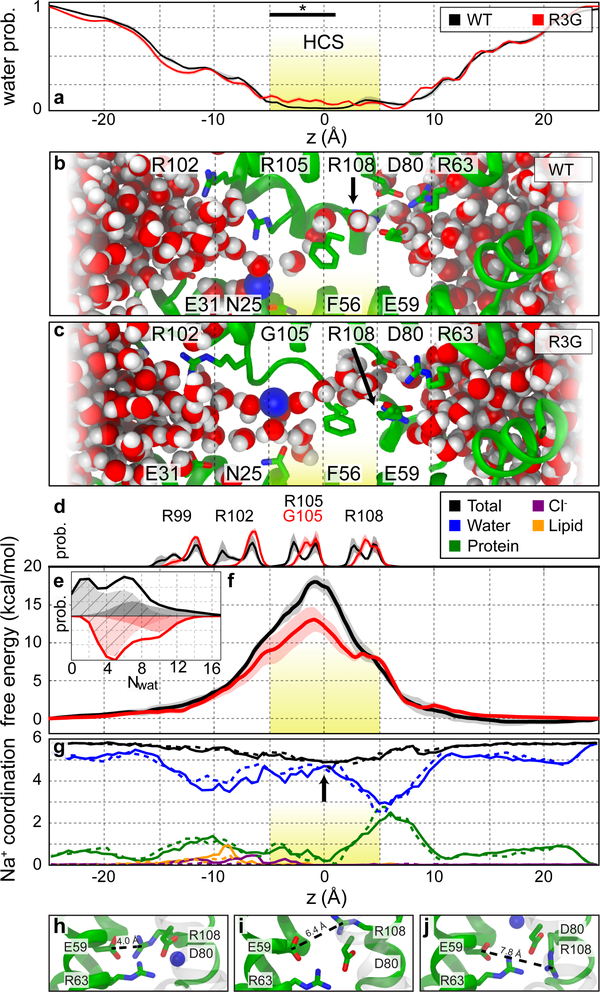
To examine relationships among structural fluctuations of the gating pore, ionic hydration, and Na+ leakage, we performed MD simulations of WT and R3G VS in a hydrated lipid bilayer (Fig. 4). Multiple unbiased simulation repeats, totaling 30 μs, show that the overall structures are conserved. Analysis of axial distributions of water molecules revealed a narrow region (−5 Å < z < 5 Å), which is more hydrated in R3G than WT owing to volume opened by the mutation (Fig. 4a–c, yellow; P<0.002, see Extended Data Table 2). The average count of water molecules within the HCS was 3.9±0.8 and 5.3±0.4 for WT and R3G, respectively (Fig. 4e). We performed guided simulations to compute the free energy of Na+ permeation along the principal axis of the VS. When Na+ was within the HCS, the number of water molecules increased to 8.4±0.3 and 9.0±0.3 for WT and R3G, respectively. The free-energy profile for Na+ translocation consists of a broad barrier spanning the HCS, centered at Cα of R3. The R3G mutation significantly decreases barrier height from 18±0.8 to 11±1.4 kcal/mol (Fig. 4f). These values are consistent with undetectable gating-pore conductance for WT and an upper limit of ∼0.1 pS for R3G29. Analysis of ionic coordination shows that, at the extracellular edge of the barrier, the first solvation shell of Na+ is almost exclusively composed of water, consistent with the hydrophobic nature of the bottleneck in the VS (Fig. 4g). The total coordination number of 5.81±0.02 in bulk water drops to 4.88±0.04 at the peak of the free-energy barrier, suggesting a large penalty for desolvating Na+ that is partially alleviated by creation of a cavity by removal of the R3 sidechain. Charge-charge repulsion is also likely to contribute substantially to the higher energy barrier to Na+ permeation in WT, which is reduced by the R3G mutation permitting pathogenic gating pore leakage.
Figure 4. R3G mutation lowers the free energy barrier for Na+ conductance.
a, Probability distribution of water along the domain axis for NavAb/WT (black) and NavAb/R3G (red). b and c, Representation of VS from NavAb/WT and NavAb/R3G simulations where Na+ (blue sphere) is restrained at z = −5 Å. The S2 segment (residues 45–65) is omitted for clarity. d, Axial distribution of gating charge Cα for NavAb/WT and NavAb/R3G. The axial position in the crystallographic structure is shown as a vertical line. e, Probability distribution of water in the HCS (−5 Å to 5 Å) across all simulations of WT (black) and R3G (red). The total probability is separated into frames where Na+ occupied the hydrophobic constriction (solid) or was outside this region (cross-hatched). f, Potential of mean force for Na+ conduction within the NavAb/WT (black) and NavAb/R3G (red) pore computed using umbrella sampling. Yellow highlights the HCS. g, Average coordination of Na+ as a function of ionic position along the VS principal axis, for NavAb/WT (solid lines) and NavAb/R3G (dashed lines). The first coordination shell of Na+ is partitioned for coordination to protein (green), water (blue), lipid headgroups (orange), and counterions (purple). h-j, Representative snapshots from NavAb/R3G simulations depicting R4 conformational isomerization. *, P<0.002, n = 60; see Extended Data Table 2 for details.
The location of R4 coincides with a secondary shoulder in the free-energy profiles (Fig. 4d, R108), indicating that movement of Na+ past R4 is not rate-limiting for permeation, even though transit of Na+ past R4 causes the greatest displacement of water by protein ligands (Fig. 4f). Spontaneous disruption of the R4-E59 salt bridge in 3±1% of simulation frames for WT and R3G opens the inner end of the gating pore with sufficient frequency to support gating pore current (Fig. 4h–j). Na+ often makes direct contacts with the anionic sidechains of D80 and E56 (Fig. 4g, h), and its movement is coupled to dynamic rearrangements of the R4 salt-bridge network.
Overall, our results provide an unprecedented high-resolution view of functional effects of ion channel mutations that cause periodic paralysis and define the structural basis for pathogenesis in this ion channelopathy. R2G and R3G mutations do not perturb VS backbone structure, arguing against conformational changes in transmembrane alpha helices as the basis for gating pore current. Instead, removal of the positively charged R2 and R3 side chains opens an aqueous gating pore that allows diffusion of Na+ into the cell, depending on the functional state of the VS. Our structural studies show how this pathogenic gating pore current is gated in resting and activated states by transmembrane movements of the S4 segment. Although our studies of R2G and R3G mutants lead to a straightforward explanation for their pathogenic gating pore current, HypoPP and NormoPP mutations that substitute large sidechains such as W also cause gating pore current4,16,17 and may perturb local structure of the VS as they open a pathogenic gating pore.
Our structures reveal the binding pose of a highly permeant ion, guanidinium, in the closed gating pore in the activated VS of NaVAb/R2G. Substituted guanidinium derivatives can block gating pore current without impairing VS function in NaV1.424. Therefore, our high-resolution structural models may provide molecular templates for design and development of drugs that would mimic guanidinium, block gating pore current, and provide symptomatic relief from periodic paralysis.
METHODS
Electrophysiology
All experiments were done using Trichopulsia ni insect cells (High Five Cells, Thermofisher). Molecular biology and patch-clamp measurements were performed as described previously15,30. All constructs showed high level expression that enabled us to measure ionic current and gating pore currents 48 h after infection. Whole-cell sodium currents were recorded using an amplifier (Axopatch 200; Molecular Devices) with glass micropipettes (2–4 MΩ). The intracellular pipette solution contained (mM): 35 NaCl, 105 CsF, 10 EGTA, and 10 HEPES, pH 7.4 (adjusted with CsOH). The extracellular solution contained (mM): 140 NaCl, 2 CaCl2, 1.8 MgCl2, and 10 HEPES, pH 7.4 (adjusted with NaOH).
For NaVAb/R2S, the standard clamp protocol for measuring central pore currents consisted of steps from a holding potential of −200 mV to voltages ranging from −180 to 0 mV in 10 mV steps. For NaVAb/R3G, cells were held at −160 mV and 10 mV voltage steps ranging from −140 to +50 were applied. A P/−10 or P/−4 leak subtraction protocol was used to subtract linear leak and capacitive currents from holding potentials of −200 or −160 respectively.
To measure gating pore currents in NaVAb/R2S, cells were held at −200 mV for ~ 1 min to allow recovery from slow inactivation. Then, the cells were held at −100 mV for gating pore current measurements, which inactivates the central pore current. Depolarizing pulses in 10 mV steps were applied from −200 mV up to +50 mV. The intracellular pipette solution contained (mM): 140 CsF, 10 EGTA, and 10 HEPES, pH 7.4 (adjusted with CsOH). The extracellular solution contained (mM): 140 NaCl, 2 CaCl2, 1.8 MgCl2, and 10 HEPES, pH 7.4 (adjusted with NaOH). To test gating pore selectivity for different cations, NaCl was replaced by an equimolar concentration of KCl, CsCl, LiCl, NMDG, or 40 mM guanidinium sulfate/100 mM NMDG, 40 mM methylguanidinium sulfate/100 mM NMDG, or 40 mM ethylguanidinium sulfate/100 mM NMDG.
To measure gating pore currents in NaVAb/R3G, cells were held at 0 mV for few min to induce slow inactivation. Then 10 mV pulses were applied from −200 mV up to +50 mV. To measure ion selectivity of R3G, the composition of external solution was in (mM): 140 NMDG-MS, 2 CaCl2, 10 HEPES. The intracellular solution contains either 140 mM NaF, 140 mM KF, or 140 mM CsF, in addition to 10 mM HEPES, 10 mM EGTA.
No online leak subtraction protocols were used during measuring gating pore currents. Linear leak subtraction was made offline by generating a linear fit to the I-V curves at voltage ranges +100 mV to 0 mV for NaVAb/R2S and between −200 mV and 0 mV NaVAb/R3G. Voltage-clamp pulses were generated and currents were recorded using Pulse software controlling an Instrutech ITC18 interface (HEKA). Data were analyzed using Igor Pro 6.37 software (WaveMetrics).
Protein Purification and Crystallization
R2G, R2S or R3G mutations were introduced into NavAb/I217C by site-directed mutagenesis (QuikChange; Agilent) and confirmed by sequencing. Protein was expressed and purified as described 6. Briefly, recombinant baculovirus was generated by using the Bac-to-Bac system (Invitrogen), and Trichopulsia ni cells (High Five Cells, Thermofisher), were infected for protein production. Protein was extracted with 1% digitonin (EMD Biosciences). After centrifugation, the supernatant was agitated with anti-Flag M2-agarose resin (Sigma). Flag resin was washed and eluted with Flag peptide, and the purified protein was analyzed by SDS-PAGE (Extended Data Fig. 6). Purified protein was then loaded onto a Superdex 200 column (GE Healthcare) in 10 mM Tris-HCl pH 8.0, 100 mM NaCl and 0.12% digitonin. The peak fraction was concentrated to ~17 mg ml−1 and reconstituted into DMPC:CHAPSO (Anatrace) bicelles. The protein-bicelle preparation was mixed in a 1:1 ratio and set in a hanging-drop vapour-diffusion format over a well solution containing 1.8–2.0 M ammonium sulphate, 100 mM Na-citrate pH 4.8–5.2. Crystals grew to full size in a week. Crystals were cryoprotected in well solution supplemented with 28% glucose (wt/v) in increments of 7% glucose during harvesting. Guanidnium or methyl guanidinium bound crystals were cryoprotected by soaking in the same cryoprotection solution plus 10 mM guanidinium ions. Crystals were plunged into liquid nitrogen for data collection.
Data Collection and Structure Determination
X-ray diffraction data was collected at Advanced Light Source (beamlines BL821 and BL822), and then integrated and scaled with the HKL2000 suite. Both NavAb/R2G and NavAb/R3G structures were solved by Phaser-MR using NavAb (PDB code 3RVY) monomer as searching model. After initial phases, models were refined with PHENIX31 and manually re-built using COOT32. High-resolution density maps clearly shown no side chain density for R2G or R3G. Simulated annealing omit maps were used to confirm the binding of guanidinium ions. The geometries of the final models were verified using MolProbity33. All solvent accessible volume analysis in the voltage-sensing modules was generated with MOLE234.
Molecular Modeling and Dynamics
Both molecular models of the NaVAb/WT and NaVAb/R3G channels were constructed using the NaVAb/I217C structure (PDB code: 3RVY)6. The latter model was generated by substituting R105 by G in all four VSDs. Both systems were embedded in a hydrated 1,2-dimyristoyl-sn-glycero-3-phosphatidylcholine (DMPC) bilayer with ~250 mM NaCl for a total of ~129,000 atoms. Embedding was performed using the alchembed protocol35 using an equilibrated rectangular CHARMM36 DMPC bilayer patch obtained from the Klauda laboratory website (https://terpconnect.umd.edu/~jbklauda/). The protein, lipids, and ions were modeled with the CHARMM36 all-atom force field36–38 and water molecules were modeled with TIP3P39. NBFIX adjustments were made for Na+-backbone carbonyl O atom and Na+-lipid head group interactions40,41.
All simulations were performed with GROMACS 5.0.642. Electrostatic interactions were calculated using particle-mesh Ewald algorithm43,44 with a real-space cut-off distance of 1.2 nm, a grid spacing of 0.16 nm, and cubic interpolation. Lennard-Jones interactions were cut off at 1.2 nm. Nonbonded interactions were calculated using Verlet neighbor lists45. All simulations were performed at constant temperature (300 K) using the Nosé-Hoover thermostat46,47 with temperature coupling of 0.5 ps and at constant pressure (1 atm) with the Parrinello-Rahman barostat48,49 with a time constant of 2 ps, respectively. All chemical bonds were constrained using the LINCS algorithm50. The integration timestep was 2 fs.
Because the channel and voltage sensor were initially devoid of water molecules and ions, a protein-restrained equilibration period of 30 ns was used to reduce the systematic sampling bias induced by the initial conditions (10 ns with protein heavy-atom restraints, 10 ns with backbone restraints, and 10 ns with Cα restraints, all with a force constant of 2.39 kcal/mol/Å2). Unbiased production simulations of fifteen replicas of “WT” and “R3G” systems were conducted for 1,000 ns each, resulting in aggregate sampling of 15 μs for each tetramer (4×15 μs = 60 μs for “WT” and “R3G” voltage sensors).
Simulation snapshots beyond t = 100 ns were extracted from unbiased simulations and used as initial conditions for biased simulations, using the entire tetramer. Umbrella sampling51,52 was used to compute the free energy or potential of mean force (PMF) profile for the movement of Na+ through voltage sensing domain. The range of the reaction coordinate, −2.0 to 2.0 nm with respect to the center of the hydrophobic constriction, was discretized into ~130 unevenly spaced windows. For each window, biased simulations were initiated with a water molecule exchanged for Na+ in all four VS. Production simulations were performed for 70–100 ns per window with a harmonic restraining potential force constant of 2.39 kcal/mol/Å2 and a flat-bottom cylindrical position restraint for all four Na+ ions simultaneously. The axial position of the permeating Na+ ion, z, was stored every 10 fs and the data from each of the four voltage sensors were used separately to generate four independent PMF profiles using g_wham53, enforcing cyclic periodicity of the PMF in the bulk (at z = −2.5 nm). The initial 10 ns were excluded from each umbrella sampling run. We report the mean PMF over the four voltage sensors with error bars computed using the standard error of mean over all four PMFs. The total simulation time for a single VS was 11 μs for each tetramer (4×11 μs = ~45 μs for “WT” and “R3G” voltage sensors).
Water occupancy of the voltage sensor was computed by counting the number of water oxygen atoms within a cylinder of radius 8.0 Å. We define the hydrophobic constriction center as the geometric center of Cα atoms of residues 22, 57, 84, and 105. The range of the HCS is defined as −5 Å to 5 Å along the axial coordinate of the VS. Coordination of Na+ to channel ligands, water, ions, and lipids was performed by computing the number of protein, water, and lipid O atoms, as well as Cl− ions, within the first solvation shell of Na+ (< 3.0 Å). The average coordination number at a given axial position was computed over all simulation frames regardless of the subunit, but the total coordination number in bulk water and at the hydrophobic constriction reported in the text was based on the mean and standard error of mean over the four voltage sensors. Analysis of the trajectories was performed using MDTraj54 and molecular renderings were generated using Visual Molecular Dynamics55.
Extended Data
Extended Data Figure 1 |. Sequence alignment of NavAb VS with human Nav1.4 DII VS, Nav1.4 DIV VS, Cav1.1 DII VS, and Cav1.1 DIV VS.
Colored rectangles represent TM helices. Black arrows indicate residues that form the guanidinium binding site, blue arrows indicate hydrophobic constriction site, and red arrows indicate the conserved intracellular negative cluster.
Extended Data Figure 2 |. Superposition of NavAb/WT VS and EeNav1.4 DIV VS.
a-b, Comparison of the conformations of NavAb/WT VS (orange) and EeNav1.4 VSDIV (grey) in side view and top view, respectively. Arg sensors and hydrophobic residues in the HCS are labeled and shown side chain in sticks.
Extended Data Figure 3 |. Superposition of the VS between NavAb/WT and mutants.
a-b, VS structure alignment between NavAb/WT (grey) and NavAb/R3G (green) in side view and top view, respectively. c-d, VS structure alignment between NavAb/WT (grey) and NavAb/R2G (cyan) in side view and top view, respectively. Arg sensors and hydrophobic residues in the HCS are labeled and shown side chain in sticks.
Extended Data Figure 4 |. R4 side chain conformational changes.
a, Different conformations of the R4 rotamer in NavAb/R3G Chain A (green) and Chain B (orange). b, Different conformations of the R4 rotamer in the four subunits of NaVAb in the slow-inactivated state (PDB code 4EKW).
Extended Data Figure 5 |. Electron density maps for bound guanidinium and methylguanidinium ions.
a, 2mFo – DFc electron density map (blue mesh) of residues around the methylguanidinium binding site at 1σ. b, Overlay of guanidinium binding site (green) and methylguanidinium binding site (orange). c-d, Simulated annealing map (Fo-Fc) contoured at 3σ for methylguanidinium and guanidinium, respectively.
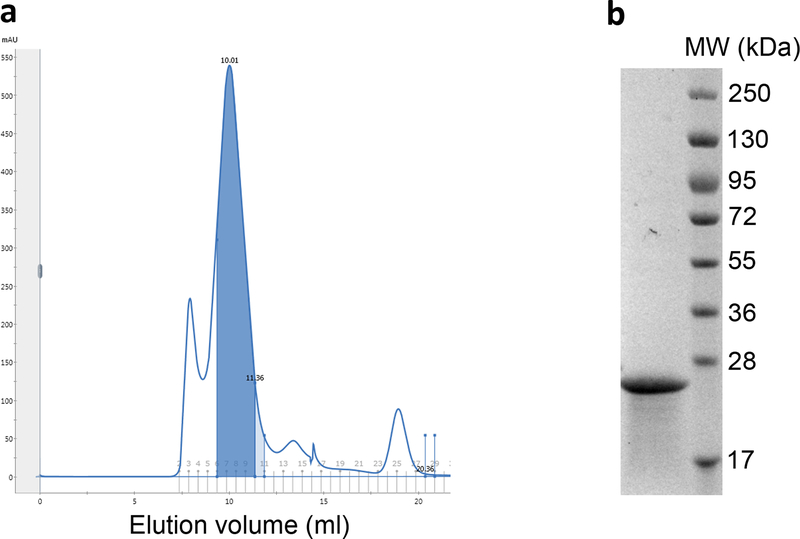
Extended Data Figure 6 |. Purification of NavAb/R3G.
a, A representative gel-filtration chromatography of NavAb/R3G, highlighted peak fractions were concentrated for crystallization. b, Concentrated sample was visualized on SDS-PAGE by Coomassie Blue staining.
Extended Data Table 1.
Data collection and refinement statistics.
| NavAb/R3G | NavAb/R2G Guanidinium | NavAb/R2G Methyl Guanidinium | NavAb/R2G Apo | |
|---|---|---|---|---|
| Data collection | ||||
| Space group | 1222 | 1222 | 1222 | P21221 |
| Cell dimensions | ||||
| a, b, c (Å) | 126.8, 127.0, 192.3 | 126.6, 126.6, 191.8 | 126.3, 126.2, 191.6 | 125.5, 125.6, 192.0 |
| α, β, γ (°) | 90, 90, 90 | 90, 90, 90 | 90, 90, 90 | 90, 90, 90 |
| Wavelength (Å) | 0.99994 | 0.99994 | 0.99994 | 0.99994 |
| Resolution (Å) | 50–2.90 (3.00–2.90) | 50–2.70 (2.80–2.70) | 50–2.55 (2.64–2.55) | 50–2.80 (2.90–2.80) |
| Rpim | 4.6 (62.6) | 4.0(62.0) | 3.9 (64.0) | 5.3 (58.1) |
| I/σI | 16.6(1.5) | 18.5 (1.2) | 18.5 (1.0) | 14.5 (0.8) |
| Completeness (%) | 100 (99.9) | 99.6 (96.5) | 99.4 (95.0) | 98.0 (81.6) |
| Redundancy | 7.3 (7.2) | 7.1 (5.4) | 5.3 (3.8) | 5.1 (3.2) |
| Refinement | ||||
| Resolution (Å) | 42.50–2.86 | 42.31–2.70 | 42.31–2.52 | 48.46–2.90 |
| No. reflections | 35059 | 41173 | 51039 | 67766 |
| Rwork/ Rfree | 21.25/23.99 | 20.98/24.59 | 20.31/22.66 | 23.35/26.03 |
| No. atoms | ||||
| Protein | 3606 | 3605 | 3673 | 7160 |
| Ligand/ion | 512 | 449 | 660 | 415 |
| Water | 0 | 5 | 35 | 0 |
| B-factors | ||||
| Protein | 108.7 | 97.8 | 103.1 | 112.89 |
| Ligand/ion | 128.2 | 107.5 | 130.8 | 115.8 |
| Water | 54.5 | 75.5 | ||
| R.m.s deviations | ||||
| Bond lengths (Å) | 0.010 | 0.010 | 0.009 | 0.012 |
| Bond angles (°) | 1.311 | 1.215 | 1.253 | 1.703 |
| Ramachandran plots | ||||
| Favored | 93.2% | 92.5% | 94.0% | 92.1% |
| Allowed | 6.8% | 7.3% | 5.4% | 7.4% |
| Outliers | 0.0% | 0.2% | 0.6% | 0.5% |
Extended Data Table 2.
Statistical analysis of VS water occupancy from molecular simulations. Results of two-way t-tests on differences in average water count in 1 Å segments of the VS axial coordinate comparing WT and R3G simulations. In each segment, we compare the mean of 60 values (n=60, obtained from pooling the mean water counts of the four VS proteins from each of 15 simulation repeats). The HCS region (−5 to 1 Å, bold) has the largest effect size, indicating a region of biological significance.
| Degrees of freedom | Axial Interval (Å,Å) | t-statistic | q value |
|---|---|---|---|
| 60+60−2 | (−20,−19) | 1.411 | 2.221 E-01 |
| (−19,−18) | 2.878 | 1.024E-02 | |
| (−18,−17) | 4.389 | 7.674E-05 | |
| (−17,−16) | 4.802 | 1.696E-05 | |
| (−16,−15) | 4.545 | 4.465E-05 | |
| (−15,−14) | 4.249 | 1.148E-04 | |
| (−14,−13) | 2.181 | 5.422E-02 | |
| (−13,−12) | 0.740 | 5.420E-01 | |
| (−12,−11) | 0.217 | 8.721 E-01 | |
| (−11,−10) | 2.760 | 1.276E-02 | |
| (−10,−9) | 4.283 | 1.078E-04 | |
| (−9,−8) | −0.110 | 9.364E-01 | |
| (−8,−7) | 1.914 | 9.279E-02 | |
| (−7,−6) | −5.668 | 4.626E-07 | |
| (−6,−5) | −5.839 | 2.674E-07 | |
| (−5,−4) | −9.376 | 6.032E-15 | |
| (−4,−3) | −12.075 | 9.500E-21 | |
| (−3,−2) | −11.945 | 9.674E-21 | |
| (−2,−1) | −10.018 | 2.422E-16 | |
| (−1,0) | −5.812 | 2.674 E-07 | |
| (0,1) | −7.910 | 1.027E-11 | |
| (1,2) | 1.488 | 1.993E-01 | |
| (2,3) | 1.813 | 1.073E-01 | |
| (3,4) | 2.797 | 1.205E-02 | |
| (4,5) | 5.497 | 9.078E-07 | |
| (5,6) | 2.476 | 2.672E-02 | |
| (6,7) | −3.688 | 8.593E-04 | |
| (7,8) | −8.074 | 5.198E-12 | |
| (8,9) | −3.257 | 3.462E-03 | |
| (9,10) | −1.302 | 2.522E-01 | |
| (10,11) | 1.220 | 2.809E-01 | |
| (11,12) | 0.482 | 7.211 E-01 | |
| (12,13) | −2.870 | 1.024E-02 | |
| (13,14) | 1.919 | 9.279E-02 | |
| (14,15) | −0.003 | 9.978E-01 | |
| (15,16) | 0.887 | 4.569E-01 | |
| (16,17) | 1.843 | 1.044E-01 | |
| (17,18) | 1.319 | 2.522E-01 | |
| (18,19) | 0.263 | 8.686E-01 | |
| (19,20) | 0.249 | 8.686E-01 |
Supplementary Material
Acknowledgements
We are grateful to the beamline staff at the Advanced Light Source (BL8.2.1 and BL8.2.2) for assistance during data collection and Dr. Jin Li for technical and administrative assistance. This research was supported by National Institutes of Health research grants R01 NS015751 (W.A.C.) and R01 HL112808 (W.A.C. and N.Z.), by the Howard Hughes Medical Institute (N.Z.), and by Canadian Institutes of Health Research grant MOP 130461 (R.P.)
Footnotes
Author Information. The authors declare no competing financial interests.
Data Availability. Coordinates and structure factors have been deposited in the Protein Data Bank: NavAb/R3G, 6C1E; NavAb/R2G Guanidinium, 6C1K; NavAb/R2G Methyl Guanidinium, 6C1M; NavAb/R2G ap, 6C1P.
References
- 1.Venance SL et al. The primary periodic paralyses: diagnosis, pathogenesis and treatment. Brain 129, 8–17 (2006). [DOI] [PubMed] [Google Scholar]
- 2.Cannon SC Sodium channelopathies of skeletal muscle. Handb Exp Pharmacol (2017) doi: 10.1007/164_2017_52. [Epub ahead of print]. [DOI] [PMC free article] [PubMed] [Google Scholar]
- 3.Sokolov S, Scheuer T & Catterall WA Gating pore current in an inherited ion channelopathy. Nature 446, 76–78 (2007). [DOI] [PubMed] [Google Scholar]
- 4.Struyk AF & Cannon SC A Na+ channel mutation linked to hypokalemic periodic paralysis exposes a proton-selective gating pore. J Gen Physiol 130, 11–20 (2007). [DOI] [PMC free article] [PubMed] [Google Scholar]
- 5.Vicart S et al. New mutations of SCN4A cause a potassium-sensitive normokalemic periodic paralysis. Neurology 63, 2120–2127 (2004). [DOI] [PubMed] [Google Scholar]
- 6.Sokolov S, Scheuer T & Catterall WA Depolarization-activated gating pore current conducted by mutant sodium channels in potassium-sensitive normokalemic periodic paralysis. Proc Natl Acad Sci U S A 105, 19980–19985 (2008). [DOI] [PMC free article] [PubMed] [Google Scholar]
- 7.Payandeh J, Scheuer T, Zheng N & Catterall WA The crystal structure of a voltage-gated sodium channel. Nature 475, 353–358 (2011). [DOI] [PMC free article] [PubMed] [Google Scholar]
- 8.Catterall WA & Zheng N Deciphering voltage-gated Na+ and Ca2+ channels by studying prokaryotic ancestors. Trends Biochem Sci 40, 526–534 (2015). [DOI] [PMC free article] [PubMed] [Google Scholar]
- 9.Catterall WA, Goldin AL & Waxman SG International Union of Pharmacology. XLVII. Nomenclature and structure-function relationships of voltage-gated sodium channels. Pharmacol Rev 57, 397–409 (2005). [DOI] [PubMed] [Google Scholar]
- 10.Yan Z et al. Structure of the Nav1.4-beta1 complex from electric eel. Cell 170, 470–482 e411 (2017). [DOI] [PubMed] [Google Scholar]
- 11.Shen H et al. Structure of a eukaryotic voltage-gated sodium channel at near-atomic resolution. Science (2017). [DOI] [PubMed] [Google Scholar]
- 12.Catterall WA Ion channel voltage sensors: structure, function, and pathophysiology. Neuron 67, 915–928 (2010). [DOI] [PMC free article] [PubMed] [Google Scholar]
- 13.Starace DM & Bezanilla F A proton pore in a potassium channel voltage sensor reveals a focused electric field. Nature 427, 548–553 (2004). [DOI] [PubMed] [Google Scholar]
- 14.Sokolov S, Scheuer T & Catterall WA Ion permeation through a voltage-sensitive gating pore in brain sodium channels having voltage sensor mutations. Neuron 47, 183–189 (2005). [DOI] [PubMed] [Google Scholar]
- 15.Gamal El-Din TM, Scheuer T & Catterall WA Tracking S4 movement by gating pore currents in the bacterial sodium channel NaChBac. J of Gen Physiol 144, 147–157 (2014). [DOI] [PMC free article] [PubMed] [Google Scholar]
- 16.Jurkat-Rott K, Groome J & Lehmann-Horn F Pathophysiological role of omega pore current in channelopathies. Front Pharmacol 3, 112 (2012). [DOI] [PMC free article] [PubMed] [Google Scholar]
- 17.Moreau A, Gosselin-Badaroudine P & Chahine M Biophysics, pathophysiology, and pharmacology of ion channel gating pores. Front Pharmacol 5, 53 (2014). [DOI] [PMC free article] [PubMed] [Google Scholar]
- 18.Wu F et al. A sodium channel knockin mutant (NaV1.4-R669H) mouse model of hypokalemic periodic paralysis. J Clin Invest 121, 4082–4094 (2011). [DOI] [PMC free article] [PubMed] [Google Scholar]
- 19.Wu F et al. A calcium channel mutant mouse model of hypokalemic periodic paralysis. J Clin Invest 122, 4580–4591 (2012). [DOI] [PMC free article] [PubMed] [Google Scholar]
- 20.Gosselin-Badaroudine P, Delemotte L, Moreau A, Klein ML & Chahine M Gating pore currents and the resting state of Nav1.4 voltage sensor domains. Proc Natl Acad Sci U S A 109, 19250–19255 (2012). [DOI] [PMC free article] [PubMed] [Google Scholar]
- 21.Moreau A, Gosselin-Badaroudine P, Boutjdir M & Chahine M Mutations in the voltage sensors of Domains I and II of Nav1.5 that are associated with arrhythmias and dilated cardiomyopathy generate gating pore currents. Front Pharmacol 6, 301 (2015). [DOI] [PMC free article] [PubMed] [Google Scholar]
- 22.Monteleone S et al. Mechanisms responsible for omega-pore currents in Cav calcium channel voltage-sensing domains. Biophys J 113, 1485–1495 (2017). [DOI] [PMC free article] [PubMed] [Google Scholar]
- 23.Chakrabarti N et al. Catalysis of Na+ permeation in the bacterial sodium channel NaVAb. Proc Natl Acad Sci U S A 110, 11331–11336 (2013). [DOI] [PMC free article] [PubMed] [Google Scholar]
- 24.Sokolov S, Scheuer T & Catterall WA Ion permeation and block of the gating pore in the voltage sensor of NaV1.4 channels with hypokalemic periodic paralysis mutations. J Gen Physiol 136, 225–236 (2010). [DOI] [PMC free article] [PubMed] [Google Scholar]
- 25.Payandeh J, Gamal El-Din TM, Scheuer T, Zheng N & Catterall WA Crystal structure of a voltage-gated sodium channel in two potentially inactivated states. Nature 486 135–139 (2012). [DOI] [PMC free article] [PubMed] [Google Scholar]
- 26.Yarov-Yarovoy V et al. Structural basis for gating charge movement in the voltage sensor of a sodium channel. Proc. Natl. Acad. Sci. U.S.A. 109 E93–E102 (2012). [DOI] [PMC free article] [PubMed] [Google Scholar]
- 27.Vargas E et al. An emerging consensus on voltage-dependent gating from computational modeling and molecular dynamics simulations. J Gen Physiol 140, 587–594 (2012). [DOI] [PMC free article] [PubMed] [Google Scholar]
- 28.Catterall WA, Wisedchaisri G & Zheng N The chemical basis for electrical signaling. Nat Chem Biol 13, 455–463 (2017). [DOI] [PMC free article] [PubMed] [Google Scholar]
- 29.Cooper KE, Gates PY & Eisenberg RS Diffusion theory and discrete rate constants in ion permeation. J Membr Biol 106, 95–105 (1988). [DOI] [PubMed] [Google Scholar]
- 30.Gamal El-Din TM, Martinez GQ, Payandeh J, Scheuer T & Catterall WA A gating charge interaction required for late slow inactivation of the bacterial sodium channel NavAb. J Gen Physiol 142, 181–190 (2013). [DOI] [PMC free article] [PubMed] [Google Scholar]
- 31.Adams PD et al. PHENIX: a comprehensive Python-based system for macromolecular structure solution. Acta Crystallogr D Biol Crystallogr 66, 213–221 (2010). [DOI] [PMC free article] [PubMed] [Google Scholar]
- 32.Emsley P & Cowtan K Coot: model-building tools for molecular graphics. Acta Crystallogr D Biol Crystallogr 60, 2126–2132 (2004). [DOI] [PubMed] [Google Scholar]
- 33.Chen VB et al. MolProbity: all-atom structure validation for macromolecular crystallography. Acta Crystallogr D Biol Crystallogr 66, 12–21 (2010). [DOI] [PMC free article] [PubMed] [Google Scholar]
- 34.Petrek M, Kosinova P, Koca J & Otyepka M MOLE: a Voronoi diagram-based explorer of molecular channels, pores, and tunnels. Structure 15, 1357–1363 (2007). [DOI] [PubMed] [Google Scholar]
- 35.Jefferys E, Sands ZA, Shi J, Sansom MSP & Fowler PW Alchembed: a computational method for incorporating multiple proteins into complex lipid geometries. J Chem Theory Comp 11, 2743–2754 (2015). [DOI] [PMC free article] [PubMed] [Google Scholar]
- 36.MacKerell AD et al. All-atom empirical potential for molecular modeling and dynamics studies of proteins. J Phys Chem B 102, 3586–3616 (1998). [DOI] [PubMed] [Google Scholar]
- 37.Klauda JB et al. Update of the CHARMM all-atom additive force field for lipids: validation on six lipid types. J Phys Chem B 114, 7830–7843 (2010). [DOI] [PMC free article] [PubMed] [Google Scholar]
- 38.Best RB et al. Optimization of the additive CHARMM all-atom protein force field targeting improved sampling of the backbone phi, psi and side-chain chi(1) and chi(2) dihedral angles. J Chem Theory Comput 8, 3257–3273 (2012). [DOI] [PMC free article] [PubMed] [Google Scholar]
- 39.Jorgensen WL, Chandrasekhar J, Madura JD, Impey RW & Klein ML Comparison of simple potential functions for simulating liquid water. J Chem Phys 79, 926–935 (1983). [Google Scholar]
- 40.Noskov SY & Roux B Control of ion selectivity in LeuT: two Na+ binding sites with two different mechanisms. J Mol Biol 377, 804–818 (2008). [DOI] [PMC free article] [PubMed] [Google Scholar]
- 41.Venable RM, Luo Y, Gawrisch K, Roux B & Pastor RW Simulations of anionic lipid membranes: development of interaction-specific ion parameters and validation using NMR data. J Phys Chem B 117, 10183–10192 (2013). [DOI] [PMC free article] [PubMed] [Google Scholar]
- 42.Abraham MJ et al. GROMACS: High performance molecular simulations through multi-level parallelism from laptops to supercomputers. SoftwareX, 1–7 (2015). [Google Scholar]
- 43.Darden T, York D & Pedersen L Particle mesh Ewald: An N⋅log(N) method for Ewald sums in large systems. J Chem Phys 98, 10089–10092 (1993). [Google Scholar]
- 44.Essmann U et al. A Smooth particle mesh Ewald method. J Chem Phys 103, 8577–8593 (1995). [Google Scholar]
- 45.Verlet L Computer “experiments” on classical fluids. I. thermodynamical properties of Lennard-Jones molecules. Phys Rev 159, 98–103 (1967). [Google Scholar]
- 46.Hoover WG Canonical dynamics: equilibrium phase-space distributions. Phys Rev A 31, 1695 (1985). [DOI] [PubMed] [Google Scholar]
- 47.Nosé S A molecular dynamics method for simulations in the canonical ensemble. Mol Phys 52, 255–268 (1984). [Google Scholar]
- 48.Parrinello M & Rahman A Crystal structure and pair potentials: A molecular-dynamics study. Phys Rev Lett 45, 1196–1199 (1980). [Google Scholar]
- 49.Nosé S & Klein ML Constant pressure molecular dynamics for molecular systems. Mol Phys 50, 1055–1076 (1983). [Google Scholar]
- 50.Hess B P-LINCS: A parallel linear constraint solver for molecular simulation. J Chem Theory Comp 4, 116–122 (2008). [DOI] [PubMed] [Google Scholar]
- 51.Torrie GM & Valleau JP Nonphysical sampling distributions in Monte Carlo free-energy estimation: Umbrella sampling. J Comp Phys 23, 187–199 (1977). [Google Scholar]
- 52.Roux B The calculation of the potential of mean force using computer simulations. Computer Phys Comm 91, 275–282 (1995). [Google Scholar]
- 53.Hub JS, de Groot BL & van der Spoel D g_wham-A free weighted histogram analysis implementation including robust error and autocorrelation estimates. J Chem Theory and Comp 6, 3713–3720 (2010). [Google Scholar]
- 54.McGibbon RT et al. MDTraj: A modern open library for the analysis of molecular dynamics trajectories. Biophys J 109, 1528–1532 (2015). [DOI] [PMC free article] [PubMed] [Google Scholar]
- 55.Humphrey W, Dalke A & Schulten K VMD: visual molecular dynamics. J Mol Graph 14, 33–38 (1996). [DOI] [PubMed] [Google Scholar]
Associated Data
This section collects any data citations, data availability statements, or supplementary materials included in this article.


