

Abstract
Background:
Henoch-Schonlein purpura nephritis (HSPN) is a very common secondary kidney disease of childhood. Its pathogenesis and the treatment mechanism of glucocorticoid have not been fully elucidated. The aim of this study was to determine the relationship between p300 and the pathogenesis, glucocorticoid therapy in mice with HSPN, respectively.
Methods:
Forty-eight C57BL/6N male mice, weighing 18 to 20 g, were selected (3–4 weeks old, n = 8 per group). The mice in the normal control group (Group I) were given normal solvent and the HSPN model group (Group II) were given sensitizing drugs. The mice in Group III were injected intraperitoneally with dexamethasone after being given sensitizing drugs. Meanwhile, mice in Groups IV, V and VI with conditional knockout of p300 were also given normal solvent, sensitizing drugs and dexamethasone.
The levels of serum IgA, creatinine, and circulating immune complex (CIC) concentrations, 24 h urinary protein and urinary erythrocyte in C57 wild mice, and p300 conditional knockout mice in each group were measured. The expression of p300 in renal tissues and the expression of glucocorticoid receptor (GR) α and β, transforming growth factor (TGF)-β1, and activator protein (AP)-1 after dexamethasone treatment were determined by real-time polymerase chain reaction and Western blotting.
Results:
Compared with the normal solvent control group (Group I), the expression of p300 mRNA in the model group (Group II) was significantly up-regulated. Western blotting further confirmed the result. Urinary erythrocyte count, 24 h urinary protein quantification, serum IgA, CIC, and renal pathologic score in Group V were distinctly decreased compared with non-knockout mice in Group II (9.7 ± 3.8 per high-power field [/HP] vs. 18.7 ± 6.2/HP, t = 1.828, P = 0.043; 0.18 ± 0.06 g/24 h vs. 0.36 ± 0.08 g/24 h, t = 1.837, P = 0.042; 18.78 ± 0.85 mg/mL vs. 38.46 ± 0.46 mg/mL, t = 1.925, P = 0.038; 0.80 ± 0.27 μg/mL vs. 1.64 ± 0.47 μg/mL, t = 1.892, P = 0.041; 7.0 ± 0.5 vs. 18.0 ± 0.5, t = 1.908, P = 0.039). Compared with non-knockout mice (Group III), the level of urinary erythrocyte count and serum IgA in knockout mice (Group VI) increased significantly after treatment with dexamethasone (3.7 ± 0.6/HP vs. 9.2 ± 3.5/HP, t = 2.186, P = 0.024; 12.38 ± 0.26 mg/mL vs. 27.85 ± 0.65 mg/mL, t = 1.852, P = 0.041). The expression level of GRα was considerably increased in the knockout group after dexamethasone treatment compared with non-knockout mice in mRNA and protein level (t = 2.085, P = 0.026; t = 1.928, P = 0.035), but there was no statistically significant difference in the expression level of GRβ between condition knockout and non-knockout mice (t = 0.059, P = 0.087; t = 0.038, P = 1.12). Furthermore, the expression levels of glucocorticoid resistance genes (AP-1 and TGF-β1) were notably increased after p300 knockout compared with non-knockout mice in mRNA and protein level (TGF-β1: t = 1.945, P = 0.034; t = 1.902, P = 0.039; AP-1: t = 1.914, P = 0.038; t = 1.802, P = 0.041).
Conclusions:
p300 plays a crucial role in the pathogenesis of HSPN. p300 can down-regulate the expression of resistance genes (AP-1 and TGF-β1) by binding with GRα to prevent further renal injury and glucocorticoid resistance. Therefore, p300 is a promising new target in glucocorticoid therapy in HSPN.
Keywords: p300, Henoch-Schonlein purpura nephritis, Pathogenesis, Glucocorticoid treatment
Introduction
Henoch-Schonlein purpura (HSP) is a chronic, progressive, aseptic, multi-systemic vasculitis, which occurs in children aged 2 to 8 years; the basic pathologic change is diffuse vasculitis accompanied by immunoglobulin IgA deposition in the skin, joints, kidneys, gastrointestinal tract, and other systems of the body. In about 80% to 100% of children, the kidney is affected resulting in HSP nephritis (HSPN), the incidence of which is second only to acute nephritis and nephritic syndrome.[1] As yet, the pathogenesis of HSPN has not been fully elucidated. It is generally believed that HSPN is related to aberrant immune function. It is perhaps an immune-mediated glomerular injury, which includes T lymphocyte dysfunction, humoral immune disorder, abnormal secretion of cytokines, inflammation, coagulation, and fibrinolysis abnormalities, as well as gene susceptibility. Renal involvement and its severity are important indicators of long-term prognosis in HSPN.[2] Glucocorticoids have dual effects, such as anti-inflammatory and immunosuppressive influences. They are routinely used in the treatment of HSPN, especially in the acute stage.[3]
p300 is a key regulator in the transcriptional activation of glucocorticoid. It has limited expression in the nuclear membrane and exerts an amplifier effect on target genes by binding to nuclear receptors and transcription-related proteins. The most important function of p300 is to promote target gene transcription. First, acetylation can alleviate the promoter inhibition mediated by the chromatin structure and restore the basic transcriptor effect of the target gene promoter. Second, p300 can act as a bridge or scaffold in the interaction between the basic transcription device and its upstream transcription factors to stabilize the structure of the transcription complex. As in transcription, DNA replication and repair also require p300. It can interact with cyclins and cyclin-dependent kinases, and then participate in cell cycle arrest and apoptosis. Furthermore, p300 has a transcriptional amplifier effect on transactivation of glucocorticoid receptors (GRs).[4] Current studies show that p300 can be recruited by some transcription factors or compounds without histone acetyltransferase (HAT) activity, and modulate interleukin-mediated transcriptional regulation by some related genes, promotion of interleukin self-expression,[5] inhibition of polyglutamine protein-mediated transcriptional activation in neurodegenerative diseases,[6] and nuclear transcription factors involved in lipid metabolism, such as sterols. p300 also plays a role in the action of sterol regulatory element binding proteins combined with the corresponding target genes.[7] In addition, p300 is also involved in the regulation of insulin, cardiomyocytes, hematopoietic stem cells, and human immunodeficiency virus proliferation.[8,9]
Currently, there are no reports on the relationship between p300 and glucocorticoid resistance in the pathogenesis of HSPN. As p300 participates in the transcriptional regulation of GR-mediated target gene, we hypothesize that down-regulation of expression of p300 in HSPN may interfere with GRα activation, nuclear translocation, DNA connectivity, and the process of target gene transcription to some extent, thus hindering further downstream effects of glucocorticoid.
Methods
Ethical approval
All experimental procedures for animal usage were in accordance with the guidelines for care and use of laboratory animals and were approved by the Institutional Animal Care and Use Committee of China Medical University.
Animals
Three- to four-week-old C57BL/6N male mice, weighing 18 to 20 g, were selected, which obtained from Animal Research Center of China Medical University (Shenyang, China). After breeding accustomization for 1 week, the mice were given bovine serum albumin (BSA; Sigma, Saint Louis, USA), lipopolysaccharide (LPS; Sigma), and carbon tetrachloride (CCl4; Sigma) to establish an HSPN model: 10% BSA was prepared with distilled water and 4 mL/kg was infused into the stomach every other day for 8 weeks; 0.3 mL castor oil (Dingde Biotechnology Co, Nanjing, China) mixed with 0.1 mL CCl4 was injected subcutaneously once a week for 9 weeks; 0.025% LPS was prepared with 0.9% sodium chloride solution and 0.2 mL of this was injected into the tail vein at 6, 8, 10, and 12 weeks; 10 mL/kg of 25% ginger water (Affiliated Hospital of Liaoning University of Traditional Chinese Medicine, Shenyang, China) was given every other day from the ninth week. The room temperature was adjusted to 30°C during the modeling period, we labeled this mouse model group as Group II. The same amount of distilled water was infused into the stomach of the normal control group (Group I), 0.9% sodium chloride solution was injected subcutaneously into the tail vein. At the end of the 12th week, 24 h urine was collected in a metabolic cage and the urine volume was recorded. Meanwhile, 1.0 mg/kg of dexamethasone (Dingde Biotechnology Co) was injected intraperitoneally, once a day, for 4 weeks continuously, and we regarded this group as Group III.[10,11] We administered the same allergenic drugs as those given to Group II to the p300 kidney specific knockout C57BL/6N male mice, and labeled this group as Group V. At the end of the 12th week, 1.0 mg/kg of dexamethasone was injected intraperitoneally, once a day, for 4 weeks continuously (like Group III) and we described this group as Group VI. To increase comparability, the knockout mice were given the normal solvent as administered to Group I and we registered this group of knockout mice as Group IV. Finally, there were eight mice in each group.
Acquisition of p300 kidney specific knockout mice
After multiplication and reproduction of p300-loxP heterozygote mice (Cyagen Biosciences Inc, Guangzhou, China), F0 generation mice (p300flox/+) were obtained. Then F1 generation mice derived from the self-pollination of F0 generation mice (p300flox/+), including homozygous mice (p300flox/flox), hybrid mice (p300flox/+), and wild mice (p300+/+) were obtained. According to Mendel's law of inheritance, the probability of obtaining these mice is 1/4, 1/2, and 1/4, respectively. F2 generation mice were obtained by mating homozygous mice (p300flox/flox) from F1 generation with CRE tool hybrid mice. All the offspring represented p300flox/+, and then p300flox/+-cre+ mice were screened out. F2 generation mice were backcrossed with p300flox/flox to obtain F3 generation mice. Finally, p300flox/flox-cre+ mice, which were needed in our experiments, were selected out.
Renal function measurement and biochemical analysis
To assess renal function, spot urine and serum samples from the mice were collected immediately before sacrifice. Serum and urine samples, for measurement of serum IgA, creatinine (Cr), circulating immune complex (CIC) concentrations, and 24 h urinary protein and urinary erythrocyte were delivered to the core laboratory of the First Affiliated Hospital of China Medical University (Shenyang, China).
Hematoxylin-eosin staining
Hematoxylin-eosin (HE) staining was performed to assess the morphologic changes in injured renal tissue. Briefly, the renal tissues were fixed in 4% paraformaldehyde, embedded in paraffin, and then sectioned into 5 μm slices for HE staining according to standard procedure. The sections were photographed in five random fields under a microscope (Leica, Wetzlar, Germany).
Real-time polymerase chain reaction analysis
Total RNA was isolated using TRIzol reagent (Invitrogen Co, San Diego, USA) according to the manufacturer's instructions, and cDNA was generated through reverse transcription using the PrimeScript RT Master Mix kit (TaKaRa Bio Inc, Osaka, Japan). Equal amounts of cDNA were diluted and amplified through real-time polymerase chain reaction (PCR) using All-in-one qPCR Mix (TaKaRa Bio Inc) in a 20 μL reaction volume containing 10 μL of 2 × All-in-one qPCR Mix (TaKaRa Bio Inc), 1 μL of 2 mmol/L forward primer, 1 μL of 2 mmol/L reverse primer, 1 μL of cDNA, and 6 μL of nuclease-free water. After an initial denaturation step for 10 min at 95°C, the conditions for cycling were 40 cycles of 10 s at 95°C, 20 s at 60°C, and 15 s at 72°C. For the normalization of each sample, glyceraldehyde 3-phosphate dehydrogenase (GAPDH; TaKaRa Bio Inc) primers were used to measure the amount of GAPDH cDNA. The primers used are listed below: GAPDH: sense: 5′-TCGCCAGCCGAGCCACAT-3′, antisense: 5′-GGAACATGTAAACCATGTAGTTG-3′; p300: sense: 5′-ACTGCCGGGATGGCTACTAT-3′, antisense: 5′-TCTGGATTCGCTGGCTAATGG-3′; transforming growth factor (TGF)-β1: sense: 5′-TGAGGGCTGTCTTTTGACG-3′, antisense: 5′-GTTTGGGACTGATCCCATTG-3′; AP-1: sense: 5′-TGACTGCAAAGATGGAAACGA-3′, antisense: 5′-CAGGTTCAAGGTCATGCTCTGT-3′; GRα: sense: 5′-CCTAAGGACGGTCTGAAGAGC-3′, antisense: 5′-GCCAAGTCTTGGCCCTCTAT-3′; GRβ: sense: 5′-CCTAAGGACGGTCTGAAGAGC-3′, antisense: 5′-CCACGTATCCTAAAAGGGCAC-3′. The relative fold-change in the target gene cDNA was determined using the 2−ΔΔCt method.
Western blotting analysis
The protein levels in renal tissues were detected by Western blotting analysis. Briefly, the renal tissues from different groups were lyzed by Radio-Immunoprecipitation Assay lysis buffer (Beyotime Bio Inc, Shanghai, China). The protein concentrations were determined by BCA protein estimation kit (Beyotime Bio Inc). Then, equal amounts of protein samples were separated by sodium dodecyl sulfate-polyacrylamide gel electrophoresis (Beyotime Bio Inc), and transferred to polyvinylidene difluoride membranes (Beyotime Bio Inc). After blocking with 5% non-fat dry milk, the membranes were incubated with primary antibodies at 4°C overnight. The primary antibodies used in this study were as follows: GRα (BOSTER Bio Inc, Wuhan, China), GRβ (Bioss Bio Inc, Beijing, China), TGF-β1 (BOSTER Bio Inc), activator protein (AP)-1 (Bioss Bio Inc), and GAPDH (Santa Cruz Bio Inc, Santa Cruz, USA). Then the corresponding secondary antibodies conjugated with horseradish peroxidase were added. ECL detection reagent (7 Sea Biotech, Shanghai, China) was used to visualize the blots. The results were quantified with Gel-Pro-Analyzer (Media Cybernetics, Maryland, USA).
Statistical analysis
Data were collected from eight animals for each group and presented as mean ± standard deviation from at least three independent experiments. All analyses were performed using GraphPad Prism 5.0 (GraphPad Software, San Diego, CA, USA). Statistical significance between two groups was analyzed by Student's t test. One-way analysis of variance (ANOVA) or two-way ANOVA was used to compare multiple groups. A P value of <0.05 was considered significant.
Results
p300 expression was up-regulated in the HSPN model
First, we determined p300 expression in the HSPN model using real-time PCR and Western blotting. We observed that p300 expression, at the levels of mRNA and protein, was significantly elevated in the HSPN model (Group II) compared with solvent-matched controls (Group I) (t = 2.426, P = 0.026; t = 1.825, P = 0.034) [Figure 1A–1C]. We, therefore, concluded that p300 plays an essential role in the pathogenesis of HSPN. In p300 knockout mice, there was near total absence of expression of p300 in Groups IV and V by real-time PCR, which indicates that the knockout mice were accurate. Next, we took a closer look at the effect of p300 knockout on renal biochemical indexes and pathology of HSPN.
Figure 1.
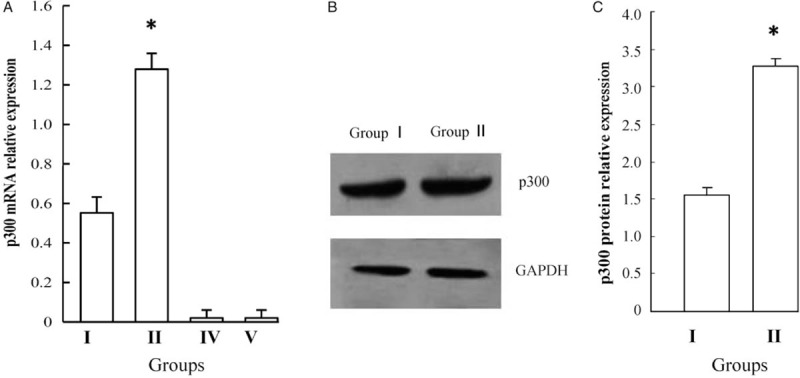
Expression of p300 at mRNA in Groups I, II, III and IV (A) and protein level in Groups I and II (B and C). p300 expression, at the levels of mRNA and protein, was significantly elevated in Group II compared with Group I (∗P < 0.05). Group I: Normal control group; Group II: Non-knockout model group; Group IV: p300 knockout control group; Group V: p300 knockout model group.
Renal injury was distinctly alleviated after p300 conditional knockout
To further investigate the role of p300 in the pathogenesis of HSPN, serum IgA, Cr, and CIC concentrations, 24 h urinary protein and urinary erythrocyte count were measured. We observed that the levels of urinary erythrocyte count, 24 h urinary protein, serum IgA, and CIC were significantly elevated in Group II compared with Group I (18.7 ± 6.2 per high-power field [/HP] vs. 0.5 ± 0.1/HP, t = 2.725, P = 0.008; 0.36 ± 0.08 g/24 h vs. 0.14 ± 0.04 g/24 h, t = 2.265, P = 0.012; 38.46 ± 0.46 mg/mL vs. 9.15 ± 0.55 mg/mL, t = 2.862, P = 0.006; 1.64 ± 0.47 μg/mL vs. 0.72 ± 0.20 μg/mL, t = 1.835, P = 0.042). After p300 kidney specific knockout, the levels of urinary erythrocyte count and serum IgA were also considerably increased in Group V compared with Group IV (9.7 ± 3.8/HP vs. 0.5 ± 0.1/HP, t = 2.486, P = 0.018; 18.78 ± 0.85 mg/mL vs. 9.88 ± 0.60 mg/mL, t = 1.825, P = 0.043). However, there were no differences between these two groups in 24 h urinary protein and CIC (0.18 ± 0.06 g/24 h vs. 0.13 ± 0.03 g/24 h, t = 0.012, P = 0.095; 0.80 ± 0.27 μg/mL vs. 0.74 ± 0.27 μg/mL, t = 0.086, P = 0.098). Moreover, we found that Cr concentrations were unchanged between these four groups. In addition, we found that levels of urinary erythrocyte count, 24 h urinary protein, serum IgA, and CIC were evidently different between the p300 non-knockout group (Group II) and conditional knockout mice group (Group V) (18.7 ± 6.2/HP vs. 9.7 ± 3.8/HP, t = 1.828, P = 0.043; 0.36 ± 0.08 g/24 h vs. 0.18 ± 0.06 g/24 h, t = 1.837, P = 0.042; 38.46 ± 0.46 mg/mL vs. 18.78 ± 0.85 mg/mL, t = 1.925, P = 0.038; 1.64 ± 0.47 μg/mL vs. 0.80 ± 0.27 μg/mL, t = 1.892, P = 0.041). From these results, we concluded that renal injury was significantly alleviated after p300 conditional knockout, which indirectly demonstrates that p300 participates in the pathogenesis of HSPN [Figure 2A–2E].
Figure 2.
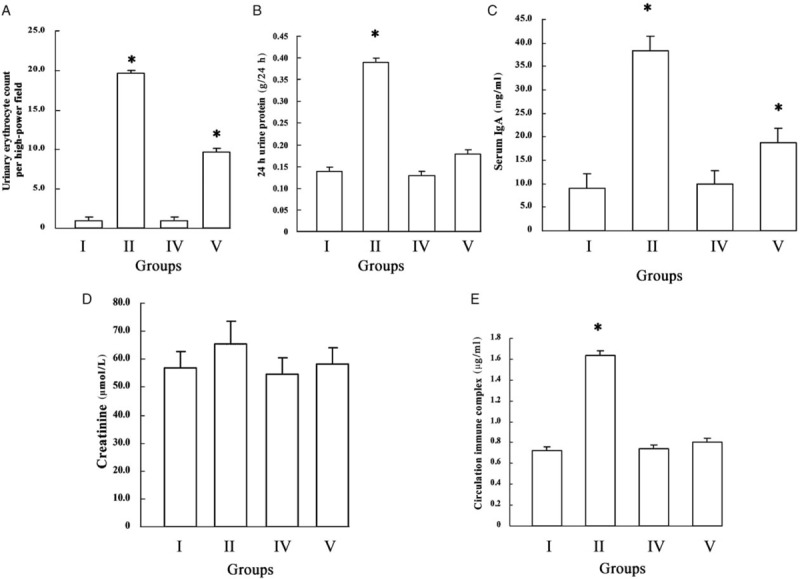
Renal biochemical indexes between p300 non-knockout (Group I: Normal control group; Group II: model group) and conditional knockout mice (Group IV: p300 knockout control group; Group V: p300 knockout model group). (A) Urinary erythrocyte count. (B) 24 h urinary protein. (C) Serum IgA. (D) Creatinine. (E) CIC. Urinary erythrocyte count, 24 h urinary protein, serum IgA, and CIC were significantly elevated in Group II compared with Group I (∗P < 0.05). After p300 kidney specific knockout, the levels of urinary erythrocyte count and serum IgA were also significantly increased in Group V compared with Group IV (∗P < 0.05). However, there were no differences between these two groups in 24 h urinary protein and CIC. Moreover, creatinine concentrations were unchanged between these four groups. In addition, levels of urinary erythrocyte count, 24 h urinary protein, serum IgA, and CIC were evidently different between p300 non-knockout and conditional knockout mice (∗P < 0.05). CIC: Circulating immune complex.
Pathologic score of kidney on HE staining decreased significantly after p300 knockout
To fully explore the role of p300 in the pathogenesis of HSPN, we also perfected the HE staining of kidney pathology. Glomerular cystic exudation, hemorrhage, mesangial hyperplasia, tubular protein type, interstitial fibrosis, and glomerulosclerosis appeared in HSPN from Group II. According to Katafuchi's semi-quantitative score,[12] we found that allergenic drugs were given similarly after p300 knockout, and the pathologic score of kidney as well as renal morphologic changes decreased significantly (18.0 ± 0.5 vs. 7.0 ± 0.5, t = 1.908, P = 0.039), which further confirms that p300 plays an important role in the pathogenesis of HSPN [Figure 3A–3C].
Figure 3.
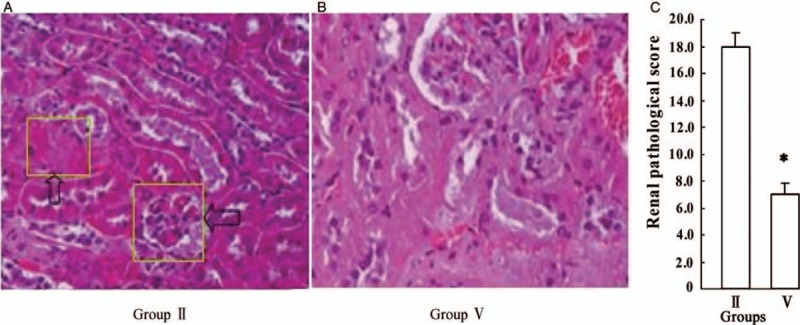
Comparison of morphologic changes and pathologic score of kidney between p300 non-knockout and conditional knockout mice. (A) Renal morphologic changes including glomerular cystic exudation, hemorrhage, mesangial hyperplasia, tubular protein type, interstitial fibrosis and glomerulosclerosis in Group II (hematoxylin-eosin staining, original magnification ×200). (B) Renal morphologic changes in Group V (hematoxylin-eosin staining, original magnification ×200). (C) Pathologic score of kidney between Group II and V. Allergenic drugs were given similarly after p300 knockout (Group V); the pathologic score of kidney decreased significantly compared with p300 non-knockout mice (Group II) (∗P < 0.05). Group II: Non-knockout model group; Group V: p300 knockout model group.
Urinary erythrocyte count and serum IgA between p300 non-knockout and conditional knockout mice after dexamethasone treatment
It is well known that dexamethasone is routinely used for the treatment of HSPN. To further confirm the relationship between p300 and dexamethasone in the treatment of HSPN, we examined whether once p300 was knocked out, renal biochemical indexes changed after dexamethasone treatment. As expected, the levels of urinary erythrocyte count and serum IgA were distinctly increased in Group VI compared with Group III (9.2 ± 3.5/HP vs. 3.7 ± 0.6/HP, t = 2.186, P = 0.024; 27.85 ± 0.65 mg/mL vs. 12.38 ± 0.26 mg/mL, t = 1.852, P = 0.041). There were no differences between p300 non-knockout and conditional knockout mice in 24 h urinary protein, and Cr and CIC concentrations (0.27 ± 0.04 g/24 h vs. 0.36 ± 0.08 g/24 h, t = 0.062, P = 0.084; 62.12 ± 11.6 μmol/L vs. 57.87 ± 7.35 μmol/L, t = 0.037, P = 1.12; 1.13 ± 0.31 μg/mL vs. 1.64 ± 0.47 μg/mL, t = 0.049, P = 0.098) [Figure 4A–4E]. Additionally, we found p300 could significantly affect the therapeutic action of dexamethasone, especially the levels of hematuria and serum IgA concentrations in HSPN mice; hence, the role of p300 in therapeutic mechanisms was investigated next.
Figure 4.
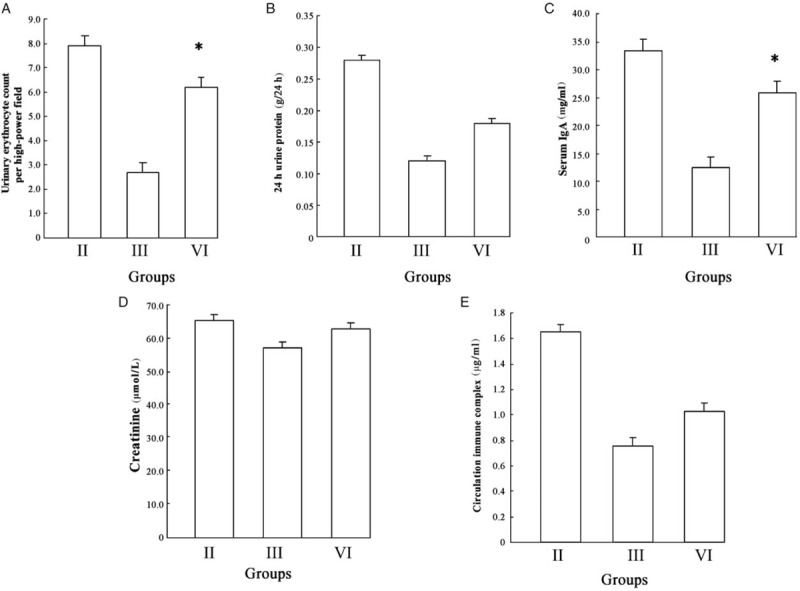
Comparison from renal biochemical indexes between p300 non-knockout and conditional knockout mice the same as dexamethasone treated. (A) Urinary erythrocyte count. (B) 24 h urinary protein. (C) Serum IgA. (D) Creatinine. (E) Circulating immune complex. The level of urinary erythrocyte count and serum IgA were distinctly increased in Group VI compared with Group III after dexamethasone treatment (∗P < 0.05). There were no differences in 24 h urinary protein, and creatinine and circulating immune complex concentrations between p300 non-knockout and conditional knockout mice after dexamethasone treatment. Group II: Non-knockout model group; Group III: Non-knockout dexamethasone therapy group; Group VI: p300 knockout dexamethasone therapy group.
p300 combined with GRα can play a crucial role in the treatment of HSPN
Next, we tested p300 binding with GR to clarify its mechanism of action in the treatment of HSPN. Real-time PCR and Western blotting results revealed that GRα expression was significantly higher in Group VI in comparison with Group III (t = 2.085, P = 0.026; t = 1.928, P = 0.035), whereas GRβ expression did not differ notably (t = 0.059, P = 0.087; t = 0.038, P = 1.12) [Figure 5A–5C]. This shows that p300 knockdown causes a significant increase in GRα, whereas GRβ remains unchanged, indicating that p300 combines with GRα and plays a crucial role in the treatment of HSPN. Moreover, we speculated that p300 was a crucial mediator of dexamethasone treatment in HSPN.
Figure 5.
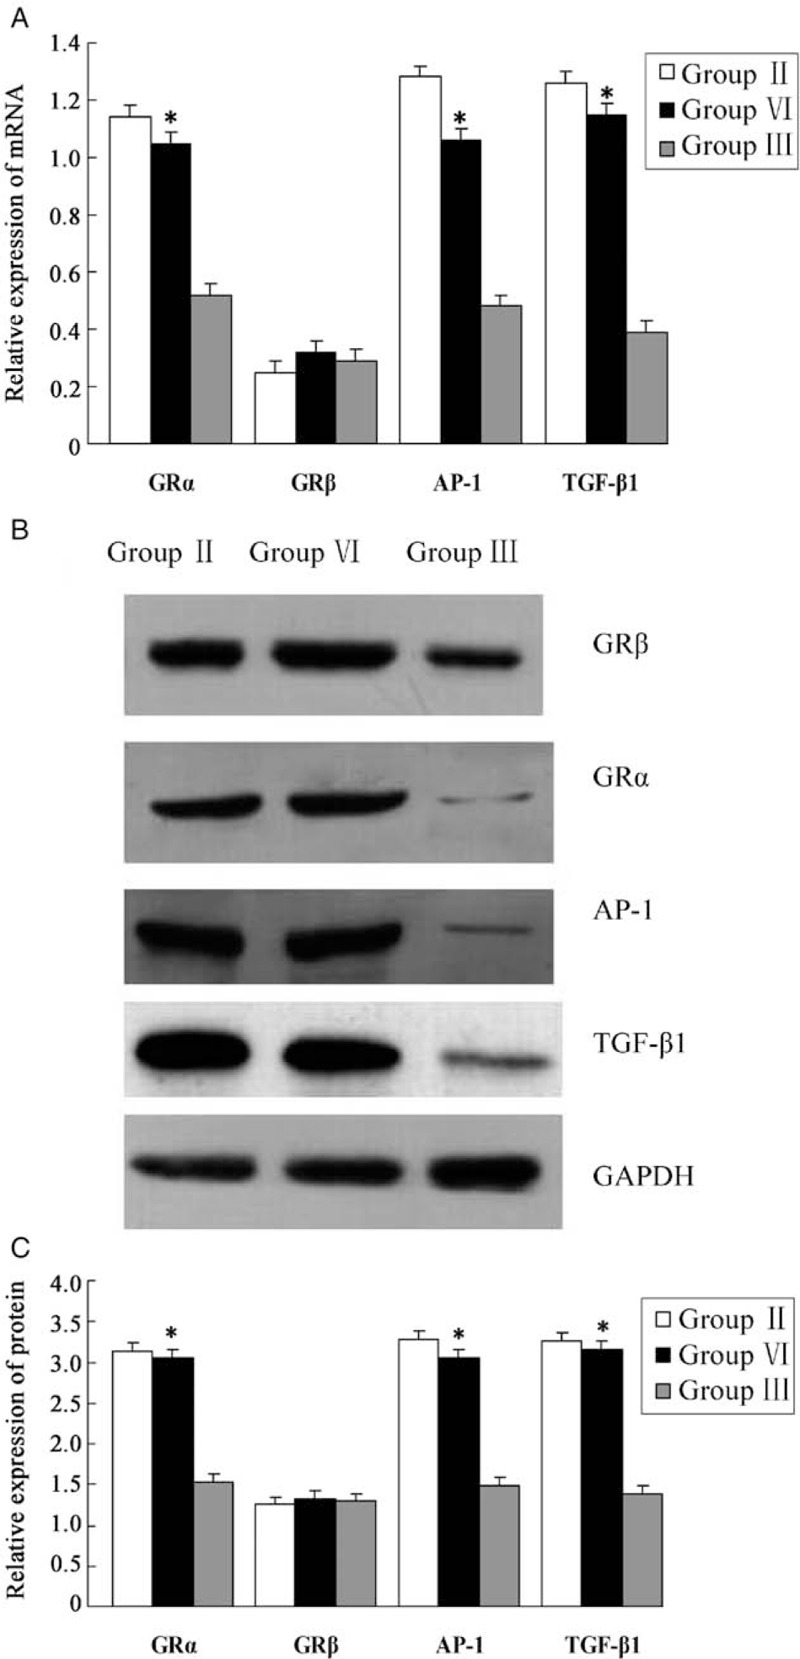
Expression of glucocorticoid receptor and resistance gene at mRNA and protein level in each group. (A) Expression of GRα and β, transforming growth factor-β1 and activator protein-1 mRNA in each group. (B, C) Expression of GRα and β, transforming growth factor-β1 and activator protein-1 protein in each group. Glucocorticoid receptor (GR) α expression was significantly higher in Group VI in comparison with Group III (∗P < 0.05); the expression of GRβ did not differ significantly. Meanwhile, p300 knockdown caused a significant increase in the expression of transforming growth factor-β1 and activator protein-1 at the levels of mRNA and protein, which suggests that p300 is involved in the occurrence of glucocorticoid resistance (∗P < 0.05). Group II: Non-knockout model group; Group III: Non-knockout dexamethasone therapy group; Group VI: p300 knockout dexamethasone therapy group.
p300 binding to TGF-β1 and AP-1 reduced the incidence of glucocorticoid resistance
Recently, the incidence of glucocorticoid resistance is seen to be increasing in the clinic. To determine whether p300 is involved in the occurrence of drug resistance, we selected the most important genes (TGF-β1 and AP-1) to obverse the relationship between p300 and resistance genes. We unexpectedly found that p300 knockdown causes a significant increase in TGF-β1 and AP-1, at the levels of mRNA and protein (TGF-β1: t = 1.945, P = 0.034; t = 1.902, P = 0.039; AP-1: t = 1.914, P = 0.038; t = 1.802, P = 0.041), suggesting, thereby that p300 is involved in the occurrence of glucocorticoid resistance [Figure 5A–5C]. If we could reduce the level of p300 in HSPN, the incidence of glucocorticoid resistance would be significantly reduced. Collectively, these data suggest that p300 plays a crucial role in the pathogenesis of HSPN and dexamethasone treatment of HSPN.
Discussion
Henoch-Schonlein purpura nephritis refers to the renal damage caused by the deposition of IgA immune complexes in renal tissues. HSPN is increasing in frequency as a secondary kidney disease in childhood. The pathologic manifestation of HSPN is microvascular damage mediated by immune complex deposition.[13] The clinical features include signs and symptoms due to renal and extrarenal involvement.[14] In general, the main extrarenal clinical features are skin purpura, joint swelling and pain, gastrointestinal symptoms, muscle involvement, and so on. Hematuria and proteinuria are the main features of renal involvement. Most symptoms of HSPN are mild, and the prognosis is better if reasonable treatment is given. However, some children still suffer from acute nephritic syndrome, nephrotic syndrome, and even rapidly progressive glomerulonephritis. A few children eventually develop chronic nephropathy or end-stage nephropathy, which is a great burden to the family and society.[15] Therefore, studying the pathogenesis and rational treatment of HSPN is of great significance.
This study reveals the important role p300 plays in the pathogenesis of HSPN. The pathologic changes of mice kidney were significantly alleviated after p300 knockout, and the levels of hematuria, proteinuria, serum IgA, and CIC were distinctly decreased, suggesting, thereby that p300 is involved in the pathogenesis of HSPN and is an important regulator. p300 itself has HAT activity and plays an important role in biologic functions such as cell cycle regulation, cell differentiation, apoptosis, and so on.[16] It is a known fact that HAT takes advantage of the potential in gene regulation by catalyzing reversible histone acetylation to slow down the inhibitory effect of chromatin on promoter activity, thus, assisting target gene transcription.[17] Meanwhile, p300 can also cut down the promoter inhibition mediated by chromatin structure and restore the basic transcriptor effect. The expression of p300 is limited in the nucleus, and the competition for p300 among its transcription factors leads to up-regulation or inhibitory action of several related genes. Therefore, it is crucial to explore the role of p300 in the pathogenesis of HSPN.
In our study, we also found that GRα expression increased significantly after p300 knockout, while GRβ expression did not differ notably. GR is a single-stranded phosphoprotein; diverse splicing forms of GR gene encode two different proteins: GRα and GRβ. Their structures are highly homologous, the only difference being in exon 9.[18] The proteins encoded by GRα and GRβ contain 777 and 742 amino acids, respectively. The compositions of 727 amino acids at the N-terminal for GRα and GRβ are identical, with mere distinction being at the COOH-terminal. Their molecular weights are 94,000 and 90,000 Da, respectively. The structure of GR protein consists of three independent functional regions: immunogenic domain at the N-terminal coded by exon 2, DNA-binding domain (DBD) coded by exons 3 and 4, and hormone-binding domain at the COOH-terminal coded by exons 6, 7, 8, and 9[19] apart. Apart from ligand binding, hormone-binding domain has other functions, including participation in the formation of GR dimer, combined with heat shock protein (HSP) (including HSP90, HSP70, and HSP56) and other transcription factors (such as, activated proteins AP-1, nuclear factor kappa-B, cAMP response element binding protein, etc). DBD is responsible for binding to glucocorticoid response element (GRE) on the promoter of the target gene, thus exerting a trans-activation effect on GR. Glucocorticoid can bind to GRα inducing further phosphorylation and leading to conformational changes of the receptor, resulting in dissociation from the HSP, which leads to exposing of the DNA-binding regions of GR and inducing dimerization of receptors, as well as transferring the activated GR dimer and hormone into the nucleus to regulate gene expression. GRβ can neither bind to glucocorticoid nor activate the transcription of GRE. Therefore, the biologic effects of glucocorticoid are mediated mainly by GRα, which interacts with p300 to regulate the upstream and downstream pathways. It is well-known that GR is a member of the nuclear receptor superfamily. The nuclear receptor is a ligand-dependent transcription regulator with high homology members. Activated GRα cannot effectively promote transcription by binding the homologous dimer with GRE of the target gene, which needs interaction with p300 and the basic transcription complex to specifically promote the expression of the target gene to exert a hormonal effect.[20] p300 is a key regulator of glucocorticoid transcriptional activation, which promotes target gene expression by combining specific domains of glucocorticoid with multiple transcription factors to form high molecular weight “enhancers.” p300 regulates transcription by acetylating histones and other proteins. Laboratory evidence for this important role of p300 in transcriptional activation mediated by the nuclear receptor include the following: p300 exists in all cell lines tested; p300 can interact with various nuclear receptors; p300 connects and enhances the transcription of various nuclear receptors through its common leucine-rich sequence LXXLL (L is leucine, X is other amino acid), which can interact with a variety of sequence-specific transcription activated factors to form a high molecular weight “enhancer” to promote target gene expression.[21] As p300 has HAT activity, when it binds to the ligand of GR in a hormone-dependent manner, HAT can activate four histones of the acetylated nucleosome to result in chromosome remodeling. Chromosomes change from a tight inhibitory state to an evacuated activated state, which promotes transcription. It is known from cell transfection experiments for the reporter gene that p300 can enhance transcription mediated by nuclear receptors (ER, GR, PR, etc) to a magnitude of ten times.[22] p300 antibody injected into the cell nucleus can completely block signal transduction to the nuclear receptor, which is mediated by AP-1.[23]
It has been shown that p300 binds to zinc finger DNA of androgen receptor with its highly conserved carboxyl end, and then acetylates it in order to promote androgenic effect.[24] This special region of p300 is rich in cysteine-histidine, which combines with the AF-1 terminal of estrogen receptor α to increase the activity three times.[25] Shukrun et al[26] found that the inhibitory effect of BRCA1 binding to estrogen receptor α was attributed to down-regulation of p300[27]; this is consistent with the results of our study. In recent years, scholars have explored the pathogenesis and therapeutic mechanism of refractory nephropathy at the level of signal transduction and nuclear transcription factors. It has been found that AP-1 and TGF-β1 signal transduction pathways play an important role in the progression of chronic kidney disease.[28] Activation of AP-1 in mesangial cells and tubular epithelial cells regulate the expression of many inflammatory mediators. TGF-β1 activated by AP-1 transcription pathway has crucial functions in glomerulosclerosis and tubulointerstitial fibrosis.[29] Therefore, p300 could effectively promote the downstream effects of glucocorticoid through the nuclear receptor. The amplification effect of p300 is mainly promoted by renal tubular epithelial cells. The down-regulation of p300 in renal tubular epithelial cells in refractory nephropathy might be one of the reasons leading to glucocorticoid resistance and progression of renal injury. Down-regulation of expression of p300 is related to glucocorticoid resistance, and low level of p300 increases incidence of glucocorticoid resistance.
Conflicts of interest
None.
Footnotes
How to cite this article: Jiang MY, Li W, Xu XP, Zhou JQ, Jiang H. Role of p300 in the pathogenesis of Henoch-Schonlein purpura nephritis and as a new target of glucocorticoid therapy in mice. Chin Med J 2019;00:00–00. doi: 10.1097/CM9.0000000000000380
References
- 1.Hahn D, Hodson EM, Willis NS, Craig JC. Interventions for preventing and treating kidney disease in Henoch-Schönlein purpura (HSP). Cochrane Database Syst Rev 2015; 7:CD005128.doi: 10.1002/14651858. [DOI] [PMC free article] [PubMed] [Google Scholar]
- 2.Lu S, Liu D, Xiao J, Yuan W, Wang X, Zhang X, et al. Comparison between adults and children with Henoch-Schönlein purpura nephritis. Pediatr Nephrol 2015; 30:791–796. doi: 10.1007/s00467-014-3016-z. [DOI] [PubMed] [Google Scholar]
- 3.Koskela M, Jahnukainen T, Endén K, Arikoski P, Kataja J, Nuutinen M, et al. Methylprednisolone or cyclosporine a in the treatment of Henoch-Schönlein nephritis: a nationwide study. Pediatr Nephrol 2019; 34:1447–1456. doi: 10.1007/s00467-019-04238-2. [DOI] [PubMed] [Google Scholar]
- 4.Claessens F, Joniau S, Helsen C. Comparing the rules of engagement of androgen and glucocorticoid receptors. Cell Mol Life Sci 2017; 74:2217–2228. doi: 10.1007/s00018-017-2467-3. [DOI] [PMC free article] [PubMed] [Google Scholar]
- 5.Liu YS, Hsu JW, Lin HY, Lai SW, Huang BR, Tsai CF, et al. Bradykinin B1 receptor contributes to interleukin-8 production and glioblastoma migration through interaction of STAT3 and SP-1. Neuropharmacology 2019; 144:143–154. doi: 10.1016/j.neuropharm.2018.10.033. [DOI] [PubMed] [Google Scholar]
- 6.Tan S, Wang RH, Niu HX, Shi CH, Mao CY, Zhang R, et al. Nerve growth factor for the treatment of spinocerebellar ataxia type 3: an open-label study. Chin Med J 2015; 128:291–294. doi: 10.4103/0366-6999.150087. [DOI] [PMC free article] [PubMed] [Google Scholar]
- 7.van der Kemp PA, Charbonnier JB, Audebert M, Boiteux S. Catalytic and DNA binding properties of the human OggI DNA N-glycosylase/APIyase: biochemical exploration of H270, Q315 and F319. Nucleic Acids Res 2004; 32:570–578. doi: 10.1093/nar/gkh224. [DOI] [PMC free article] [PubMed] [Google Scholar]
- 8.Liu X, Wang L, Zhao K, Thompson PR, Hwang Y, Marmorstein R, et al. The structural basis of protein acetylation by the p300/CBP transcriptional coactivator. Nature 2008; 451:846–850. doi: 10.1038/nature06546. [DOI] [PubMed] [Google Scholar]
- 9.Cheng G, Liu F, Asai T, Lai F, Man N, Xu H, et al. Loss of p300 accelerates MDS-associated leukemogenesis. Leukemia 2017; 31:1382–1390. doi: 10.1038/leu.2016.347. [DOI] [PMC free article] [PubMed] [Google Scholar]
- 10.Yang C, Xue J, An N, Huang XJ, Wu ZH, Ye L, et al. Accelerated glomerular cell senescence in experimental lupus nephritis. Med Sci Monit 2018; 24:6882–6891. doi: 10.12659/MSM.909353. [DOI] [PMC free article] [PubMed] [Google Scholar]
- 11.Chen Y, Du Y, Li Y, Wang X, Gao P, Yang G, et al. Panaxadiol saponin and dexamethasone improve renal function in lipopolysaccharide-induced mouse model of acute kidney injury. PLoS One 2015; 10:e0134653.doi: 10.1371/journal.pone.0134653. [DOI] [PMC free article] [PubMed] [Google Scholar]
- 12.Hisano S, Joh K, Katafuchi R, Shimizu A, Hashiguchi N, Kawamura T, et al. Reproducibility for pathological prognostic parameters of the Oxford classification of IgA nephropathy: the authors reply. Clin Exp Nephrol 2017; 21:1137–1138. doi: 10.1007/s10157-017-1422-9. [DOI] [PubMed] [Google Scholar]
- 13.Tan J, Tang Y, Zhong Z, Yan S, Tan L, Tarun P, et al. The efficacy and safety of immunosuppressive agents plus steroids compared with steroids alone in the treatment of Henoch-Schönlein purpura nephritis: a meta-analysis. Int Urol Nephrol 2019; 51:975–985. doi: 10.1007/s11255-019-02092-7. [DOI] [PubMed] [Google Scholar]
- 14.Nicoara O, Twombley K. Immunoglobulin A nephropathy and immunoglobulin A vasculitis. Pediatr Clin North Am 2019; 66:101–110. doi: 10.1016/j.pcl.2018.08.008. [DOI] [PubMed] [Google Scholar]
- 15.Wenderfer SE, Gaut JP. Glomerular diseases in children. Adv Chronic Kidney Dis 2017; 24:364–371. doi: 10.1053/j.ackd.2017.09.005. [DOI] [PubMed] [Google Scholar]
- 16.Demarest SJ, Martinez-Yamout M, Chung J, Chen H, Xu W, Dyson HJ, et al. Mutual synergistic folding in recruitment of CBP/p300 by p160 nuclear receptor coactivators. Nature 2002; 415:549–553. doi: 10.1038/415549a. [DOI] [PubMed] [Google Scholar]
- 17.Vachtenheim J, Sestáková B, Tuhácková Z. Inhibition of MITF transcriptional activity independent of targeting p300/CBP coactivators. Pigment Cell Res 2007; 20:41–51. doi: 10.1111/j.1600-0749.2006.00354.x. [DOI] [PubMed] [Google Scholar]
- 18.Barnes PJ. Glucocorticosteroids. Handb Exp Pharmacol 2017; 237:93–115. doi: 10.1007/164_2016_62. [DOI] [PubMed] [Google Scholar]
- 19.Ji H, Guo WZ, Yan ZH, Li D, Lu CL. Influence of drug treatment on glucocorticoid receptor levels in patients with coronary heart disease. Chin Med J 2010; 123:1685–1689. doi: 10.3760/cma.j.issn.0366-6999.2010.13.013. [PubMed] [Google Scholar]
- 20.Oswald F, Kovall RA. CSL-associated corepressor and coactivator complexes. Adv Exp Med Biol 2018; 1066:279–295. doi: 10.1007/978-3-319-89512-3_14. [DOI] [PubMed] [Google Scholar]
- 21.Inagaki Y, Shiraki K, Sugimoto K, Yada T, Tameda M, Ogura S, et al. Epigenetic regulation of proliferation and invasion in hepatocellular carcinoma cells by CBP/p300 histone acetyltransferase activity. Int J Oncol 2016; 48:533–540. doi: 10.3892/ijo.2015.3288. [DOI] [PubMed] [Google Scholar]
- 22.Smith CL, Oñate SA, Tsai MJ, O’Malley BW. CREB binding protein acts synergistically with steroid receptor coactivator to enhance steroid receptor dependent transcription. Proc Natl Acad Sci U S A 1996; 93:8884–8888. doi: 10.1073/pnas.93.17.8884. [DOI] [PMC free article] [PubMed] [Google Scholar]
- 23.Yin X, Warner DR, Roberts EA, Pisano MM, Greene RM. Identification of novel CBP interacting proteins in embryonic orofacial tissue. Biochem Biophys Res Commun 2005; 329:1010–1017. doi: 10.1016/j.bbrc.2005.02.075. [DOI] [PubMed] [Google Scholar]
- 24.Fu M, Wang C, Reutens AT, Wang J, Angeletti RH, Siconolfi-Baez L, et al. P300/cAMP-response element-binding protein-associated factor acetylate the androgen receptor at sites governing hormone-dependent transactivation. J Biol Chem 2000; 275:20853–20860. doi: 10.1074/jbc.M000660200. [DOI] [PubMed] [Google Scholar]
- 25.Kobayashi Y, Kitamoto T, Masuhiro Y, Watanabe M, Kase T, Metzger D, et al. P300 mediates functional synergism between AF-1 and AF-2 of estrogen receptor alpha and beta by interacting directly with the N-terminal A/B domains. J Biol Chem 2000; 275:15645–15651. doi: 10.1074/jbc.M000042200. [DOI] [PubMed] [Google Scholar]
- 26.Shukrun M, Jabareen A, Abou-Kandil A, Chamias R, Aboud M, Huleihel M. HTLV-1 tax oncoprotein inhibits the estrogen-induced-ER α-mediated BRCA1 expression by interaction with CBP/p300 cofactors. PLoS One 2014; 9:e89390.doi: 10.1371/journal.pone.0089390. [DOI] [PMC free article] [PubMed] [Google Scholar]
- 27.Wang C, Fu M, Angeletti RH, Siconolfi-Baez L, Reutens AT, Albanese C, et al. Direct acetylation of the estrogen receptor α hinge region by p300 regulates. J Biol Chem 2001; 276:18375–18383. doi: 10.1074/jbc.M100800200. [DOI] [PubMed] [Google Scholar]
- 28.Zhang M, Hwang E, Lin P, Gao W, Ngo HTT, Yi TH. Prunella vulgaris L. Exerts a protective effect against extrinsic aging through NF-κB, MAPKs, AP-1, and TGF-β/Smad signaling pathways in UVB-aged normal human dermal fibroblasts. Rejuvenation Res 2018; 21:313–322. doi: 10.1089/rej.2017.1971. [DOI] [PMC free article] [PubMed] [Google Scholar]
- 29.Lv ZM, Wang Q, Wan Q, Lin JG, Hu MS, Liu YX, et al. The role of the p38 MAPK signaling pathway in high glucose-induced epithelial-mesenchymal transition of cultured human renal tubular epithelial cells. PLoS One 2011; 6:e22806.doi: 10.1371/journal.pone.0022806. [DOI] [PMC free article] [PubMed] [Google Scholar]