Abstract
Maternal obesity (MO) predisposes offspring to metabolic disorders, but the mechanisms remain poorly defined. Recent studies emphasize the importance of brown adipose tissue (BAT) in maintaining metabolic health, and MO was recently demonstrated to impair BAT thermogenic function in offspring. The current study aimed to investigate the mechanisms leading to the impairment in fetal BAT development due to MO. Female C57BL/6J mice were fed a control diet or a 60% high-fat diet for 10 weeks, mated and maintained on their respective diets during pregnancy. Fetal tissue was collected at E18.5, the late stage of pregnancy. Fetal BAT contained more triglycerides compared to the control, which was correlated with higher expression of white adipogenic markers. On the other hand, the expression of BAT markers were down-regulated in the MO fetal BAT. Based on RNA-sequencing analyses, genes related to mitochodriogenesis and myogenesis were found to be down-regulated, while those related to white adipocyte differentiation were up-regulated in MO fetal BAT. Because brown adipocytes are derived from myogenic progenitors, the down-regulation of myogenic genes might partially explain hampered brown adipogenesis in MO fetal BAT. Consistently, mitochondrial DNA and mitochondrial biogenesis markers were also down-regulated in MO fetal BAT. MicroRNA-sequencing identified that miR-204-5p expression was elevated in MO fetal BAT. This microRNA targeted the 3’-untranslated regions of PGC1α and Sirt1 mRNA to suppress their expression and impair mitochondriogenesis. In summary, MO impaired fetal BAT development through suppressing myogenesis and brown adipogenesis while enhancing white adipogenic commitment, and inhibited mitochondriogenesis partially through enhancing miR-204-5p expression.
Keywords: maternal obesity, fetus, brown adipose tissue, mitochondriogenesis, miR-204-5p
1. Introduction
Obesity has become a worldwide problem and is accompanied by serious secondary complications. Maternal obesity (MO) leads to poor fetal embryo development [1, 2], predisposes offspring to obesity and metabolic/neurodevelopmental/ cardiovascular diseases later in life [3–7]. Indeed, obesity and type 2 diabetes are increasing in children and adolescents [8]. The responsible mechanisms linking MO to offspring obesity and metabolic diseases remain to be fully defined.
Adipose tissues have been classified as white adipose tissue (WAT) and brown adipose tissue (BAT). WAT is mainly responsible for energy storage in the form of triglyceride droplets [9]. Excessive WAT expansion results in chronic inflammation, insulin resistance and type 2 diabetes [9, 10]. On the other hand, BAT dissipates energy in the form of heat because of the presence of abundant mitochondria and uncoupling protein 1 (UCP1) [11]. Enhancing the thermogenic function of BAT protects against metabolic diseases, such as obesity and type 2 diabetes [12, 13].
The BAT primarily develops during the fetal stage. Brown adipocytes originate primarily from cells in the dermomyotome expressing engrailed 1 (En1), myogenic factor 5 (Myf5) and paired-box protein 7 (Pax7), which can also give rise to muscle cells [14, 15]. Thus, BAT and skeletal muscle are closely related during early development and share a common pool of precursors, with the divergence occurring between embryonic day (E) 9.5 and E12.5 in mice [9, 14].. Thus, attenuating myogenesis during fetal development may impair brown adipocyte formation. In addition, during BAT development, a portion of brown adipocytes are developed from PDGFRα+ cells with dual potential of white and brown adipogenic differentiation [16]. We previously observed that MO increased the white adipogenesis of progenitors in MO fetus [17], and MO during lactation also impairs the thermogenic function of BAT in offspring [18]. Therefore, the fetal stage is important for BAT development and MO is postulated to impair BAT development by shifting progenitor differentiation into other lineages, which have long-term negative effects on offspring BAT [16].
Extensive mitochondriogenesis is indispensable during brown adipocyte formation. The peroxisome proliferator-activated receptor gamma coactivator 1-α (PGC-1α) is a master regulator of mitochondrial genesis. MicroRNAs (miRNAs) are short non-coding RNAs (19–22 nucleotides) which have been implicated in the regulation of brown adipogenesis and insulin sensitivity [19, 20]. We hypothesized that microRNAs target PGC-1α to suppress mitochondriogenesis during BAT development. Using fetal BAT at E18.5, the objectives of this study is to determine the effects of MO on the lineage commitments during fetal BAT development, and further define the roles of microRNA in regulating PGC-1α expression and mitochondriogenesis.
2. Methods
2.1. Ethical approval
All animal experiments in the present study (Approval No. CAU20180316-3) were approved by the Animal Care and Use Committee of China Agricultural University (Beijing, China).
2.2. Animals
C57BL/6J mice were purchased from Beijing Vital River Laboratory Animal Technology Co., Ltd. (Beijing, China). All mice were housed under 12 h light/dark cycle and at a constant temperature. To obtain obese mice, female C57BL/6J mice (4-week-old) were fed a control diet (10% energy from fat) or a high-fat diet (HFD, 60% energy from fat) (BIOPIKE, Beijing, China) for 10 weeks. Control and obese female mice were then mated with C57BL/6J male mice (on the normal chow diet) and maintained on their respective diets during pregnancy. The mating was confirmed by the presence of the vaginal plug. At E18.5, mice were killed and the BAT of male fetuses were collected for further analysis. Maternal mice with fetal numbers between six and nine were included in this study. Five pregnant mice per group were used and the average number of fetuses per pregnancy was balanced between treatments. For each pregnancy, BAT from male and female fetuses was pooled separately for analyses. Fetal sex was identified by PCR [21].
2.3. Quantitative real-time PCR
Total RNA was extracted from mouse tissues using RNAprep pure Cell Kit (Tiangen biotech, Beijing, China) and cDNA was synthesized from 1–2 μg of total RNA using M-MLV Reverse Transcriptase (Promega, Fitchburg, WI, USA). The cDNAs were used for quantitative real-time PCR analysis with SYBR™ Select Master Mix (Applied Biosystems™, Waltham, MA, USA). Primer sequences are shown in Table 1.
Table 1.
The primer sequences
| Gene | Forward primer sequence (5’ to 3’) | Reverse primer sequence (5’ to 3’) |
|---|---|---|
| PGC1α | ATGTGTCGCCTTCTTGCTCTTCC | GGACCTTGATCTTGACCTGGAATATGG |
| Prdm16 | CAGCAACCTCCAGCGTCACATC | GCGAAGGTCTTGCCACAGTCAG |
| Ucp1 | ACTCAGGATTGGCCTCTACGACTC | GCATTCTGACCTTCACGACCTCTG |
| Pparα | CTTCACGATGCTGTCCTCCTTGATG | GATGTCACAGAACGGCTTCCTCAG |
| Psat1 | CTTCCCCTGCTGTCGCCTTA | AGCACACTGATGCCGAGTCC |
| Zfp423 | GAGAGTGCTGAGGACCTGGAGAG | GGTTGGCGACGTGGATCTGAATC |
| Resistin | TCCTGTGGCTCTGCCTGTGG | GCTGCTGTCCAGTCTATCCTTGC |
| Tfb2m | ACCAAAACCCATCCCGTC | TCTGTAAGGGCTCCAAATGTG |
| Col1a1 [23] | GCATGGCCAAGAAGACATCC | ACTGGTAAGTGGGGCAAGAC |
| Nrf2 [24] | TGAAGTTCGCATTTTGATGGC | CTTTGGTCCTGGCATCTCTAC |
| ATP5a1 [24] | CATTGGTGATGGTATTGCGC | TCCCAAACACGACAACTCC |
| Ndufs8 [24] | GTTCATAGGGTCAGAGGTCAAG | TCCATTAAGATGTCCTGTGCG |
| β-actin [25] | GATCTGGCACCACACCTTCT | GGGGTGTTGAAGGTCTCAAA |
| COX2 [24] | ATAACCGAGTCGTTCTGCCAAT | TTTCAGAGCATTGGCCATAGAA |
| β-globin [26] | GAAGCGATTCTAGGGAGCAG | GGAGCAGCGATTCTGAGTAGA |
2.4. Mitochondrial DNA (mtDNA) copy number
Mt DNA copy number was analyzed as previously described [22]. Briefly, genomic DNA was isolated with a TIANamp Genomic DNA Kit (Tiangen biotech, Beijing, China) and then used for quantitative real-time PCR analysis with SYBR™ Select Master Mix (Applied Biosystems™, Waltham, MA, USA). The mtDNA was amplified using primers for the mitochondrial COX2 gene and normalized to genomic DNA based on the amplification of β-globin nuclear gene. Primer sequences are shown in Table 1.
2.5. Western blotting
Western blotting was conducted as previously described [22]. Antibodies against β-actin (#4967) and SIRT1 (#9475) were purchased from Cell Signaling Technology (Danvers, MA, USA). Antibodies against PGC1α (ab54481), PRDM16 (ab106410) and UCP1 (ab10983) were purchased from Abcam (Cambridge, UK). Goat anti-rabbit IgG HRP (A0208) secondary antibodies were bought from Beyotime Institute of Biotechnology (Haimen, Jiangsu, China).
2.6. Construction and sequencing of RNA-seq libraries, and alignment of RNA-seq data and differential expression analysis
E18.5 fetuses from control and HFD maternal mice were chosen to perform the RNA-seq. A polyA selection protocol was used according to the Illumina TruSeq RNA-Seq library protocol to construct RNA-Seq libraries. RNA-seq library was constructed for each RNA sample, making 4 or 5 biological replicates for each treatment. Each library was sequenced using Illumina Hiseq 2500 platform (150 bp pair-end reads).
The low quality reads and adaptor sequences were trimmed with Trimmomatic [27]. Clean reads were aligned to mouse genome mm10 (from Ensembl) by Hisat2 [28]. Gene counts were calculated by counting the overlap of reads on each gene with HT-seq [29] and the expression levels were normalized as RPKM with gene annotation file from Ensembly (release 94) and edgeR package in R [30]. Differential expression genes were identified by DESeq2 package, and functional enrichment for Gene Ontology (GO) was performing with GOstats package [31].
2.7. Small RNA library construction and sequencing and bioinformatics analyses
The protocol of small RNA library construction used in this study was based on the Illumina TruSeq Small RNA Sample Preparation kit. Small RNA-seq library was constructed for each RNA sample, which made 3 biological replicates for each treatment. Each library was sequenced using Illumina Miseq platform (75 bp single-end reads).
The low quality reads and adaptor sequences were trimmed with Trimmomatic [27]. Clean reads were aligned to mouse genome mm10 (from Ensembl) by STAR [32]. The distribution of small RNA reads was annotated by Unitas [33]. MiRNA counts were calculated by counting the overlap of reads on each gene with HT-seq [29] and the expression levels were normalized as Trimmed Mean of M-values (TMM) with miRNA file from miRbase (v21). Differential expression miRNAs were identified by DESeq2 package. The target genes of the differentially expressed miRNAs were extracted using the miRWalk [34]. Functional enrichment of target genes for GO were performing with GOstats package [31].
2.8. Hematoxylin eosin staining and electron microscopic examination of BAT structure
Hematoxylin eosin staining (H&E staining) was performed as previously described [35]. In brief, tissues were fixed with 4% PFA for over 24 h and then embedded in paraffin and sectioned into serial cross-sections of 5-μm thickness. Then, sections were subjected to deparaffinization and H&E staining. The slides were sealed with nail polish for microscopic observation.
For transmission electron microscopic observation of mitochondrial structure, BAT was processed as previously described [16].
2.9. Fasting blood glucose and fasting serum insulin
Following an overnight fast, the blood samples were collected from the mouse tail to measure blood glucose with a glucose meter (Roche Diagnostics, Mannheim, Germany). The serum insulin concentration was analyzed using a mouse insulin enzyme-linked immunosorbent assay (ELISA) kit (Mercodia, Uppsala, Sweden) according to the manufacturer’s instruction.
2.10. Triglyceride content analysis
Triglyceride content analysis was performed using the EnzyChromTM Triglyceride Assay Kit (BioAssay Systems, Hayward, USA) according to the manufacturer’s instruction. Briefly, standards and samples were mixed with working reagent, including assay buffer, enzyme mix, lipase, ATP and dye reagent, and then incubated for 30 min at room temperature. The optical density (OD) was then read at 570 nm.
2.11. Luciferase assay
The pmirGLO vector (Promega) was used to clone 3’ untranslated regions (UTR) of PGC1α or Sirt1. HEK293 cells were seeded at 1×10⁵ cells per well in 48-well plates the day prior to transfection. Cells were transfected with pmirGLO luciferase expression constructs containing the 3’ UTR of PGC1α or Sirt1, and pRL-TK Renilla luciferase vector (Promega). In addition, cells were also transfected with miRNA precursor or negative control (Ambion). At 48 h after transfection, luciferase activities were measured using the Dual-Luciferase Reporter Assay System (Promega) and normalized to Renilla luciferase activity. All analyses were performed in duplicate, and three independent experiments were conducted and used for analyses.
2.12. Statistical Analyses
Data were generated from at least three independent experiments. All data were reported as means ± standard deviations (SD). Differences between groups were calculated using the Student’s t test. P < 0.05 was considered to be statistically significant.
3. Results
3.1. Maternal weights, fasting glucose and insulin
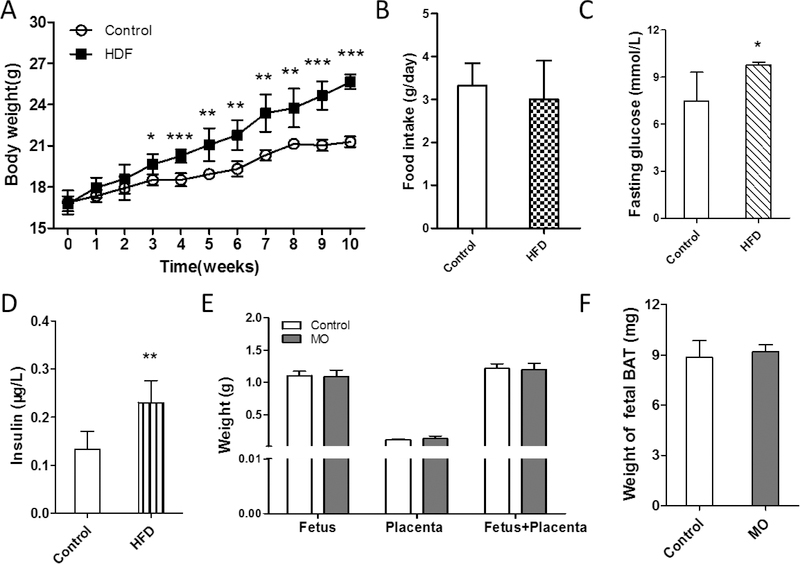
After 10 weeks feeding on HFD, obese mice were heavier than control mice (Fig.1A), which maintained to necropsy at E18.5. No difference in food intake was observed between treatments (Fig.1B). At E18.5, MO mice had higher concentrations of glucose and insulin compared to the control mice (Fig.1C and 1D). We also measured the weights of fetuses, placenta and fetal BAT, which did not differ (Fig.1E and 1F).
Figure 1. Maternal and fetal characteristics.
(A) Body weights of maternal mice fed with the normal chow diet (Control) and HFD. (B) Food intake between control and HFD maternal mice. Fasting glucose (C) and insulin (D) of control and HFD maternal mice. (E) Weight of fetus and placenta. (F) Weight of fetal BAT. n=5 per group; *p≤0.05 versus control, **p≤0.01 versus control, ***p≤0.001 versus control.
3.2. MO enhanced the expression of white adipogenic marker and lipid accumulation in fetal BAT
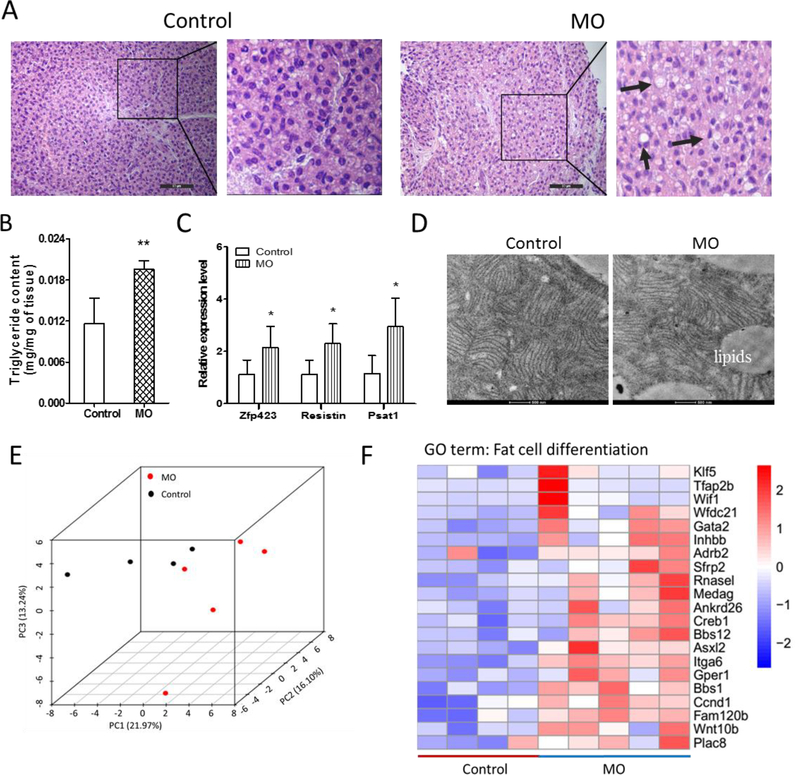
When stained with H&E, MO fetal BAT had more abundant lipid droplets (Fig. 2A and Fig. S1A). To further confirm, we analyzed the triglyceride content in the BAT and found that MO fetal BAT contained higher triglyceride contents (Fig. 2B). Similarly, white adipogenic markers, such as Zfp423, Psat1 and Resistin, were significantly higher in MO group compared to the control (Fig. 2C and Fig. S1B). Through transmission electron microscopic examination, we found more and larger lipid droplets in the MO BAT but with less mitochondria and their internal cisternae structure compared to the control group (Fig. 2D). We also analyzed the effects of MO on fetal BAT transcriptome (Fig. 2E). Genes associated with white adipocyte differentiation were increased in the MO fetal BAT (Fig. 2F). Taken together, these data showed that MO impaired fetal BAT development.
Figure 2. MO increased white adipogenesis and lipid contents of E18.5 fetal BAT.
(A) Representative images of H&E staining of E18.5 fetal BAT. MO fetal BAT showed more lipid droplets. Bar, 50 μm. (B) Triglyceride contents of E18.5 fetal BAT. (C) Quantitative real-time PCR analysis of the expression of white adipogenic marker genes. (D) Electronic microscopic images of mitochondria of BAT. Bar, 500 nm. (E) Principal component analysis (PCA) of RNA-seq data. (F) MO up-regulated genes related to white adipocyte differentiation. n=5 per group; *p≤0.05 versus control, **p≤0.01 versus control.
3.3. MO attenuated fetal brown adipogenesis and myogenesis
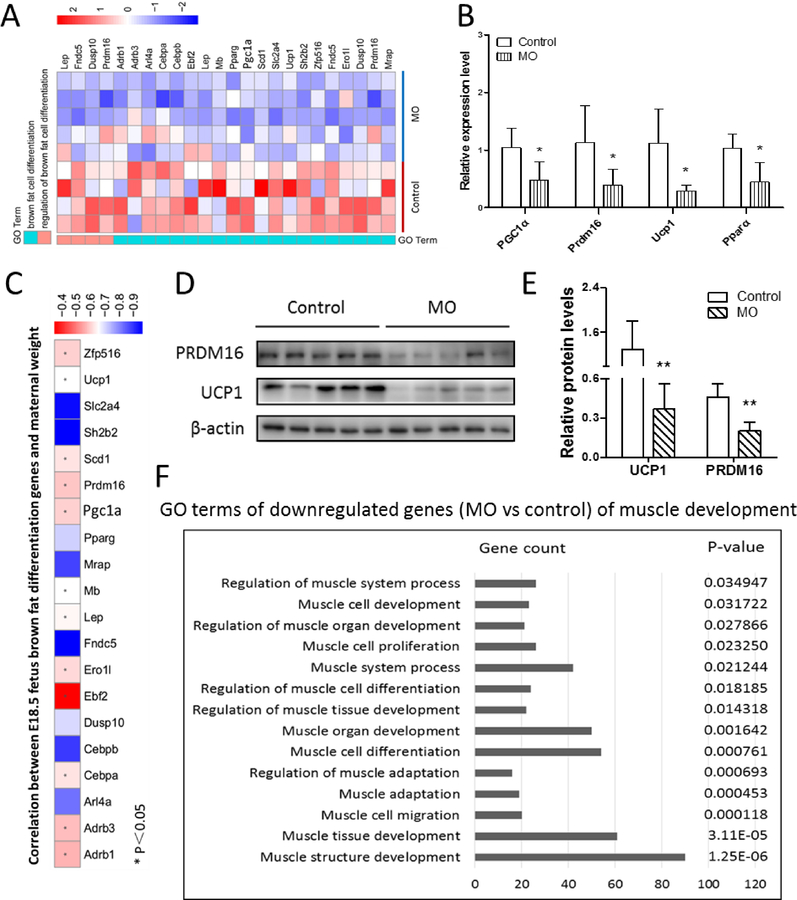
According to the fetal BAT transcriptome, markers of brown adipocyte differentiation (i.e. Prdm16, PGC1α, Pparα, Fndc5, Dusp10 and Lep) were down-regulated in the MO fetal BAT (Fig. 3A). Quantitative real-time PCR also confirmed these changes (Fig. 3B and Fig. S1B). Moreover, based on Pearson correlation analysis, the expression of brown adipocyte differentiation markers (i.e. Ucp1, Zfp516 and Prdm16) was negatively correlated with maternal weight (Fig. 3C, S1C and S1D). Similarly, at the protein level, both PRDM16 and UCP1 contents were down-regulated in the MO fetal BAT compared to the control group (Fig. 3D and 3E). In the MO fetal BAT, genes related to myogenic differentiation were decreased (Fig. 3F). Because brown adipocytes are derived from myogenic cells during fetal development, the down-regulation of myogenic markers is consistent with attenuated brown adipocyte development in MO fetal BAT.
Figure 3. MO negatively affected E18.5 fetal brown adipogenesis.
(A) Heatmap of the expression of selected genes associated with BAT development. (B) Quantitative real-time PCR analyzed the expression of genes selected by heatmap (n=5 per group). (C) Pearson correlation of brown adipocyte differentiation markers and maternal weight. (D and E) Western blotting analysis of PRDM16 and UCP1 contents (D) and relative quantitative analysis (E) of protein bands (n=5 per group). (F) GO terms of down-regulated genes of muscle development.*p≤0.05 versus control, **p≤0.01 versus control.
3.4. MO impaired mitochondriogenesis of fetal BAT
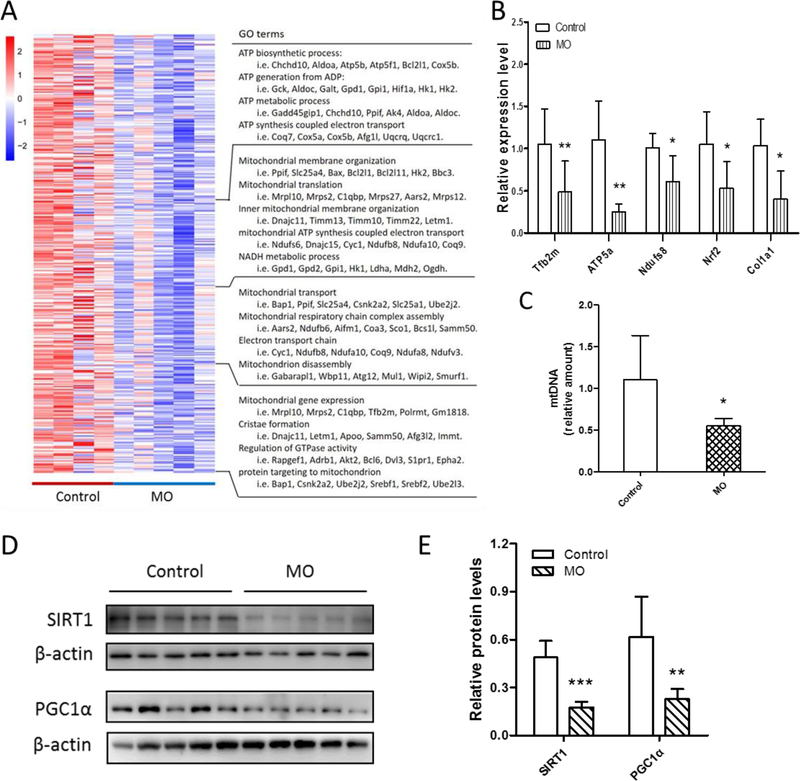
BAT development is associated with extensive mitochondriogenesis. The GO terms in the MO down-regulated group were closely related to mitochondriogenesis, indicating that MO had negative effects on mitochondrial biogenesis, such as ATP biosynthetic process, mitochondrial transport and cristae formation (Fig. 4A), in agreement with reduced mitochondrial density and cristae structure in MO fetal BAT (Fig. 2D). Consistently, quantitative real-time PCR analysis confirmed that mitochondrial transcription factor Tfb2m, nuclear respiratory factors Nrf2 and components of the mitochondrial electron transport chain (i.e. Ndufs8 and ATP5a1) were reduced in the MO fetal BAT compared with the control (Fig. 4B). MtDNA content was also down-regulated in the MO fetal BAT (Fig. 4C and S1E). At the protein level, marker proteins of mitochondriogenesis (PGC1α and SIRT1) were both reduced due to MO (Fig. 4D and 4E). These data showed that MO impaired the mitochondriogenesis of fetal BAT.
Figure 4. MO negatively affected E18.5 fetal mitochondriogenesis.
(A) Heatmap of the expression of selected genes associated with mitochondriogenesis. (B) Quantitative real-time PCR analyzed the expression of genes selected by heatmap (n=5 per group). (C) Mitochondrial DNA content in control and MO fetal BAT analyzed by quantitative real-time PCR. (D and E) Western blotting analysis of SIRT1 and PGC1α contents (D) and relative quantitative analysis (E) of protein bands (n=5 per group). *p≤0.05 versus control, **p≤0.01 versus control, ***p≤0.001 versus control.
3.5. MO changed miRNAs to stunt BAT development
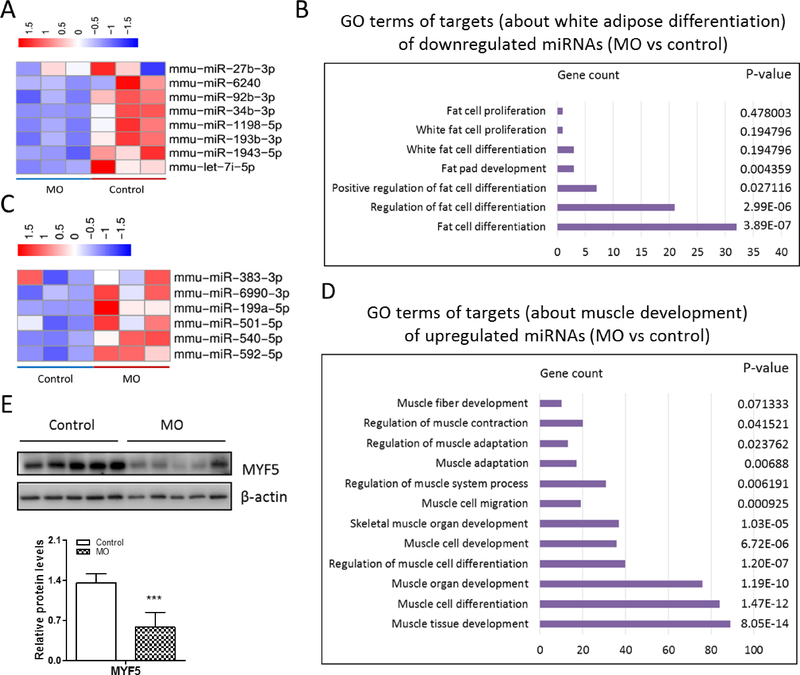
In addition to RNA-seq, we also performed miRNA-seq to explore the effects of MO on the fetal BAT development and profiled those down-regulated and up-regulated miRNAs using GO analysis. Data showed that miRNAs (i.e. miR-1943-5p, miR-1198-5p and miR-6240) suppressing white adipocyte differentiation were reduced due to MO (Fig. 5A and 5B), while miRNAs (i.e. miR-199a-5p, miR-501-5p and miR-383-3p) interfering myogenic differentiation, such as muscle cell development and differentiation, were enhanced in the MO fetal BAT (Fig. 5C and 5D). Among these miRNAs, several miRNAs including miR-540-5p and 501-5p, are also related to the brown fat cell differentiation [36]. Additionally, myoblast specific marker MYF5 were reduced due to MO (Fig. 5D, S1C and S1D), indicating that MO negatively affected fetal myogenesis. Taken together, these results were consistent with fetal BAT transcriptional profiles, showing that MO might attenuate fetal BAT development and mitochondriogenesis partially through regulating miRNAs.
Figure 5. miRNA-seq analysis of fetal BAT.
(A) Heatmap of the expression of selected miRNAs associated with white adipocyte differentiation. (B) GO terms of targets (about white adipocyte differentiation) of downregulated miRNAs (MO vs control). (C) Heatmap of the expression of selected miRNAs associated with myogenesis and brown adipogenesis. (D) GO terms of targets (about myogenesis) of up-regulated miRNAs (MO vs control). (E) Western blotting analysis of MYF5 contents and relative quantitative analysis of protein bands (n=5 per group). ***p≤0.001 versus control.
3.6. MO impaired mitochondriogenesis partially through up-regulation of miR-204-5p
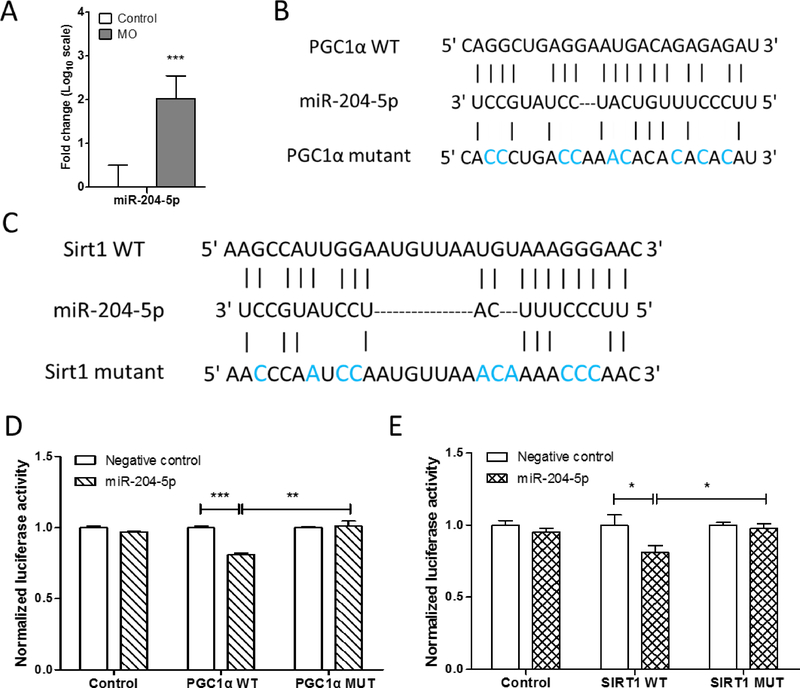
To understand the underlying mechanisms responsible for the impairment of MO fetal BAT development, we analyzed miRNAs and their targets. The miR-204-5p that predictably regulates PGC1α and Sirt1 expression was differentially expressed in fetal BAT. Quantitative real-time PCR analysis showed that miR-204-5p was significantly up-regulated in the MO fetuses compared to the control mice (Fig. 6A). To validate whether PGC1α and Sirt1 genes are direct targets of miR-204-5p, we constructed luciferase reporters for the PGC1α and Sirt1 3’UTRs, as well as reporter constructs in which the predicted miR-204-5p binding sites were mutated (Fig. 6B and 6C). The luciferase reporter assay showed that miR-204-5p mimics repressed luciferase activity of constructs containing PGC1α and Sirt1 3’UTR elements, while mutations in 3’UTRs abolished miR-204-5p binding and the repressive effects of miR-204-5p mimics (Fig.6D, 6E and S2). Together, these results identified PGC1α and Sirt1 as the direct molecular targets of miR204-5p. MO negatively affects mitochondriogenesis partially by increasing miR-204-5p, which inhibited the expression of PGC1α and Sirt1.
Figure 6. MO impaired mitochondriogenesis partially through miR-204-5p.
(A) Quantitative real-time PCR analyzed the expression of miR-204-5p in control and MO fetal BAT (n=5 per group). (B and C) Schematic representation of the miR-204-5p target sequence within the 3’UTR of PGC1α (B) and Sirt1 (C). Several nucleotides were mutated in the 3’UTR of PGC1α and Sirt1. (D and E) Luciferase reporter activity of wild-type and mutant 3’UTR constructs of PGC1α (D) and Sirt1 (E) in HEK293 cells transfected with miR-204-5p mimics or negative control. The mean of the results from cells transfected by pmirGLO control vector was set as 100%. Data are means and standard deviation (SD) of separate transfections (n=3). *p≤0.05 versus control, **p≤0.01 versus control, ***p≤0.001 versus control.
4. Discussion
Adipose tissue (WAT and BAT) is mainly developed during the fetal and neonatal stages, which is profoundly affected by maternal physiological conditions. MO enhances fetal white adipogenic differentiation and leads to adiposity in offspring [17, 37]. In addition, MO impairs offspring BAT function [16, 18]. In this study, we further explored the effects of MO on lineage commitments and mitochondrial biogenesis in fetal BAT at late pregnancy.
To define the impact of MO on fetal BAT development, we first performed the H&E staining to examine morphological changes. More lipid droplets were observed in MO fetuses compared to control fetuses. White adipogenic markers (i.e. Zfp423, Psat1 and Resistin) were also increased in MO fetal BAT. This is consistent with the previous studies showing that MO promoted white adipogenic differentiation in fetal mice [17] and decreased BAT function of offspring born to obese maternal mice [18, 38].
Furthermore, we found that UCP1 and PRDM16 which are regulators of brown adipogenesis [11] were down-regulated at both mRNA and protein levels, suggesting that brown adipogenic differentiation of fetal BAT was impeded due to MO. Brown adipocytes are packed with mitochondria and, thus, extensive mitochondriogeneis is indispensable during BAT development [39]. Consistently, we found that, due to MO, the transcription levels of marker genes, ATP5a, Nrf2 and Tfb2m, and the protein levels of PGC1α and SIRT1 were reduced. Their mtDNA also reduced in MO fetal BAT. Supportively, genes related to mitochondriogenesis were down-regulated in the MO group based on transcriptome analysis. Similarly, more and larger lipid droplets and less mitochondria were in the MO fetal BAT. In short, these data confirmed that mitochondrial biogenesis was impaired in MO compared with control fetal BAT.
MiRNAs (19–22 nucleotides) are long non-coding RNAs that suppress gene expression and translation, and have been implicated in the regulation of brown adipogenesis [40]. We found that MO altered miRNA profile of fetal BAT, which regulate myogenesis and white adipocyte differentiation. MiRNAs associated with white adipose development, including miR-1943-5p, miR-1198-5p and miR-6240, were down-regulated, leading to an increase in white adipocyte markers, while miRNAs related to myogenesis, such as miR-199a-5p, miR-501-5p and miR-383-3p, were up-regulated, resulting in the reduction of myogenic differentiation markers. These changes could attenuate BAT development because brown adipocytes are derived from myogenic cells during fetal development [14]. These data showed that MO negatively affected fetal brown adipogenesis and mitochondriogenesis partially through altering miRNA expression.
Of those differentially expressed miRNAs, we further analyzed miR-204-5p which was increased in the MO group. We predicted that miR-204-5p had binding sites in PGC1α and Sirt1 3’UTR and hypothesized that MO negatively affected fetal BAT mitochondriogenesis partially through miR-204-5p. Luciferase assay data showed that miR-204-5p directly bound PGC1α and Sirt1 3’UTR to suppress their expression, correlated with mitochondrial abnormalities in MO fetal BAT. These results indicated that MO impaired mitochondria partially through upregulation of miR-204-5p.
In summary, MO impaired fetal brown adipogenesis while promoting white adipogenesis in fetal BAT. In addition, mitochondriogenesis of fetal BAT was also inhibited due to MO. The attenuation of mitochondriogenesis was associated with up-regulation of miR-204-5p, which interfered with PGC1α and Sirt1 expression, partially explaining the suppression of fetal brown adipogenesis due to MO.
Supplementary Material
Highlights.
Maternal obesity increases triglyceride content and white adipose markers in fetal brown adipose tissue (BAT).
Markers of mitochondriogenesis in fetal BAT is suppressed due to maternal obesity.
Maternal obesity enhances miR-204-5p expression to suppress PGC1α and Sirt1 expression, attenuating mitochondriogenesis.
Acknowledgements
This work was supported by the National Natural Science Foundation of China (Grant No. 31871806), and the Beijing Dairy Industry Innovation Team (BAIC06-2019) to XM, and NIH R01HD067449 to MD.
Footnotes
Conflict of Interest
The authors declare no conflict of interest.
Publisher's Disclaimer: This is a PDF file of an unedited manuscript that has been accepted for publication. As a service to our customers we are providing this early version of the manuscript. The manuscript will undergo copyediting, typesetting, and review of the resulting proof before it is published in its final citable form. Please note that during the production process errors may be discovered which could affect the content, and all legal disclaimers that apply to the journal pertain.
References
- [1].Han L, Ren C, Li L, Li X, Ge J, Wang H, Miao YL, Guo X, Moley KH, Shu W, Wang Q, Embryonic defects induced by maternal obesity in mice derive from Stella insufficiency in oocytes, Nat. Genet, 50 (2018) 432–442. [DOI] [PubMed] [Google Scholar]
- [2].Igosheva N, Abramov AY, Poston L, Eckert JJ, Fleming TP, Duchen MR, McConnell J, Maternal diet-induced obesity alters mitochondrial activity and redox status in mouse oocytes and zygotes, PLoS One, 5 (2010) e10074. [DOI] [PMC free article] [PubMed] [Google Scholar]
- [3].Tenenbaum-Gavish K, Hod M, Impact of maternal obesity on fetal health, Fetal Diagn. Ther, 34 (2013) 1–7. [DOI] [PubMed] [Google Scholar]
- [4].Desai M, Beall M, Ross MG, Developmental origins of obesity: programmed adipogenesis, Curr. Diab. Rep, 13 (2013) 27–33. [DOI] [PMC free article] [PubMed] [Google Scholar]
- [5].Neri C, Edlow AG, Effects of Maternal Obesity on Fetal Programming: Molecular Approaches, Cold Spring Harb. Perspect. Med, 6 (2015) a026591. [DOI] [PMC free article] [PubMed] [Google Scholar]
- [6].Persson M, Razaz N, Edstedt Bonamy AK, Villamor E, Cnattingius S, Maternal Overweight and Obesity and Risk of Congenital Heart Defects, J. Am. Coll. Cardiol, 73 (2019) 44–53. [DOI] [PubMed] [Google Scholar]
- [7].Qiao L, Chu K, Wattez JS, Lee S, Gao H, Feng GS, Hay WW Jr., Shao J, High-fat feeding reprograms maternal energy metabolism and induces long-term postpartum obesity in mice, Int. J. Obes. (Lond.), (2019). [DOI] [PMC free article] [PubMed] [Google Scholar]
- [8].Pulgaron ER, Delamater AM, Obesity and type 2 diabetes in children: epidemiology and treatment, Curr. Diab. Rep, 14 (2014) 508. [DOI] [PMC free article] [PubMed] [Google Scholar]
- [9].Rosen ED, Spiegelman BM, What We Talk About When We Talk About Fat, Cell, 156 (2014) 20–44. [DOI] [PMC free article] [PubMed] [Google Scholar]
- [10].Van Gaal LF, Mertens IL, De Block CE, Mechanisms linking obesity with cardiovascular disease, Nature, 444 (2006) 875–880. [DOI] [PubMed] [Google Scholar]
- [11].Inagaki T, Sakai J, Kajimura S, Transcriptional and epigenetic control of brown and beige adipose cell fate and function, Nature Reviews Molecular Cell Biology, 17 (2016) 480–495. [DOI] [PMC free article] [PubMed] [Google Scholar]
- [12].Sacks H, Symonds ME, Anatomical locations of human brown adipose tissue: functional relevance and implications in obesity and type 2 diabetes, Diabetes, 62 (2013) 1783–1790. [DOI] [PMC free article] [PubMed] [Google Scholar]
- [13].Sidossis L, Kajimura S, Brown and beige fat in humans: thermogenic adipocytes that control energy and glucose homeostasis, The Journal of clinical investigation, 125 (2015) 478–486. [DOI] [PMC free article] [PubMed] [Google Scholar]
- [14].Seale P, Bjork B, Yang W, Kajimura S, Chin S, Kuang S, Scime A, Devarakonda S, Conroe HM, Erdjument-Bromage H, Tempst P, Rudnicki MA, Beier DR, Spiegelman BM, PRDM16 controls a brown fat/skeletal muscle switch, Nature, 454 (2008) 961–967. [DOI] [PMC free article] [PubMed] [Google Scholar]
- [15].Inagaki T, Sakai J, Kajimura S, Transcriptional and epigenetic control of brown and beige adipose cell fate and function, Nat Rev Mol Cell Biol, 17 (2016) 480–495. [DOI] [PMC free article] [PubMed] [Google Scholar]
- [16].Yang Q, Liang X, Sun X, Zhang L, Fu X, Rogers CJ, Berim A, Zhang S, Wang S, Wang B, Foretz M, Viollet B, Gang DR, Rodgers BD, Zhu MJ, Du M, AMPK/alpha-Ketoglutarate Axis Dynamically Mediates DNA Demethylation in the Prdm16 Promoter and Brown Adipogenesis, Cell Metab, 24 (2016) 542–554. [DOI] [PMC free article] [PubMed] [Google Scholar]
- [17].Yang QY, Liang JF, Rogers CJ, Zhao JX, Zhu MJ, Du M, Maternal obesity induces epigenetic modifications to facilitate zfp423 expression and enhance adipogenic differentiation in fetal mice, Diabetes, 62 (2013) 3727–3735. [DOI] [PMC free article] [PubMed] [Google Scholar]
- [18].Liang X, Yang Q, Zhang L, Maricelli JW, Rodgers BD, Zhu MJ, Du M, Maternal high-fat diet during lactation impairs thermogenic function of brown adipose tissue in offspring mice, Scientific reports, 6 (2016) 34345. [DOI] [PMC free article] [PubMed] [Google Scholar]
- [19].Trajkovski M, Hausser J, Soutschek J, Bhat B, Akin A, Zavolan M, Heim MH, Stoffel M, MicroRNAs 103 and 107 regulate insulin sensitivity, Nature, 474 (2011) 649–653. [DOI] [PubMed] [Google Scholar]
- [20].Sun L, Xie HM, Mori MA, Alexander R, Yuan BB, Hattangadi SM, Liu QQ, Kahn CR, Lodish HF, Mir193b-365 is essential for brown fat differentiation, Nat. Cell Biol, 13 (2011) 958–U198. [DOI] [PMC free article] [PubMed] [Google Scholar]
- [21].Qiu XY, Li N, Xiao X, Li YM, Aggregation of a parthenogenetic diploid embryo and a male embryo improves the blastocyst development and parthenogenetic embryonic stem cell derivation, Turk J Biol, 41 (2017) 629–639. [Google Scholar]
- [22].Wang H, Mao X, Du M, Phytanic acid activates PPARalpha to promote beige adipogenic differentiation of preadipocytes, J Nutr Biochem, 67 (2019) 201–211. [DOI] [PMC free article] [PubMed] [Google Scholar]
- [23].Imran KM, Rahman N, Yoon D, Jeon M, Lee BT, Kim YS, Cryptotanshinone promotes commitment to the brown adipocyte lineage and mitochondrial biogenesis in C3H10T1/2 mesenchymal stem cells via AMPK and p38-MAPK signaling, Biochim Biophys Acta Mol Cell Biol Lipids, 1862 (2017) 1110–1120. [DOI] [PubMed] [Google Scholar]
- [24].Price NL, Gomes AP, Ling AJY, Duarte FV, Martin-Montalvo A, North BJ, Agarwal B, Ye L, Ramadori G, Teodoro JS, Hubbard BP, Varela AT, Davis JG, Varamini B, Hafner A, Moaddel R, Rolo AP, Coppari R, Palmeira CM, de Cabo R, Baur JA, Sinclair DA, SIRT1 Is Required for AMPK Activation and the Beneficial Effects of Resveratrol on Mitochondrial Function, Cell Metabolism, 15 (2012) 675–690. [DOI] [PMC free article] [PubMed] [Google Scholar]
- [25].Xiang JZ, Cao SY, Zhong L, Wang HN, Pei YL, Wei QQ, Wen BQ, Mu HY, Zhang SP, Yue L, Yue GH, Lim B, Han JY, Pluripotent stem cells secrete Activin A to improve their epiblast competency after injection into recipient embryos, Protein & cell, 9 (2018) 717–728. [DOI] [PMC free article] [PubMed] [Google Scholar]
- [26].Morita M, Gravel SP, Chenard V, Sikstrom K, Zheng L, Alain T, Gandin V, Avizonis D, Arguello M, Zakaria C, McLaughlan S, Nouet Y, Pause A, Pollak M, Gottlieb E, Larsson O, St-Pierre J, Topisirovic I, Sonenberg N, mTORC1 Controls Mitochondrial Activity and Biogenesis through 4E-BP-Dependent Translational Regulation, Cell Metab., 18 (2013) 698–711. [DOI] [PubMed] [Google Scholar]
- [27].Bolger AM, Lohse M, Usadel B, Trimmomatic: a flexible trimmer for Illumina sequence data, Bioinformatics, 30 (2014) 2114–2120. [DOI] [PMC free article] [PubMed] [Google Scholar]
- [28].Kim D, Langmead B, Salzberg SL, HISAT: a fast spliced aligner with low memory requirements, Nat. Methods, 12 (2015) 357–360. [DOI] [PMC free article] [PubMed] [Google Scholar]
- [29].Anders S, Pyl PT, Huber W, HTSeq--a Python framework to work with high-throughput sequencing data, Bioinformatics, 31 (2015) 166–169. [DOI] [PMC free article] [PubMed] [Google Scholar]
- [30].Robinson MD, McCarthy DJ, Smyth GK, edgeR: a Bioconductor package for differential expression analysis of digital gene expression data, Bioinformatics, 26 (2010) 139–140. [DOI] [PMC free article] [PubMed] [Google Scholar]
- [31].Falcon S, Gentleman R, Using GOstats to test gene lists for GO term association, Bioinformatics, 23 (2007) 257–258. [DOI] [PubMed] [Google Scholar]
- [32].Dobin A, Davis CA, Schlesinger F, Drenkow J, Zaleski C, Jha S, Batut P, Chaisson M, Gingeras TR, STAR: ultrafast universal RNA-seq aligner, Bioinformatics, 29 (2013) 15–21. [DOI] [PMC free article] [PubMed] [Google Scholar]
- [33].Gebert D, Hewel C, Rosenkranz D, unitas: the universal tool for annotation of small RNAs, BMC Genomics, 18 (2017) 644. [DOI] [PMC free article] [PubMed] [Google Scholar]
- [34].Dweep H, Gretz N, miRWalk2.0: a comprehensive atlas of microRNA-target interactions, Nat. Methods, 12 (2015) 697. [DOI] [PubMed] [Google Scholar]
- [35].Wang H, Xiang J, Zhang W, Li J, Wei Q, Zhong L, Ouyang H, Han J, Induction of Germ Cell-like Cells from Porcine Induced Pluripotent Stem Cells, Sci. Rep, 6 (2016) 27256. [DOI] [PMC free article] [PubMed] [Google Scholar]
- [36].Arias N, Aguirre L, Fernandez-Quintela A, Gonzalez M, Lasa A, Miranda J, Macarulla MT, Portillo MP, MicroRNAs involved in the browning process of adipocytes, J Physiol Biochem, 72 (2016) 509–521. [DOI] [PubMed] [Google Scholar]
- [37].Sun B, Purcell RH, Terrillion CE, Yan J, Moran TH, Tamashiro KL, Maternal high-fat diet during gestation or suckling differentially affects offspring leptin sensitivity and obesity, Diabetes, 61 (2012) 2833–2841. [DOI] [PMC free article] [PubMed] [Google Scholar]
- [38].Chen JR, Lazarenko OP, Blackburn ML, Rose S, Frye RE, Badger TM, Andres A, Shankar K, Maternal Obesity Programs Senescence Signaling and Glucose Metabolism in Osteo-Progenitors From Rat and Human, Endocrinology, 157 (2016) 4172–4183. [DOI] [PubMed] [Google Scholar]
- [39].Harms M, Seale P, Brown and beige fat: development, function and therapeutic potential, Nat Med, 19 (2013) 1252–1263. [DOI] [PubMed] [Google Scholar]
- [40].Trajkovski M, Lodish H, MicroRNA networks regulate development of brown adipocytes, Trends Endocrinol Metab, 24 (2013) 442–450. [DOI] [PMC free article] [PubMed] [Google Scholar]
Associated Data
This section collects any data citations, data availability statements, or supplementary materials included in this article.


