Abstract
This study aims to determine the non-invasive, reliable and sensitive biochemical parameters for the diagnosis of drug-induced liver injury (DILI).
Ultra-high performance liquid chromatography tandem mass spectrometry (UHPLC-MS/MS) and selected reaction monitoring (SRM) were used to profile the serum metabolome and quantify 15 targeted bile acid metabolites, respectively, in samples obtained from 38 DILI patients and 30 healthy controls.
A comparison of the resulting serum metabolome profiles of the study participants revealed significant differences between DILI patients and healthy controls. Specifically, serum palmitic acid, taurochenodeoxycholic acid, glycocholic acid (GCA), and tauroursodeoxycholic acid (TUDCA) levels were significantly higher, and serum lysophosphatidylethanolamine levels were significantly lower in DILI patients vs healthy controls (P < .001). Furthermore, the SRM assay of bile acids revealed that the increase in GCA, taurocholic acid (TCA), TUDCA, glycochenodeoxycholic acid (GCDCA), glycochenodeoxycholic sulfate (GCDCS), and taurodeoxycholic acid (TDCA) corresponded to a higher degree of liver damage. These results also indicate that serum concentrations of chenodeoxycholic acid (CDCA), deoxycholic acid (DCA) and lithocholic acid (LCA) were significantly lower in patients with severe DILI, when compared to healthy controls, and that this decrease was closely correlated to the severity of liver damage.
Taken together, these results demonstrate that bile acids could serve as potential biomarkers for the early diagnosis and severity of DILI.
Keywords: bile acid, biomarkers, drug induced liver injury, serum metabolic profiling, UHPLC-MS/MS
1. Introduction
Drug-induced liver injury (DILI) is a common adverse event characterized by liver damage induced by a variety of medications, herbal medicines and xenobiotics. DILI is also the most frequently occurring drug reaction that leads to the termination of clinical trials during the development of new therapeutics. Previous studies have identified thousands of drugs that are primarily categorized as anti-infective, pain relievers and neurologic compounds that can cause liver damage, or are potentially toxic to the liver. Furthermore, concerns that other drug excipients, Chinese herbs and prescription medications could cause liver damage are increasing. In some cases, the onset of DILI can rapidly progress to acute liver failure, resulting in a very serious health problem. Notably, no specific clinical signs or symptoms have been observed during the course of DILI, and its clinical manifestations range from asymptomatic, mild and nonspecific biochemical changes to acute liver failure. At present, the risk factors and pathogenic mechanisms underlying DILI remain largely unknown. Hence, the prediction, early diagnosis, and treatment of DILI represent serious clinical challenges.
To date, the temporal correlation of the use of drugs that potentially induce liver toxicity with the exclusion of other differential causes has served as the primary means of diagnosing DILI. The Roussel Uclaf Causality Assessment Method (RUCAM) and the Maria and Victorino scale scoring systems were established for the assessment of causality in drug-induced liver injury.[1–3] Although the histopathological examination of liver biopsies remains invasive, painful, costly and less specific to DILI, this approach has been widely used for DILI diagnosis. A large number of studies have investigated DILI using a single drug, or via a retrospective analysis, which has hindered the establishment of a connection between various forms of DILI, as well as the prediction, early diagnosis, prophylaxis and management of DILI.[4,5]
Metabolomics, which is an emerging “omics” platform, enables the qualitative and quantitative analysis of metabolites present in complex biological samples.[6] As products of cellular adjustment processes, metabolites have been regarded as ultimate indications of genetic or environmental changes in biological systems.[7,8] In fact, high-throughput metabolomics profiling has been successfully used for the identification of novel diagnostic molecules and disease-related pathways, and for the development of new therapeutic targets for a number of diseases, including cancer, non-alcoholic fatty liver disease, non-alcoholic steatohepatitis, and primary biliary cirrhosis.[9–12]
The present study aimed to identify serum biomarkers for DILI and disease–related pathways by profiling the serum metabolome of 38 DILI patients and 30 healthy controls using ultra-high performance liquid chromatography (UHPLC) coupled with LTQ-Orbitrap mass spectrometry (MS). Furthermore, a targeted metabolomics approach was applied to quantify and compare 15 bile acid metabolites in DILI patients and healthy controls. These present findings might provide potential novel biomarkers for the early prediction of liver damage, the diagnosis of DILI, or the determination of the degree of DILI severity.
2. Materials and methods
2.1. Ethical approval
The present study was approved by the ethics committee of The First Hospital of Jilin University. All procedures performed in studies that involved human participants were in accordance with the ethical standards of the institutional and/or national research committee, and with the 1964 Helsinki declaration and its later amendments or comparable ethical standards.
2.2. Patients and study design
Thirty-eight DILI patients admitted to the Affiliated Hospital of the Medical School of Jilin University from May 2009 to November 2013 were prospectively recruited to participate in the present study. The diagnosis of DILI was made in accordance with the following previously reported diagnostic criteria:[3,13]
-
(i)
patients with a clear medical history and suspected drug use concurrent with drug-induced liver damage;
-
(ii)
patients who exhibited various degrees of digestive system symptoms at 1 to 4 weeks after drug administration, including loss of appetite, fatigue, abdominal discomfort, nausea and vomiting;
-
(iii)
patients with laboratory test results suggestive of liver damage, including markedly elevated serum alanine aminotransferase (ALT>40 U/L) and total bilirubin (TBIL>20 μmol/L) levels;
-
(iv)
patients negative for autoimmune hepatitis-specific antibodies and viral hepatitis serological markers. Patients with known or prior alcoholic liver disease, autoimmune hepatitis, viral hepatitis, liver or bone transplantation, genetic disease or cancer, or pregnant or lactating female patients were excluded from the present study. Thirty healthy individuals were enrolled into the present study and served as normal controls. Prior to the baseline study, all participants provided a written informed consent.
The study protocol was carefully reviewed and approved by the Medical Ethics Committee of the Affiliated Hospital of the Medical School of Jilin University. Prior to the baseline study, eligible patients and health controls provided a written informed consent.
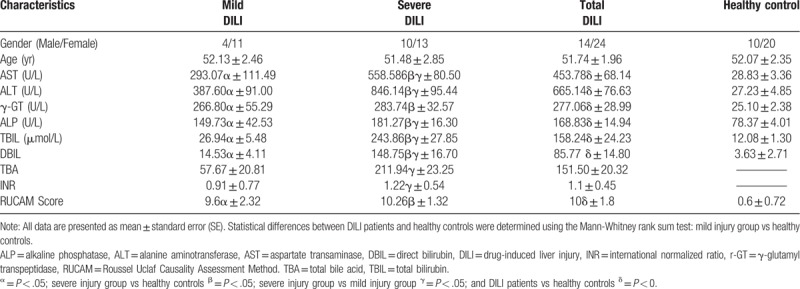
Blood samples were collected from DILI patients and healthy controls at the fasting state, and 1 mL of the resulting serum was prepared and stored at −80°C for subsequent metabolic profiling. DILI patients were divided into 2 groups according to the grade of acute DILI severity: mild DILI and severe DILI groups.[14] Mild DILI was defined as elevated serum ALT and/or alkaline phosphatase (ALP), TBIL less than 2.5 × the upper limit of normal (ULN; 2.5 mg/dl or 42.75 μmol/L), and an international normalized ratio (INR) of less than 1.5. Severe DILI was defined as patients with increased serum ALT and/or ALP, and TBIL greater than 5× ULN (5 mg/dl or 85.5 μmol/L), with or without an INR greater than 1.5.
The selected reaction monitoring (SRM) analysis of the bile acids was performed on samples obtained from 38 DILI patients (mild DILI, n = 15 and severe DILI, n = 23), and these was compared with samples obtained from normal, healthy controls (n = 30). The baseline characteristics of these patients are summarized in Table 1. The initial medical examination revealed that none of these patients had diabetes or dyslipidemia, or any evidence of gallstone or liver dysfunction. In addition, none of these subjects previously received ursodeoxycholic acid (UDCA).
Table 1.
Characteristics of the DILI patients enrolled in the metabolic profiling study.
2.3. Reagents
The HPLC-grade acetonitrile (ACN) purchased from Merck (Kenilworth, NJ, USA) and HPLC-grade formic acid obtained from Sigma-Aldrich (St. Louis, MO, USA) were used for the preparation of the mobile phases. Milli-Q water, which was obtained by filtering distilled water through a Milli-Q system (Millipore, Bedford, MA), was also used. The chemical standards used for the molecular structure validation were obtained from Sigma-Aldrich (St. Louis, MO).
2.4. Sample preparation and serum metabolic profiling
Each serum sample (100 μL) was mixed with 400 μL of cold ACN for protein precipitation, followed by centrifugation at 14,000 × g for 10 minutes at 4°C. Subsequently, 400 μL of the supernatant was collected and lyophilized, and the residue was resolved in 100 μL of 20% ACN. Equal aliquots of each serum sample were pooled and mixed thoroughly by vortex for one minute, which was used as the quality control (QC) sample. The QC sample was prepared in the same manner as the actual samples, and was inserted after every 10 samples to assess the repeatability of the sample pretreatment and monitor the stability of the LC-MS system.
An LC-MS/MS approach was used to profile the serum metabolites in samples obtained from DILI patients and controls, as previously described.[15] Briefly, 5 μL of each sample was injected into the LC system (Waters, U.K.) and coupled to a LTQ-Orbitrap mass spectrometer (Thermo Fisher). The Acquity UPLC C18 column (2.1 mm i.d. × 100 mm, 1.7 um), which was purchased from Waters (Milford, MA), was used for the separation of small molecular compounds at an elution speed of 0.35 ml/min. Then, the gradient was set at 95% A (0.1% formic acid, V/V), and maintained for one minute. Subsequently, the elution strength was linearly increased to 100% B (ACN) for 22 minutes and maintained for 3 minutes. The entire duration was 30 minutes, which included the equilibration for one minute. The LTQ-Orbitrap mass spectrometer was equipped with an electrospray ionization source, and this was operated in both the positive and negative ion modes.[16] MS scans were acquired over the range of 100 to 1000 m/z.[16]
2.5. Analysis of bile acids
GCA-d5 was added to all samples as the internal standard, and the blood samples were resolved in 100 μL of the 25% ACN aqueous solution. The LC-MS parameters were as follows: 20 μL of the reconstituted solution was carefully injected onto an Acquity UPLC C8 column with a particle size of 1.7 μm (Waters, Milford, MA). The samples were eluted from the column using a linear gradient of solution A (10 mM of NH4HCO3) and B (ACN), with the initial gradient set to 75% A. After 9.0 minutes, the strength was linearly increased to 90% B and maintained for 4 minutes, and returned back to the initial gradient after 13.5 minutes. Including the 1.5-minute equilibration step, the entire run time was approximately 15 minutes. The SRM signals were obtained using an Agilent 6460 Triple Quadruple MS instrument (Agilent Technologies) equipped with an electrospray source operated in negative ion mode. The following MS parameters were used: gas flow rate, 8 L/min; gas temperature, 350°C; sheath gas temperature, 400°C; nebulizer gas pressure, 40 psi; capillary voltage, 3500 V; sheath gas flow rate, 8 L/min; nozzle voltage, 400 V. The precursor and product ion pairs were acquired, as follows: CA (407.5→407.5), GCA (464.2→74.1), TCA (514.2→80.1), UDCA (391.4→391.4), GUDCA (448.3→74.1), TUDCA (498.3→80.1), CDCA (391.4→391.4), GCDCA (448.3→74.1), TCDCA (498.2→80.1), GCDCS (528.3→448.3), DCA (391.2→391.2), GDCA (448.2→74.1), TDCA (498.3→80.2), LCA (375.3→375.3), TLCA (482.1→80.1), and GCA-d5 (469.2→74.1).
2.6. Bioinformatics and statistical analysis
The aligned dataset was obtained from the raw data using the SIEVE software (version 2.1, Thermo Fisher Scientific). The peaks and the corresponding m/z values and the peak intensities and retention times were exported into an Excel data table. Prior to the univariate and multivariate statistical analyses, each peak area was normalized to the total peak area. In the multivariate analysis, a principal component analysis (PCA) with a partial least squares-discriminant analysis (PLS-DA) was conducted on the prepared data using SIMCA-P11.0 (Umetrics AB, Umea, Sweden). After scaling for PCA to unit variance, these data provided an overview of the repeatability of the QC samples. Concurrently, the data were Pareto scaled for PLS-DA to assess the performance of the classification models, and identify the variables for the corresponding model.
In the univariate analysis, all of the selected differentially expressed ions were transformed in the SPSS 18.0 software (SPSS, Chicago, IL). Nonparametric statistical analyses were conducted using GraphPad Prism 5.0 (GraphPad Software, San Diego, CA) for comparisons between the 2 groups, with P < .05 as an indication of statistical significance. The area under the receiver operating characteristic (ROC) curve (AUC) was computed via the numerical integration of the curve. The metabolites, which were identified as the greater AUCs, represented a stronger separation and predictive power.
3. Results
3.1. Patient characteristics
Sixty-eight human subjects were included in the serum metabolome profiling and target bile acid study. The demographic, biochemical and clinical characteristics of the 38 DILI patients and 30 healthy controls are presented in Table 1. The average age of these DILI patients was 51.74 ± 1.96 years old (mean ± standard deviation [SD]), which ranged within 27 to 68 years old, while the average age of healthy controls was 52.07 ± 2.35 years old, which ranged within 25 to 68 years old. No significant difference in the demographic characteristics was detected between DILI patients and healthy controls. Patients with DILI were conservatively evaluated using the widely used RUCAM scoring system. A resulting score of >8 was considered “definite or highly probable.” These DILI patients were divided into 2 groups: mild and severe injury groups. As shown in Table 1, the ALT, AST, ALK, TBIL, DBIL, and TBA levels were significantly elevated (P < .05) in DILI patients in the severe injury group, when compared to DILI patients in the mild injury group. A list of all of drugs that caused DILI is presented in Table 2. The majority of DILI cases were attributed to the use of traditional Chinese medicine (TCM), while the remaining cases were caused by analgesic-antipyretic drugs, anti-tuberculosis drugs, antibiotics, antihypertensive drugs, and weight-reducing medicine, among others.
Table 2.
Patient medication histories.

3.2. Comparison of serum metabolic profiles in DILI patients and healthy controls
Sixty-eight serum samples were analyzed by LC-MS/MS in both the positive and negative ion modes. A typical base peak chromatogram detected by MS is presented in Figure 1. After the peaks were aligned, 1706 positive ion peaks and 1,641 negative ion peaks were detected. The data were transformed into SIMCA-P11 for PCA. The plots of the PCA scores for the positive and negative ion mode peaks are illustrated in Figures 1A and 2A. Distinct clustering between DILI patients and healthy controls was observed. The QC samples were tightly clustered (Figs. 1A and 2A), which ensured the repeatability of the metabolomics data.[17] In addition, variations in marker metabolites were observed in the QC samples, which were used in the present study to assess the overall method performance.[17]
Figure 1.
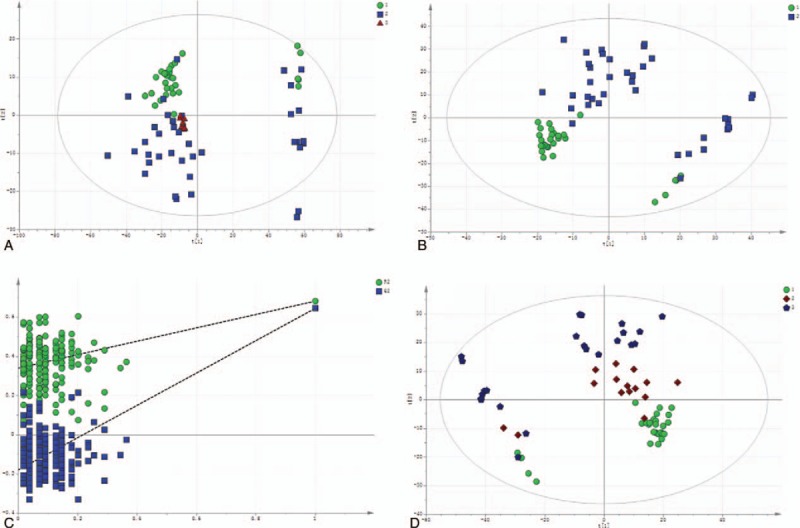
The multivariate statistical analysis of serum profiling data generated in positive ion mode. (A) Plots of the principal component analysis (PCA) scores of peaks detected in the positive ion mode. 1: healthy control; 2: DILI; 3: quality control. (B) Scatter plots of the partial least squares-discriminant analysis (PLS-DA) with a positive ion model of serum obtained from patients with DILI and healthy controls. 1: healthy control; 2: DILI. (C) Validation plot of the original PLS-DA with a positive ion model, strongly indicating that the original model was valid and revealed no signs of overfitting. The permutation test was repeated for 200 times in the cross-validation plot. (D) The plots of PCA scores of the peaks detected in the positive ion mode using serum samples obtained from patients in the mild and severe injury groups. 1: healthy control; 2: mild DILI; 3: severe DILI.
Figure 2.
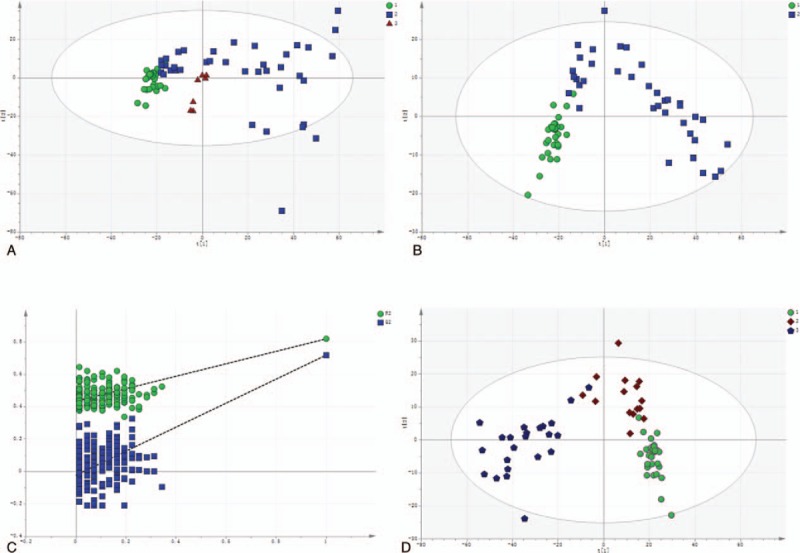
The multivariate statistical analysis of serum profiling data generated in the negative ion mode. (A) Plots of PCA scores of peaks detected in the negative ion mode. 1: healthy control; 2: DILI; 3: quality control. (B) Scatter plots of the PLS-DA with a negative ion model of serum obtained from patients with DILI and healthy controls. 1: healthy control; 2: DILI. (C) Validation plot of the original PLS-DA with a negative ion model, strongly indicating that the original model is valid and shows no signs of overfitting. The permutation test was repeated for 200 times in the cross-validation plot. (D) The plots of PCA scores of the peaks detected in the negative ion mode for serum obtained from patients in the mild and severe injury groups. 1: healthy control; 2: mild DILI; 3: severe DILI.
In order to better characterize the serum metabolites of DILI patients vs healthy controls, PLS-DA models were constructed, and these revealed a separation between the 38 DILI patients (blue box) and 30 healthy controls (green dot) with a satisfactory discriminating ability. Three main components (R2X = 0.594, R2Y = 0.993, and Q2 = 0.988) were detected in the positive ion model, while 2 principal components (R2X = 0.47, R2Y = 0.995, and Q2 = 0.993) were detected in the negative ion model (Figs. 1B and 2B). The R2Y (cum) and Q2 (cum) parameters indicated the fitness and predictability, respectively, and the obtained results indicated the stability and good fitness of the model parameters.
Similar results were observed in the PLS-DA models, which revealed a clear separation between DILI patients in the mild and severe injury groups. DILI patients in the mild injury group (dark red diamond) and severe injury group (dark blue pentagon) were compared with healthy controls (green dot) in the positive ion mode (R2X = 0.605, R2Y = 0.76, and Q2 = 0.452; Fig. 1D), and healthy controls (green dot) in the negative ion mode (R2X = 0.762, R2Y = 0.74, and Q2 = 0.589; Fig. 2D). Furthermore, the PLS-DA validation plot with a positive and negative model (Figs. 1C and 2C) indicated that the original model was valid and revealed no sign of overfitting.
3.3. Identification of serum metabolites specific to DILI
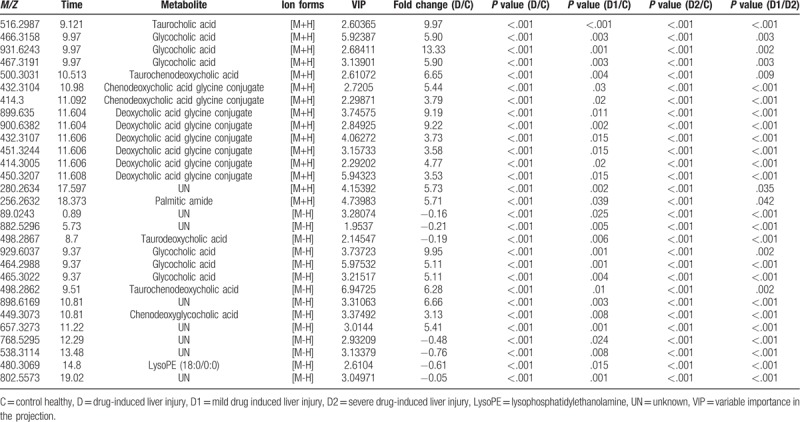
Next, the PLS-DA model data were used to identify metabolites that exhibited differential abundance in DILI patients and healthy controls. As presented in Table 3, 29 serum metabolites with a threshold variable importance in the projection (VIP) value greater than one in the PLS-DA model were significantly altered in relation to DILI (P < .001). Fold-change was used to indicate changes in potential DILI-specific biomarkers, and the chosen values were >2 or < 0.5. Among the identified metabolites, 22 metabolites were validated using reference standards. Among the annotated metabolites, 6 metabolites were deoxycholic acid glycine conjugates, 2 metabolites were chenodeoxycholic acid (CDCA) glycine conjugates, and 6 metabolites were glycocholic acid (GCA) glycine conjugates. Furthermore, taurocholic acid (TCA), 2 taurochenodeoxycholic acids (TCDCAs), taurodeoxycholic acid (TDCA), LysoPE (18:0/0:0), and palmitic amide were identified as the candidate biomarkers shared by DILI patients and healthy controls. The bile acid and palmitic amide levels detected in the negative ion mode increased, except for TDCA, displaying the same trends in DILI patients, while LysoPE (18:0/0:0) decreased in DILI patients. The abnormality of these compounds in DILI provides evidence of the correlation between the disease and pathways involved in the metabolism or excretion of bile acid, fatty acid oxidation, cholesterol, inflammation, and membrane formation.
Table 3.
Potential serum biomarkers for DILI patients compared to healthy controls in positive and negative ions model.
3.4. Quantification of targeted bile acids specific to DILI
Recently, bile acids have been shown to be potentially better biomarkers for DILI. Based on reports on the most abundant bile acids in humans, the following 15 bile acids were selected: cholic acid (CA), GCA, TCA, UDCA, glycoursodeoxycholic acid (GUDCA), tauroursodeoxycholic acid (TUDCA), CDCA, glycochenodeoxycholic acid (GCDCA), TCDCA, glycochenodeoxycholic sulfate (GCDCS), deoxycholic acid (DCA), glycodeoxycholic acid (GDCA), TDCA, lithocholic acid (LCA), and taurolithocholic acid (TLCA). The levels of these 15 bile acids were quantified using LC-MS in the samples obtained from the studied subjects, and the multivariate statistical analysis results revealed the separation of DILI patients and healthy controls, suggesting the disturbance of bile acid metabolism or secretion due to DILI (Fig. 3A). Similar results were observed in the PLS-DA models (Fig. 3B), which exhibited a clear separation between the mild and severe injury groups. Furthermore, the validation plot of the PLS-DA (Fig. 3C) indicated that the original model was valid, and revealed no sign of overfitting. DILI patients in the mild and severe injury groups were compared with healthy controls (Fig. 3D).
Figure 3.
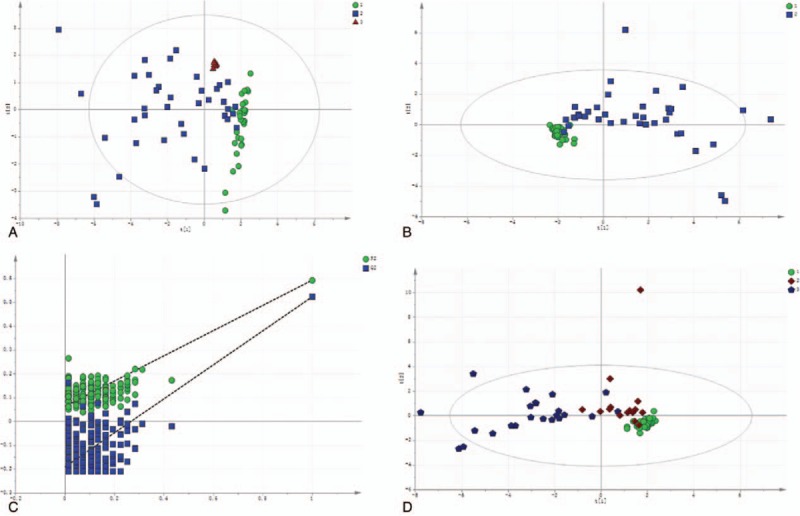
Quantification of targeted bile acids in DILI patients and healthy controls. (A) The plot of PCA scores with the unit variance scaling of all variables. DILI (blue box), healthy controls (green dot), and QC (red triangle). 1: healthy control; 2: DILI; 3: QC. (B) Scatter plots of the PLS-DA of serum obtained from DILI patients and healthy controls. 1: healthy control; 2: DILI. (C) The permutation test was repeated for 200 times in the cross-validation plot. (D) The plots of PLS for serum obtained from patients in the mild and severe injury groups. 1: healthy control; 2: mild DILI; 3: severe DILI.
Furthermore, the bile acid levels of these 2 DILI patient groups were also compared (Table 4) with the corresponding levels in healthy controls (Fig. 4). The difference in GCA, TCA, TUDCA, GCDCA, GCDCS, and TDCA among the 3 groups was statistically significant, with an apparent gradual increase that was proportional to the increase in DILI severity. In addition, the levels of these 6 bile acids were significantly higher in patients in the severe DILI group, when compared with the levels in healthy controls (P < .05) and the mild injury group (P < .05). Furthermore, the DCA, CDCA and LCA levels were significant lower in DILI patients in the severe injury group, when compared with healthy controls (P < .05; Fig. 4, Table 4). Moreover, the CA-to-CDCA ratio progressively increased in relation to the level of DILI severity. Thus, bile acids potentially served as markers for early diagnosis, and for determining the degree of DILI severity. Among the differentially expressed bile acids in the ROC analysis (Fig. 5A), the AUC values were greater than 0.9, which is strongly predictive for distinguishing DILI patients from healthy controls. In addition, GCA, TCA, TUDCA, GCDCA, GCDCS and TDCA differentiated DILI patients from healthy controls. The ROC analysis results were as follows: GCA (AUC = 0.978 [0.974, 0.867]), TCA (AUC = 0.985 [0.947, 0.933]), TUDCA (AUC = 0.909 [0.868, 0.767]), GCDCA (AUC = 0.954 [0.921, 0.933]), GCDCS (AUC = 0.946 (0.868, 1.000]), TDCA (AUC = 0.976 [0.921, 0.933]), ALT (AUC = 0.97 [0.95, 1.00], AST (AUC = 0.97 [0.89, 1.00], GGT (AUC = 0.97 [0.95, 0.93]), ALP (AUC = 0.85 [0.76, 1.00]), TBIL (AUC = 0.91 [0.79, 0.97]), DBIL (AUC = 0.93 [0.84, 0.97]), and RUCAM score (AUC = 1.00 [1.00, 1.00]). These results indicate the excellent predictive and diagnostic values for DILI. The results of the ROC analysis of bile acids that decreased (Fig. 5B) were as follows: DCA (AUC = 0.77 [0.68, 0.9]), LCA (AUC = 0.66 [0.61, 0.73]), and CDCA (AUC = 0.67 [0.61, 0.73]). These indicate that these bile acids had lower sensitivity and specificity, when compared with ALT, AST, GGT, ALP, TBIL, DBIL, and the RUCAM score.
Table 4.
Comparative analysis of bile acid levels in DILI patients in the mild and severe injury groups, and in healthy controls.
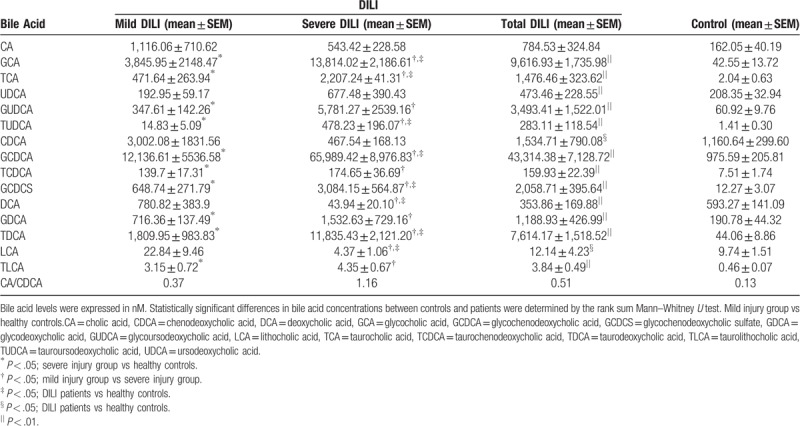
Figure 4.
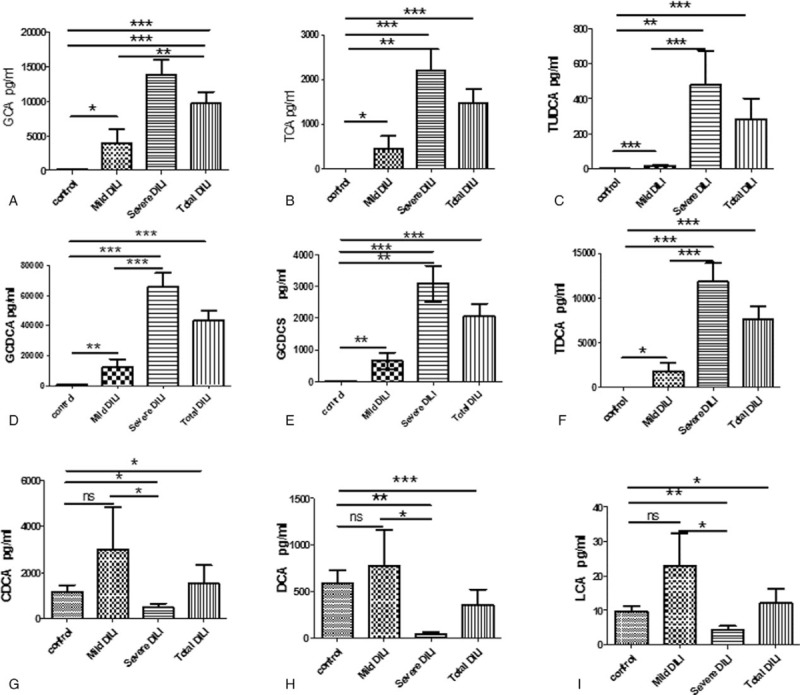
Comparative analysis of alterations in serum bile acid levels in patients in the mild and severe injury groups, and in healthy controls. (A) GCA; (B) TCA; (C) TUDCA; (D) GCDCA; (E) GCDCS; (F) TDCA; (G) DCA; (H) CDCA; and (I) LCA; ∗P < .05, ∗∗P < .001, and ∗∗∗P < .0001; ns, not significant.
Figure 5.
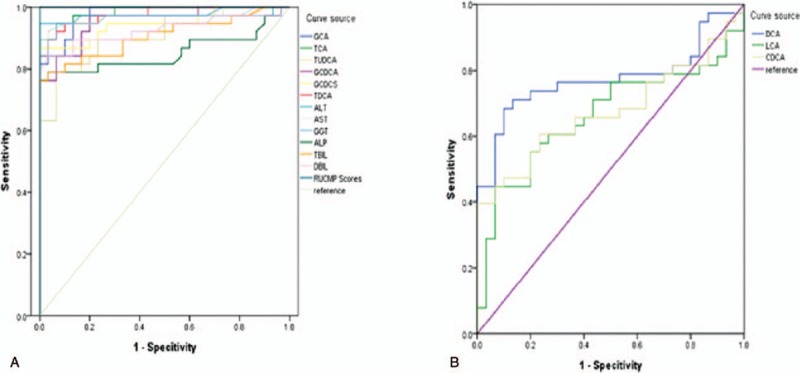
Analysis of the specificity and sensitivity of bile acids in differentiating DILI patients from healthy controls. (A) Data were presented as the area under receiver operating characteristics curve (AUC). GCA (AUC = 0.978 [0.974, 0.867]), TCA (AUC = 0.985 [0.947, 0.933]), TUDCA (AUC = 0.909 [0.868, 0.767]), GCDCA (AUC = 0.954 [0.921, 0.933]), GCDCS (AUC = 0.946 [0.868, 1.000]), TDCA (AUC = 0.976 [0.921, 0.933]), ALT (AUC = 0.97 [0.95, 1.00], AST (AUC = 0.97 [0.89, 1.00], GGT (AUC = 0.97 [0.95, 0.93]), ALP (AUC = 0.85 [0.76, 1.00]), TBIL (AUC = 0.91 [0.79, 0.97]), DBIL (AUC = 0.93 [0.84,0.97]), and RUCAM score (AUC = 1.00 [1.00, 1.00]). (B) Data were presented as the AUC. DCA (AUC = 0.77 [0.68, 0.9]), LCA (AUC = 0.66 [0.61, 0.73]), CDCA (AUC = 0.67 [0.61, 0.73]).
4. Discussion
The prediction and early diagnosis of DILI is critical for ensuring the best possible management of patients, and for preventing this adverse clinical event from progressing to acute liver failure. Accordingly, there is an urgent need to establish non-invasive markers for DILI and elucidate the pathogenic mechanisms underlying DILI in humans. The present study compared the serum metabolome and targeted bile acid profiles of DILI patients and healthy control individuals. The present major novel findings included the significant alteration of the serum metabolome (P < .01) and bile acid profiles in DILI patients, when compared to healthy controls. Furthermore, the quantification of bile acid metabolites in these 2 DILI groups (mild and severe injury) and healthy controls led to the identification of potential novel biomarkers for diagnosing and grading DILI. These present results indicate that metabolomics is an effective diagnostic method, and that bile acid levels are correlated to DILI.
In the present study, DILI patients had higher GCA, TCA, GCDCA, TUDCA, GCDCS, and TDCA levels, and lower DCA, CDCA, and LCA levels. Although no statistically significant differences in other bile acids were found between these groups, the obvious changes that occurred in the remainder of the bile acids indicated that the pathway governing bile acid metabolism plays a role in the pathogenesis of DILI. Furthermore, the changes in the bile acid metabolites detected in patients with mild liver damage were more significant at the early diagnosis of DILI. Although there is no established DILI diagnostic marker that can be used as a reference, the candidate biomarkers identified in the present study demonstrated the ability to distinguish DILI patients from healthy subjects with high sensitivity and specificity.
GCA is a secondary bile acid produced by an enzymatic reaction in the colorectal microbial flora that consists of acyl glycine and a bile acid-glycine conjugate. TCA has been found to increase fetal serum levels of taurocholate in obstetric cholestasis, causing the development of fetal dysrhythmia and the occurrence of sudden intrauterine death. Likewise, it has been reported that TUDCA plays a role in preventing apoptosis and protecting mitochondria from adverse cellular factors that interfere with energy production.[18] In fact, TUDCA is reportedly released into the bile canaliculus, affecting the biological functions of biliary epithelial cells. For example, TUDCA stimulates the secretion of adenosine triphosphate in these cells.[17] Previous studies have also demonstrated that both TDCA and TUDCA exhibit a protective role in combating oxidative and endoplasmic reticulum stress.[19–21] GCDCS, which is usually in the form of sodium salt, is known as bile salt, and is produced in the liver from chenodeoxycholate and glycine. It has been well-documented that GCDCS solubilizes fats and facilitates their absorption. In addition, the ratio of serum cholic acid/CDCA is also linked to hepatic fibrosis, which limits plate disruption and liver inflammation. These results suggest that these bile acids can play a potential monitoring role in liver injury.
CDCA can be slightly toxic to the liver,[22] while DCA reportedly produces free radicals, resulting in oxidative stress and cell death in liver cirrhosis.[23] Li et al reported alterations in bile acids in CCL4-induced liver injury.[24] In addition, a metabolomics study conducted by Asch et al revealed a shift towards the alteration of pathways involved in the synthesis of bile acids in alcoholic hepatitis.[25] Bile acids are known to impair the function of the mitochondrial electron transport chain, and induce the marked production of reactive oxygen species and oxidative stress. Furthermore, exposure to hydrophobic bile acids has been found to directly activate apoptosis and necrosis-associated pathways.[26,27] Notably, CDCA and LCA activate the mammalian farnesoid X receptor, which is a major transcription factor that modulates bile salt synthesis,[28,29] and bile acids induce the transcription of the farnesoid X receptor gene in DILI. Since these are liver-specific metabolites, bile acids have been considered potential markers of liver injury in several metabolomics studies.[30,31] Therefore, bile acids have been considered as a hallmark of liver injury. Furthermore, bile acids directly activate the proinflammatory signaling network in hepatocytes, and induce the upregulation of multiple pro-inflammatory mediators, such as cytokines, chemokines, adhesion molecules and other proteins.[32]
Conversely, significantly lower lysophosphatidylcholine levels were observed in serum obtained from patients with DILI, liver cirrhosis, liver failure and acute alcoholic hepatitis.[15,33] Although it has been reported that lysophosphatidylcholine is an important compound involved in the regulation of broad biological processes, such as cellular proliferation, cancer cell invasion and inflammation in the human body, and that decreases in lysophosphatidylcholine degradation and synthesis contribute to plasma membrane remodeling, the real cause of lysophosphatidylcholine reduction remains unknown. Hence, further investigations are needed in the future.[34]
In the present study, GCA, TCA, TUDCA, GCDCA, GCDCS, and TDCA were significantly elevated in DILI patients in both the mild and severe injury groups. Thus, the possibility exists that these metabolites could be involved in the determination of the severity of DILI. Increased bilirubin levels are a hallmark of cholestasis. Thus, it is noteworthy that the levels of upstream metabolites GCA, TCA, TUDCA, GCDCA, GCDCS, and TDCA also increased in cholestasis. These results were consistent with previous findings, indicating that GCA, TCA, and GCDCA could play an important role in liver injury and cholestasis,[35] and that GCA, TCA, and GCDCA are significantly elevated when biliary excretion is reduced.[36] Along with other previous studies,[37–40] it is likely that changes in the bile acids studied, including GCA, GCDCA and TCA, contribute to the phenotype and cause of cholestasis progression.
The present study had several limitations. The sample size was relatively small, which was mainly due to the limited number of DILI patients during the study period (>4 years), and no power calculations were conducted to optimize the number of human subjects included in the present study. Another potential limitation was that merely a proportion of DILI cases were confirmed via the pathological evaluation of liver biopsies obtained from the DILI subjects included in the present study. Among the patients included in the present retrospective study, merely 6 patients who underwent liver biopsy had subsequent results of pathological examinations indicative for drug-induced liver injury, while the remaining patients were diagnosed with drug-induced liver injury mainly in accordance with the criteria in the RUCAM scoring system (scores more than 8). Since the acute onset of drug-induced liver injury in a majority of such patients has posed a challenge in conducting liver biopsy in clinical practice, merely a small fraction of patients received a biopsy. Due to the interesting findings revealed in the present study, further investigations of the DILI-associated bile acids are presently being conducted in our laboratory.
To the best of our knowledge, this study is the first to apply targeted metabolomics to search for diagnostic biomarkers of DILI in humans. Furthermore, there present results suggest that GCA, TCA, TUDCA, GCDCA, GCDCS, and TDCA hold promise as potential novel biomarkers for the early prediction of liver damage, the diagnosis of DILI, and/or the determination of the degree of DILI severity. Lastly, CDCA, DCA, and LCA could reflect the severity, and play a role in the pathogenesis of DILI.
Author contributions
Conceptualization: Zhenhua Ma, Peiyuan Yin, Lina Zhou, Junqi Niu.
Data curation: Zhenhua Ma, Xiaomei Wang, Peiyuan Yin, Guowang Xu, Junqi Niu.
Formal analysis: Zhenhua Ma, Xiaomei Wang, Peiyuan Yin, Ruihong Wu, Guowang Xu, Junqi Niu.
Funding acquisition: Xiaomei Wang, Peiyuan Yin, Ruihong Wu, Lina Zhou, Guowang Xu, Junqi Niu.
Investigation: Xiaomei Wang, Ruihong Wu, Guowang Xu.
Methodology: Ruihong Wu, Lina Zhou.
Project administration: Lina Zhou, Junqi Niu.
Resources: Zhenhua Ma, Lina Zhou, Junqi Niu.
Software: Lina Zhou.
Footnotes
Abbreviations: ALP = alkaline phosphatase, ALT = alanine aminotransferase, AST = aspartate transaminase, CA = cholic acid, CDCA = chenodeoxycholic acid, DBIL = direct bilirubin, DCA = deoxycholic acid, DILI = drug-induced liver injury, GCA = glycocholic acid, GCDCA = glycochenodeoxycholic acid, GCDCS = glycochenodeoxycholic sulphate, GDCA = glycodeoxycholic acid, TDCA = taurodeoxycholic acid, GUDCA = glycoursodeoxycholic acid, INR = international normalized ratio, LCA = lithocholic acid, PCA = Plots of the principal component analysis, PLS = scatter plots of partial least squares, QC = quality control, r-GT = γ-glutamyl transpeptidase, RUCAM = Roussel Uclaf Causality Assessment Method, AUC = area under receiver operating characteristics curve, SRM = selected reaction monitoring, TBA = total bile acid, TBIL = total bilirubin, TCA = taurocholic acid, TCDCA = taurochenodeoxycholic acid, TLCA = taurolithocholic acid, TUDCA = tauroursodeoxycholic acid, UDCA = ursodeoxycholic acid, UHPLC-MS/MS = Ultra-high performance liquid chromatography tandem mass spectrometry, VIP = variable importance in the projection.
This study was sponsored by the National Basic Research Program of China (973 Program) (2015CB554304), the National Natural Science Foundation of China (Grants no. 81373057), and the Health and Family Planning Commission Project of Jilin Province (2016Q043).
The authors declare that they have no conflict of interest.
References
- [1].Danan G, Benichou C. Causality assessment of adverse reactions to drugs--I. A novel method based on the conclusions of international consensus meetings: application to drug-induced liver injuries. J Clin Epidemiol 1993;46:1323–30. [DOI] [PubMed] [Google Scholar]
- [2].Benichou C, Danan G, Flahault A. Causality assessment of adverse reactions to drugs--II. An original model for validation of drug causality assessment methods: case reports with positive rechallenge. J Clin Epidemiol 1993;46:1331–6. [DOI] [PubMed] [Google Scholar]
- [3].Maria VA, Victorino RM. Development and validation of a clinical scale for the diagnosis of drug-induced hepatitis. Hepatology 1997;26:664–9. [DOI] [PubMed] [Google Scholar]
- [4].Woodhead JL, Howell BA, Yang Y, et al. An analysis of N-acetylcysteine treatment for acetaminophen overdose using a systems model of drug-induced liver injury. J Pharmacol Exp Ther 2012;342:529–40. [DOI] [PubMed] [Google Scholar]
- [5].Hawkins MT, Lewis JH. Latest advances in predicting DILI in human subjects: focus on biomarkers. Expert Opin Drug Metab Toxicol 2012;8:1521–30. [DOI] [PubMed] [Google Scholar]
- [6].Dumas ME, Davidovic L. Metabolic profiling and phenotyping of central nervous system diseases: metabolites bring insights into brain dysfunctions. J Neuroimmune Pharmacol 2015;10:402–24. [DOI] [PubMed] [Google Scholar]
- [7].Clayton TA, Lindon JC, Cloarec O, et al. Pharmaco-metabonomic phenotyping and personalized drug treatment. Nature 2006;440:1073–7. [DOI] [PubMed] [Google Scholar]
- [8].Blow N. Metabolomics: Biochemistry's new look. Nature 2008;455:697–700. [DOI] [PubMed] [Google Scholar]
- [9].Yin P, Wan D, Zhao C, et al. A metabonomic study of hepatitis B-induced liver cirrhosis and hepatocellular carcinoma by using RP-LC and HILIC coupled with mass spectrometry. Mol Biosyst 2009;5:868–76. [DOI] [PubMed] [Google Scholar]
- [10].Tokushige K, Hashimoto E, Kodama K, et al. Serum metabolomic profile and potential biomarkers for severity of fibrosis in nonalcoholic fatty liver disease. J Gastroenterol 2013;48:1392–400. [DOI] [PMC free article] [PubMed] [Google Scholar]
- [11].Barr J, Caballeria J, Martinez-Arranz I, et al. Obesity-dependent metabolic signatures associated with nonalcoholic fatty liver disease progression. J Proteome Res 2012;11:2521–32. [DOI] [PMC free article] [PubMed] [Google Scholar]
- [12].Hao J, Yang T, Zhou Y, et al. Serum metabolomics analysis reveals a distinct metabolic profile of patients with primary biliary cholangitis. Sci Rep 2017;7:784. [DOI] [PMC free article] [PubMed] [Google Scholar]
- [13].Larrey D. Drug-induced liver diseases. J Hepatol 2000;32:77–88. [DOI] [PubMed] [Google Scholar]
- [14].Watkins PB, Seligman PJ, Pears JS, et al. Using controlled clinical trials to learn more about acute drug-induced liver injury. Hepatology 2008;48:1680–9. [DOI] [PubMed] [Google Scholar]
- [15].Zhou L, Ding L, Yin P, et al. Serum metabolic profiling study of hepatocellular carcinoma infected with hepatitis B or hepatitis C virus by using liquid chromatography-mass spectrometry. J Proteome Res 2012;11:5433–42. [DOI] [PubMed] [Google Scholar]
- [16].Chen J, Zhang X, Cao R, et al. Serum 27-nor-5beta-cholestane-3,7,12,24,25 pentol glucuronide discovered by metabolomics as potential diagnostic biomarker for epithelium ovarian cancer. J Proteome Res 2011;10:2625–32. [DOI] [PubMed] [Google Scholar]
- [17].Yin P, Zhao X, Li Q, et al. Metabonomics study of intestinal fistulas based on ultraperformance liquid chromatography coupled with Q-TOF mass spectrometry (UPLC/Q-TOF MS). J Proteome Res 2006;5:2135–43. [DOI] [PubMed] [Google Scholar]
- [18].Nathanson MH, Burgstahler AD, Masyuk A, et al. Stimulation of ATP secretion in the liver by therapeutic bile acids. Biochem J 2001;358:1–5. [DOI] [PMC free article] [PubMed] [Google Scholar]
- [19].Ratziu V, de Ledinghen V, Oberti F, et al. A randomized controlled trial of high-dose ursodesoxycholic acid for nonalcoholic steatohepatitis. J Hepatol 2011;54:1011–9. [DOI] [PubMed] [Google Scholar]
- [20].Seyhun E, Malo A, Schafer C, et al. Tauroursodeoxycholic acid reduces endoplasmic reticulum stress, acinar cell damage, and systemic inflammation in acute pancreatitis. Am J Physiol Gastrointest Liver Physiol 2011;301:G773–782. [DOI] [PubMed] [Google Scholar]
- [21].Yang JS, Kim JT, Jeon J, et al. Changes in hepatic gene expression upon oral administration of taurine-conjugated ursodeoxycholic acid in ob/ob mice. PLoS One 2010;5:e13858. [DOI] [PMC free article] [PubMed] [Google Scholar]
- [22].Nittono H, Obinata K, Nakatsu N, et al. Sulfated and nonsulfated bile acids in urine of patients with biliary atresia: analysis of bile acids by high-performance liquid chromatography. J Pediatr Gastroenterol Nutr 1986;5:23–9. [DOI] [PubMed] [Google Scholar]
- [23].Fitian AI, Nelson DR, Liu C, et al. Integrated metabolomic profiling of hepatocellular carcinoma in hepatitis C cirrhosis through GC/MS and UPLC/MS-MS. Liver Int 2014;34:1428–44. [DOI] [PMC free article] [PubMed] [Google Scholar]
- [24].Yang L, Xiong A, He Y, et al. Bile acids metabonomic study on the CCl4- and alpha-naphthylisothiocyanate-induced animal models: quantitative analysis of 22 bile acids by ultraperformance liquid chromatography-mass spectrometry. Chem Res Toxicol 2008;21:2280–8. [DOI] [PubMed] [Google Scholar]
- [25].Ascha M, Wang Z, Ascha MS, et al. Metabolomics studies identify novel diagnostic and prognostic indicators in patients with alcoholic hepatitis. World J Hepatol 2016;8:499–508. [DOI] [PMC free article] [PubMed] [Google Scholar]
- [26].Perez MJ, Briz O. Bile-acid-induced cell injury and protection. World J Gastroenterol 2009;15:1677–89. [DOI] [PMC free article] [PubMed] [Google Scholar]
- [27].Sharma R, Majer F, Peta VK, et al. Bile acid toxicity structure-activity relationships: correlations between cell viability and lipophilicity in a panel of new and known bile acids using an oesophageal cell line (HET-1A). Bioorg Med Chem 2010;18:6886–95. [DOI] [PubMed] [Google Scholar]
- [28].Eloranta JJ, Kullak-Ublick GA. The role of FXR in disorders of bile acid homeostasis. Physiology (Bethesda) 2008;23:286–95. [DOI] [PubMed] [Google Scholar]
- [29].Jeffcoat R. Obesity - a perspective based on the biochemical interrelationship of lipids and carbohydrates. Med Hypotheses 2007;68:1159–71. [DOI] [PubMed] [Google Scholar]
- [30].Tan Y, Yin P, Tang L, et al. Metabolomics study of stepwise hepatocarcinogenesis from the model rats to patients: potential biomarkers effective for small hepatocellular carcinoma diagnosis. Mol Cell Proteomics 2012;11:M111 010694. [DOI] [PMC free article] [PubMed] [Google Scholar]
- [31].Xiao JF, Varghese RS, Zhou B, et al. LC-MS based serum metabolomics for identification of hepatocellular carcinoma biomarkers in Egyptian cohort. J Proteome Res 2012;11:5914–23. [DOI] [PMC free article] [PubMed] [Google Scholar]
- [32].Allen K, Jaeschke H, Copple BL. Bile acids induce inflammatory genes in hepatocytes: a novel mechanism of inflammation during obstructive cholestasis. Am J Pathol 2011;178:175–86. [DOI] [PMC free article] [PubMed] [Google Scholar]
- [33].Yang J, Zhao X, Liu X, et al. High performance liquid chromatography-mass spectrometry for metabonomics: potential biomarkers for acute deterioration of liver function in chronic hepatitis B. J Proteome Res 2006;5:554–61. [DOI] [PubMed] [Google Scholar]
- [34].Goetzl EJ. Pleiotypic mechanisms of cellular responses to biologically active lysophospholipids. Prostaglandins Other Lipid Mediat 2001;64:11–20. [DOI] [PubMed] [Google Scholar]
- [35].Ma X, Chi YH, Niu M, et al. Metabolomics coupled with multivariate data and pathway analysis on potential biomarkers in cholestasis and intervention effect of paeonia lactiflora Pall. Front Pharmacol 2016;7:14. [DOI] [PMC free article] [PubMed] [Google Scholar]
- [36].Aoki M, Konya Y, Takagaki T, et al. Metabolomic investigation of cholestasis in a rat model using ultra-performance liquid chromatography/tandem mass spectrometry. Rapid Commun Mass Spectrom 2011;25:1847–52. [DOI] [PubMed] [Google Scholar]
- [37].Woolbright BL, Dorko K, Antoine DJ, et al. Bile acid-induced necrosis in primary human hepatocytes and in patients with obstructive cholestasis. Toxicol Appl Pharmacol 2015;283:168–77. [DOI] [PMC free article] [PubMed] [Google Scholar]
- [38].Zhang T, Zhao C, Luo L, et al. High concentraction of taurocholic acid induced apoptosis in HTR-8/SVneo cells via overexpression of ERp29 and activation of p38. Placenta 2014;35:496–500. [DOI] [PubMed] [Google Scholar]
- [39].Li T, Apte U. Bile acid metabolism and signaling in cholestasis, inflammation, and cancer. Adv Pharmacol 2015;74:263–302. [DOI] [PMC free article] [PubMed] [Google Scholar]
- [40].Hofmann AF. The continuing importance of bile acids in liver and intestinal disease. Arch Intern Med 1999;159:2647–58. [DOI] [PubMed] [Google Scholar]


