Abstract
Background:
To our knowledge, so far, no studies have comprehensively examined the performance of 2-point and 3-point point-of-care compression ultrasound (POCUS) in the diagnosis of lower extremity deep vein thrombosis (DVT). The aim of this meta-analysis was to compare the performance of 2-point and 3-point POCUS techniques for the diagnosis of DVT and evaluate the false-negative rate of each POCUS method.
Methods:
A computerized search of the PubMed, EMBASE, and Cochrane library databases was performed to identify relevant original articles. Bivariate modeling and hierarchical summary receiver operating characteristic modeling were performed to compare the diagnostic performance of 2-point and 3-point POCUS. The pooled proportions of the false-negative rate for each POCUS method were assessed using a DerSimonian–Laird random-effects model. Meta-regression analyses were performed according to the patient and study characteristics.
Results:
Seventeen studies from 16 original articles were included (2-point, 1337 patients in 9 studies; 3-point, 1035 patients in 8 studies). Overall, 2-point POCUS had similar pooled sensitivity [0.91; 95% confidence interval (95% CI), 0.68–0.98; P = .86) and specificity (0.98; 95% CI, 0.96–0.99; P = .60) as 3-point POCUS (sensitivity, 0.90; 95% CI, 0.83–0.95 and specificity, 0.95; 95% CI, 0.83–0.99). The false-negative rates of 2-point (4.0%) and 3-point POCUS (4.1%) were almost similar. Meta-regression analysis showed that high sensitivity and specificity tended to be associated with an initial POCUS performer (including attending emergency physician > only resident) and separate POCUS training for DVT (trained > not reported), respectively.
Conclusion:
Both 2-point and 3-point POCUS techniques showed excellent performance for the diagnosis of DVT. We recommend that POCUS-trained attending emergency physicians perform the initial 2-point POCUS to effectively and accurately diagnose DVT.
Keywords: deep vein thrombosis, emergency physician, lower extremity, meta-analysis, point-of-care ultrasound
1. Introduction
Lower extremity deep venous thrombosis (DVT) is a life-threatening vascular condition that affects adults of all ages and has an annual incidence of 0.1%.[1] Accurate and fast diagnosis of the DVT in the emergency department (ED) is crucial because one-third of untreated DVTs may clinically progress to significant pulmonary embolism.[2] As DVT is difficult to diagnose clinically, imaging is required for its diagnosis.[3]
Although the gold standard for the diagnosis of DVT is contrast venography, point-of-care compression ultrasound (POCUS) is increasingly used in the ED for evaluation of lower extremity DVT.[4,5] POCUS is listed as one of the core emergency ultrasonographic applications in the most-recent emergency ultrasonographic guidelines of the American College of Emergency Physicians.[6] In addition, previous meta-analyses reported excellent diagnostic performance of POCUS for the diagnosis of DVT.[4,5]
Thus far, 2 kinds of POCUS techniques have been used for the diagnosis of DVT. The 2-point POCUS technique, which tests the compressibility of the common femoral vein (CFV) and the popliteal vein (PV), has been commonly used.[7–10] The other technique is 3-point POCUS, which tests the compressibility of the CFV, superficial femoral vein (SFV), and PV, as well as detects isolated SFV thrombosis of lower extremity DVT.[11,12]
However, to our knowledge, so far, no studies have comprehensively examined the performance of 2-point and 3-point POCUS in the diagnosis of lower extremity DVT. In addition, the data regarding the diagnostic performance of the 2-point and 3-point POCUS techniques have revealed broad ranges of sensitivity and specificity, making it important to thoroughly analyze and compare the currently available data on the diagnostic performance of these techniques for DVT. Such high-level evidence would be particularly interesting to critical care physicians including emergency physicians and radiologists, as the study characteristics and methodological settings differed widely among previous studies.
This meta-analysis aimed to assess the pooled performance, compare the performance, and evaluate and compare the false-negative rates of the 2-point and 3-point POCUS techniques for the diagnosis of DVT.
2. Methods
This meta-analysis followed the revised guidelines of the Preferred Reporting Items for Systematic Reviews and Meta-Analyses of Diagnostic Accuracy Studies (PRISMA-DTA) statement.[13] Institutional review board approval was waived because the nature of our study was a systemic review and meta-analysis.
2.1. Data sources
The PubMed and EMBASE databases were searched up to September 1, 2018, to identify English-language studies on 2-point and 3-point POCUS for diagnosing DVT. And then, the Cochrane library database was searched for additional articles that did not exist in PubMed and EMBASE databases. The search terms “lower extremity,” “deep vein thrombosis,” or “ultrasound” were combined with “diagnosis,” “sensitivity,” “specificity,” or “receiver operating characteristic” as follows: ((“lower extremity”) OR (“lower limb”) OR (leg)) AND ((“deep vein thrombosis”) OR (“DVT”)) AND ((ultrasound) OR (ultrasonography) OR (sonography)) AND ((compression) OR (“point-of-care”) OR (“point of care”) OR (“POCUS”) OR (bedside)) AND ((diagnosis) OR (sensitivity) OR (specificity) OR (receiver operating characteristic) OR (ROC curve)). The bibliographies of the identified articles were screened to identify additional relevant studies. Two investigators screened the titles and abstracts for potential eligibility, and any disagreements were resolved through discussion.
2.2. Study selection
We included studies that fulfilled the following criteria: patients with suspected DVT; 2-point (CFV and PV) or 3-point (CFV, SFV, and PV) POCUS performed by an emergency physician as the index test; use of contrast venography, follow-up, or additional US performed by a radiologist as the reference standard for DVT; availability of sufficient information to reconstruct 2 × 2 contingency tables regarding sensitivity and specificity; and original research article as the publication type.
The exclusion criteria were as follows: case report or case series; review articles, guidelines, consensus statements, letters, editorials, clinical trials, and conference abstracts; studies not pertaining to the field of interest; studies using duplex US as the index test; POCUS not performed by an emergency physician; and studies with different definitions of the 3-point POCUS (e.g., CFV, PV, and greater saphenous vein).
2.3. Data extraction and quality assessment
Two investigators independently extracted data on the patient and study characteristics. The same investigators evaluated the methodological quality using the Quality Assessment of Diagnostic Accuracy Studies-2 (QUADAS-2) tool.[14] Any disagreement between the reviewers was resolved through discussion.
A standardized form was used to extract data on patient characteristics (number of patients, DVT proportion, mean age, age range, and sex), study characteristics (study location, publication year, study design, reference standard, and blinding to the reference standard), and POCUS characteristics (technical parameters and interpretive characteristics). The study outcomes were extracted to create the 2 × 2 tables (i.e., true-positive, true-negative, false-positive, and false-negative results). The 2 × 2 tables were obtained using the Bayesian method (data were back-calculated based on prevalence and sample size) if only sensitivity and specificity were presented in an eligible study. If 2 or more reviewers independently assessed the diagnostic accuracy, the result with the highest accuracy was extracted.
2.4. Data synthesis and analysis of the diagnostic performance
The patient demographic characteristics and extracted covariates were summarized using standard descriptive statistics. If available, the studies were stratified using vertebral compression fracture analysis. Continuous variables were expressed as means and 95% confidence intervals (95% CIs), whereas categorical variables were expressed as frequencies or percentages, unless stated otherwise.
We used a bivariate random-effects model for analyzing and pooling the diagnostic performance (sensitivity and specificity) measurements across studies. To derive summary estimates of the diagnostic performance, we plotted estimates of the observed sensitivities and specificities for each test in forest plots and hierarchical summary receiver operating characteristics (HSROC) curves derived from individual study results.[15–17] These results were plotted using HSROC curves with 95% confidence and prediction regions.
Heterogeneity was determined using Cochran Q test (P < .05 indicated the presence of heterogeneity) and the I2 test (0–40%, possibly no heterogeneity; 30–60%, moderate heterogeneity; 50–90%, substantial heterogeneity; and 75–100%, considerable heterogeneity).[18] When heterogeneity was noted, heterogeneity according to a “threshold effect” was analyzed by visual assessment of the coupled forest plots of sensitivity and specificity. A meta-analysis of diagnostic test accuracy studies simultaneously evaluates a pair of outcomes (i.e., sensitivity and specificity). Sensitivity and specificity are commonly inversely correlated and influenced by the threshold (cut-off) value.[15–17] In addition, Spearman correlation coefficient between the sensitivity and false-positive rate was calculated to determine any threshold effect; a coefficient >0.6 was considered to indicate a considerable threshold effect.[19] We omitted Deeks funnel plot[20] of individual studies to test for publication bias according to the PRISMA-DTA.
2.5. Analysis of the false-negative rate
For analyzing the false-negative rate, the meta-analytic pooling was based on the inverse variance method for calculating weights, and the unadjusted pooled proportions and their 95% CIs were determined using the DerSimonian–Laird random-effect model.[15–17] Publication bias-adjusted pooled estimates (i.e., adjusted pooled proportions) were calculated using the trim-and-fill method.[21] If there was agreement between the unadjusted and adjusted pooled proportions, we considered the results to be robust against publication bias.
2.6. Meta-regression analysis
Meta-regression analyses using several covariates were performed to explore the potential causes of heterogeneity: study location (United States vs other countries), total patients (≥100 vs <100), proportion of DVT (≥25% vs <25%), proportion of male patients (≥50% vs <50%), initial POCUS performer (including attending emergency physician vs only resident), and separate POCUS training for DVT (trained vs not reported)
All statistical analyses were performed by 1 author with 3 years of experience performing systematic reviews and meta-analyses. The statistical analyses were performed using the “midas” and “metandi” modules in Stata software (version 10.0; StataCorp LP, College Station, TX) and the “mada” ad “metafor” packages in R software (version 3.4.1; R Foundation for Statistical Computing, Vienna, Austria). Results were considered statistically significant at a P value < .05.
3. Results
3.1. Literature
Figure 1 shows a flow diagram summarizing the literature search. During the initial search, 166 studies were identified. Additional articles were not found in Cochrane library database. After removing 34 duplicates, we reviewed 132 titles and abstracts and excluded 109 studies for the following reasons: case reports, letters, editorials, and conference abstracts (n = 21); review articles, guidelines, and consensus statements (n = 20); and not in the field of interest (n = 68). After reviewing the full text of 23 eligible articles, we excluded 7 studies for the following reasons: use of duplex US as index test (n = 4),[7,22–24] POCUS not performed by an emergency physician (n = 2),[25,26] and different definition of the 3-point POCUS (n = 1).[27] Ultimately, 16 original research articles,[8–12,28–38] including a total of 2372 patients, were included in the meta-analysis. One of them[38] evaluated the diagnostic performance of 2-point and 3-point POCUS using different 2 cohorts (2 diagnostic performance studies in 1 article); thus, we evaluated 17 studies from the final 16 original research articles. Among them, 9 studies[8–10,29,30,33,34,37,38] evaluated the performance of the 2-point POCUS for diagnosing DVT, and 8 studies[11,12,28,31,32,35,36,38] evaluated the performance of the 3-point POCUS for diagnosing DVT.
Figure 1.
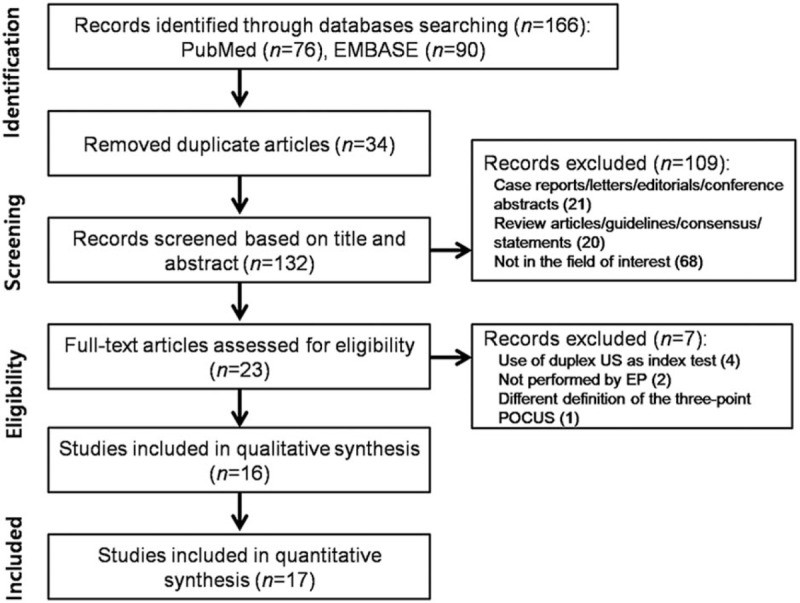
The study selection process for the meta-analysis. EP = emergency physician, POCUS = point-of-care ultrasound, US = ultrasound.
3.2. Characteristics of the studies
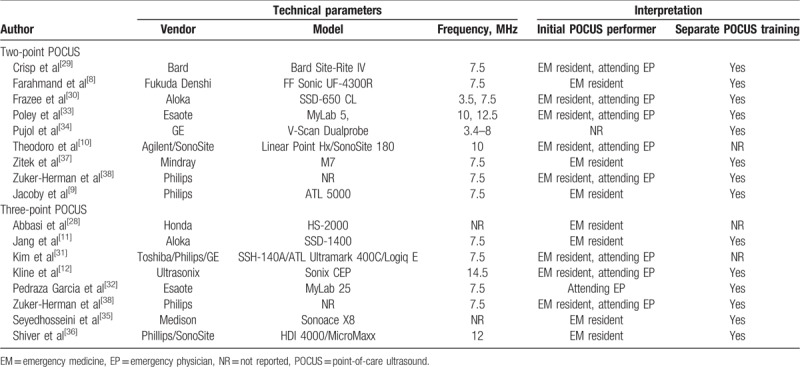
The patient characteristics are summarized in Table 1. The patient number in all studies ranged from 50 to 296 (mean age, 33–63.6 years). The mean proportion of men was 43% to 73%. The study and POCUS characteristics are summarized in Tables 2 and 3, respectively. All studies were prospectively designed with blinding from reference standards and performed consecutive patient recruitment. All studies, except one, were single-centered.[31] Fifteen studies from 14 articles[8–10,12,28–35,37,38] used follow-up or additional US by radiologists as the reference standard, whereas 2 studies[11,36] used contrast venography as the reference standard.
Table 1.
The included patients’ demographic characteristics.
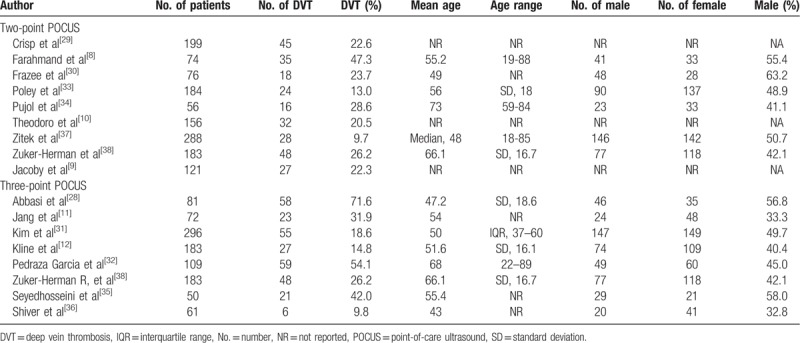
Table 2.
Characteristics of the included studies.
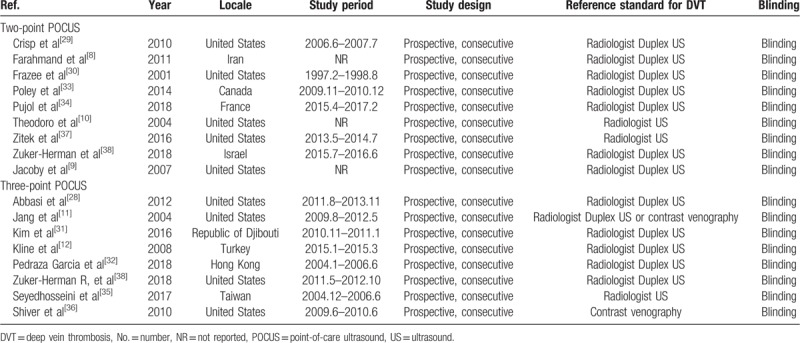
Table 3.
Technical parameters and interpretative characteristics of the included studies.
In all studies, DVT was defined as noncompressible or no visualized veins at one or more target points. Absence of DVT was defined as visualization of the complete (anterior-to-posterior) obliteration of the veins.
3.3. Quality assessment
Figure 2 shows the risk of bias and applicability concerns for the 17 included studies. Overall, no studies were considered to be seriously flawed according to the QUADAS-2 tool. All the studies satisfied ≥4 of the 7 items.
Figure 2.
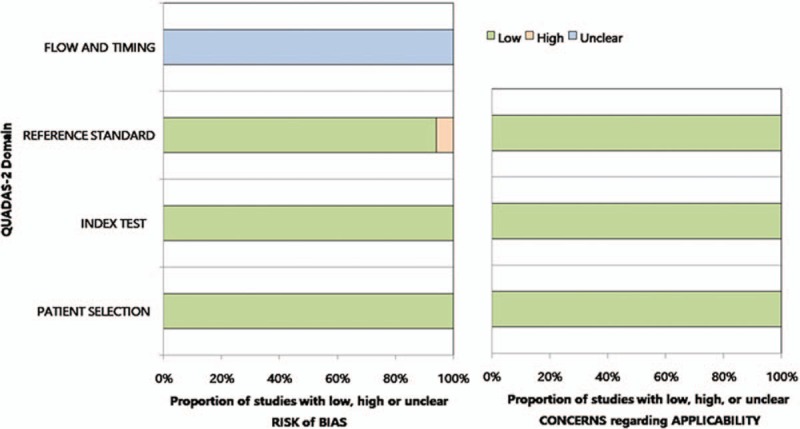
Grouped bar charts showing the risk of bias (left) and applicability concerns (right) for the 17 included studies, using the Quality Assessment of Diagnostic Accuracy Studies-2 domains.
Regarding the patient selection and index test domains, all studies were considered to have a low risk of bias. One study[11] was considered to have a high risk of bias about the reference standard because it used 2 modalities for reference standard (US or contrast venography). Regarding the flow and timing domains, all studies had an unclear risk of bias because the mean interval between POCUS and the reference standard was not reported. All studies exhibited low applicability to our research question in the patient selection, index test, and reference standard domains.
3.4. Performance of 2-point and 3-point POCUS for the diagnosis of DVT
For 2-point POCUS, the pooled sensitivity and specificity were 0.91 (95% CI, 0.68–0.98) and 0.98 (95% CI, 0.96–0.99), respectively. The Q test revealed significant heterogeneity (Q = 8.369, P = .008). Sensitivity (I2 = 87.64%) and specificity (I2 = 73.41%) indicated considerable and substantial heterogeneity, respectively. A threshold effect was shown by visual analysis of the coupled forest plot of sensitivity and specificity (Fig. 3) as well as a corresponding correlation coefficient of 0.103 (95% CI, –0.342 to 0.456) between sensitivity and the false-positive rate. The area under the HSROC curve was 0.99 (95% CI, 0.97–0.99; Fig. 4).
Figure 3.
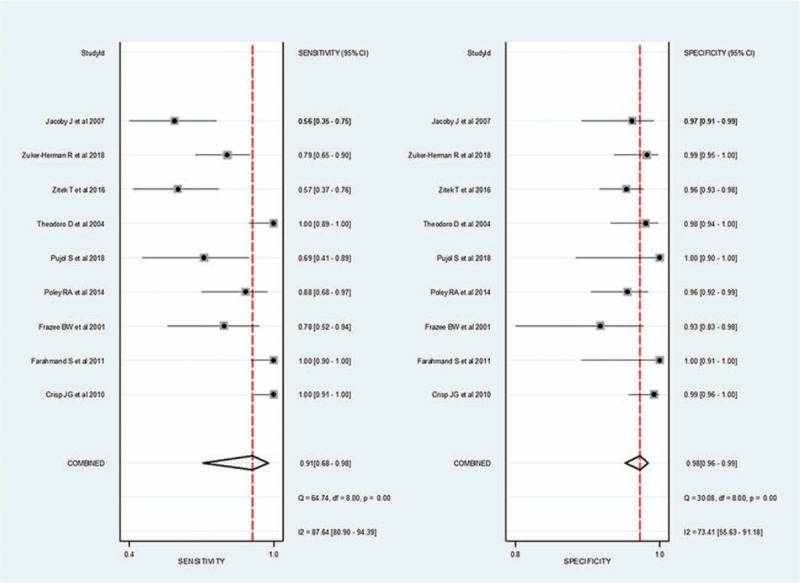
Coupled forest plots for the pooled sensitivity and specificity of 2-point point-of-care ultrasound for the diagnosis of deep vein thrombosis. Dots in squares represent sensitivity and specificity. Horizontal lines represent the 95% confidence interval (CI) for each included study. The combined estimate (“Summary”) is based on the random-effects model and is indicated using diamonds. Corresponding heterogeneities (I2) with 95% CIs are provided in the bottom right corners: I2 = 100% × (Q – df)/Q, where Q is Cochran heterogeneity statistic and df is the degrees of freedom.
Figure 4.
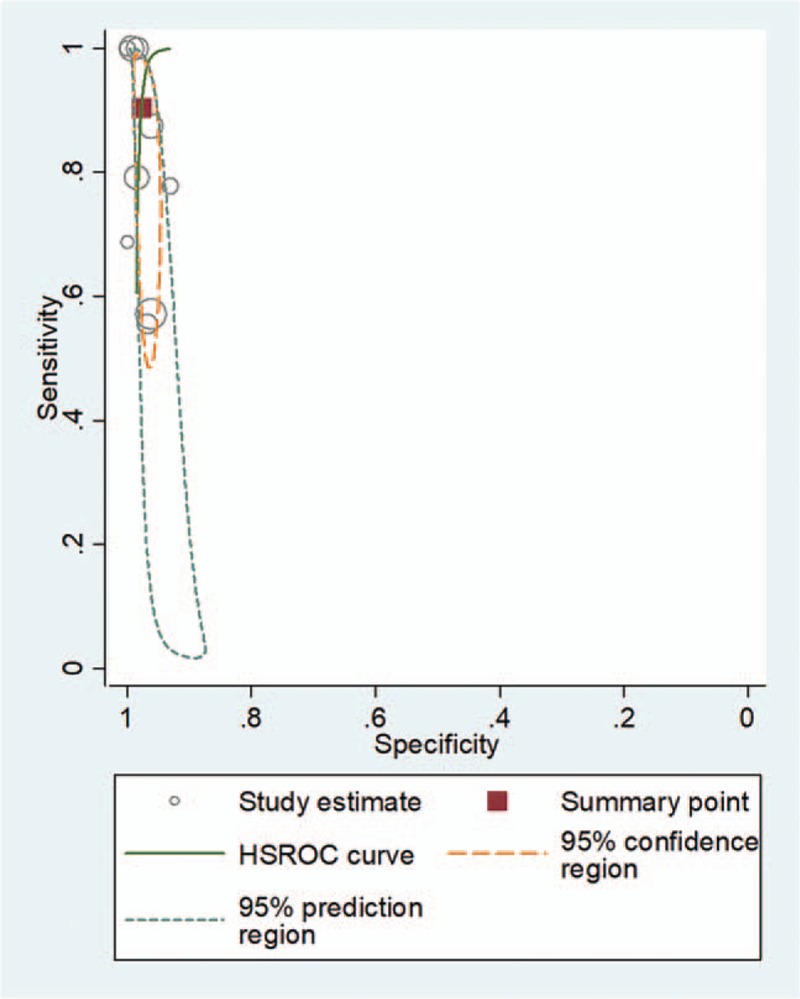
Hierarchical summary receiver operating characteristic (HSROC) curve for using 2-point point-of-care ultrasound for the diagnosis of deep vein thrombosis. The summary point (red box) indicates that the summary sensitivity was 0.84 (95% CI: 0.72–0.92) and the summary specificity was 0.91 (95% CI: 0.85–0.95). The 95% confidence region represents the 95% CIs of summary sensitivity and specificity, and the 95% prediction region represents the 95% CIs of sensitivity and specificity for each included study. The study estimates indicate the sensitivity and specificity estimated using the data from each study. The size of the marker is scaled according to the total number of patients in each study.
For 3-point POCUS, the pooled sensitivity and specificity were 0.90 (95% CI, 0.83–0.95) and 0.95 (95% CI, 0.83–0.99), respectively. The Q test revealed significant heterogeneity (Q = 18.264, P < .01). Sensitivity (I2 = 77.21%) and specificity (I2 = 94.19%) indicated substantial and considerable heterogeneity, respectively. A threshold effect was shown by visual analysis of the coupled forest plot of sensitivity and specificity (Fig. 5) as well as by a corresponding correlation coefficient of 0.091 (95% CI, –0.648 to 0.656) between sensitivity and false-positive rate. The area under the HSROC curve was 0.96 (95% CI, 0.94–0.97; Fig. 6).
Figure 5.
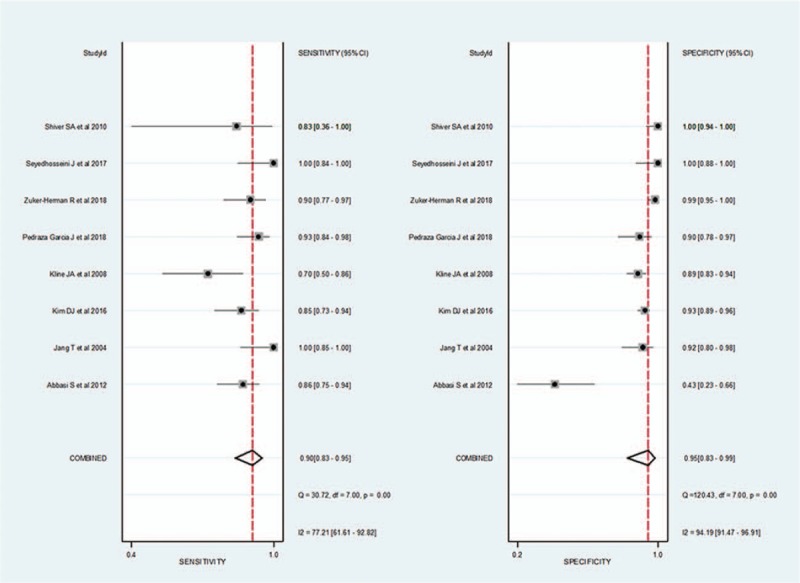
Coupled forest plots of pooled sensitivity and specificity of 3-point point-of-care ultrasound for the diagnosis of deep vein thrombosis. Dots in squares represent sensitivity and specificity. Horizontal lines represent the 95% confidence interval (CI) for each included study. The combined estimate (“Summary”) is based on the random-effects model and is indicated using diamonds. Corresponding heterogeneities (I2) with 95% CIs are provided in the bottom right corners.
Figure 6.
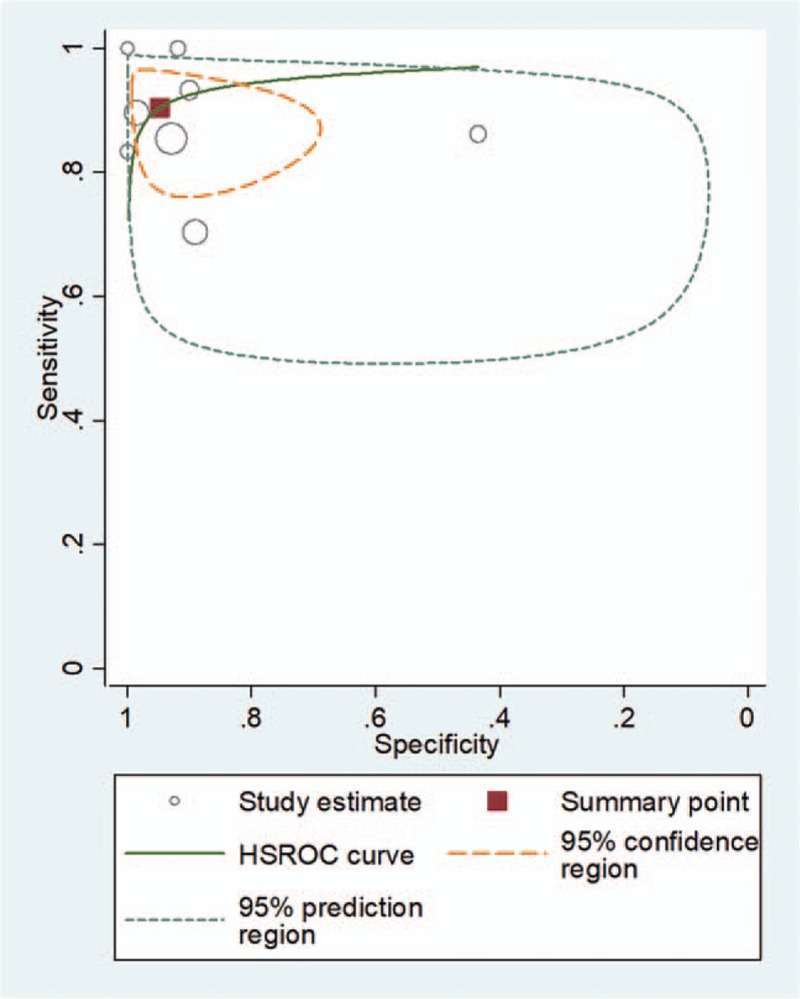
Hierarchical summary receiver operating characteristic (HSROC) curve for using 3-point point-of-care ultrasound for the diagnosis of deep vein thrombosis. The summary point (red box) indicates that the summary sensitivity was 0.95 (95% CI: 0.75–0.99) and the summary specificity was 0.95 (95% CI: 0.85–0.98). The 95% confidence region represents the 95% CIs of summary sensitivity and specificity, and the 95% prediction region represents the 95% CI of sensitivity and specificity for each included study.
3.5. Comparison of the diagnostic performance of 2-point and 3-point POCUS techniques
In a comparison of the overall diagnostic performance between 2-point and 3-point POCUS, the sensitivity (P = .86) and specificity (P = .60) were not significantly different.
3.6. False-negative rate of the 2-point and 3-point POCUS techniques
The forest plots for the false-negative rates of the 2-point POCUS demonstrated a pooled proportion of 4.0% (95% CI, 2.3–5.9; Fig. 7). After adjusting for publication bias using the trim-and-fill approach, the adjusted pooled proportion was 4.2% (95% CI, 2.7–6.7), which was in perfect agreement with the unadjusted pooled estimates.
Figure 7.
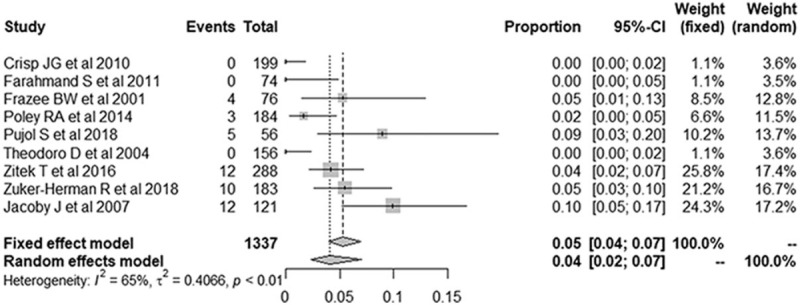
Forest plots of the false-negative rate of the 2-point point-of-care ultrasound for the diagnosis of deep vein thrombosis. Numbers are pooled estimates with 95% confidence intervals (95% CIs) in parentheses. Horizontal lines indicate 95% CIs, and the black box on each line indicates the standardized mean difference for each study. The black diamond at the bottom of the plot indicates the average effect size of the included studies.
The forest plots for false-negative rates of the 3-point POCUS demonstrated a pooled proportion of 4.1% (95% CI, 2.3–7.0; Fig. 8). After adjusting for publication bias using the trim-and-fill approach, the adjusted pooled proportion was 4.4% (95% CI, 3.0–7.7), which was in perfect agreement with the unadjusted pooled estimates.
Figure 8.
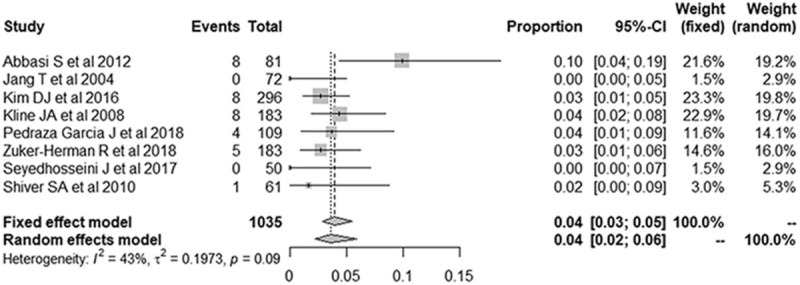
Forest plots of the false-negative rate of the 3-point point-of-care ultrasound for the diagnosis of deep vein thrombosis. Numbers are pooled estimates with 95% confidence intervals (95% CIs) in parentheses. Horizontal lines indicate 95% CIs, and the black box on each line indicates the standardized mean difference for each study. The black diamond at the bottom of the plot indicates the average effect size of the included studies.
3.7. Meta-regression analysis results
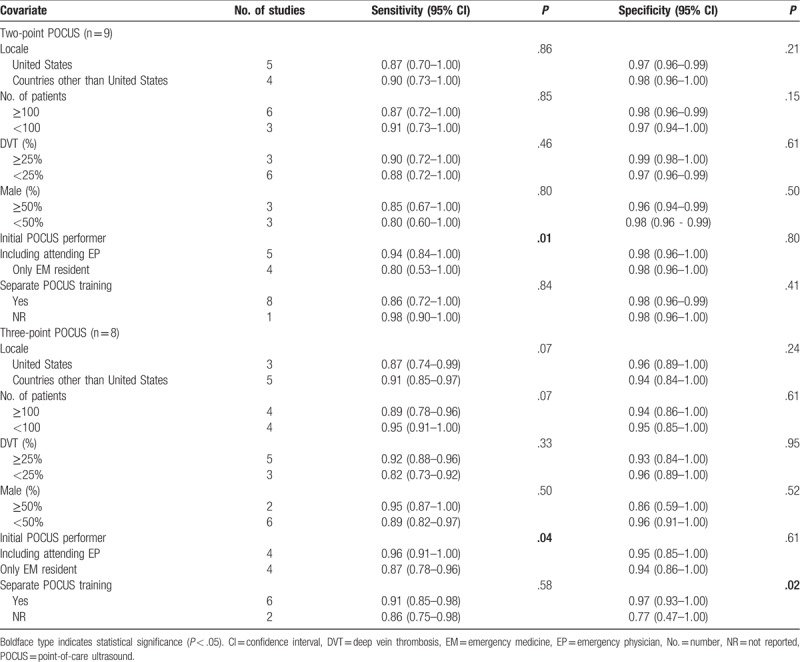
The results of the meta-regression analyses showed that the only significant source of heterogeneity in sensitivity was the initial POCUS performer (2-point, P = .01; 3-point, P = .04), with higher sensitivity reported in studies with an attending emergency physician and resident than in those with only a resident (Table 4). The significant sources of heterogeneity in specificity were the presence of the separate POCUS training (3-point, P = .02), with higher specificity reported in studies with a definite description of the POCUS training than in those without such a description. Other factors, including study locale, total patient number, proportion of DVT, and proportion of male were not significantly different (2-point, P = .15–.86; 3-point, P = .07–.95).
Table 4.
Meta-regression analyses for potential source of the heterogeneity.
4. Discussion
The present meta-analysis revealed that 2-point POCUS (sensitivity: 91%, specificity: 98%) and 3-point POCUS (sensitivity: 90%, specificity: 95%) were excellent methods for the diagnosis of DVT. There was no significant difference in the diagnostic performance between the 2 methods. Moreover, the pooled proportions of the false-negative rate of the 2-point POCUS (4.0%) and 3-point POCUS (4.1%) were almost similar.
The present study focused on the diagnostic performance of POCUS. The most-recent emergency US guidelines of the American College of Emergency Physicians[6] demonstrated that the POCUS is the core technique for diagnosing DVT in clinical practice. Comparison of the 2 POCUS techniques is important because of the uncertainty regarding which POCUS method is more accurate and effective in the ED. Generally, 2-point POCUS is less time-consuming than 3-point POCUS; thus, we believe that the 2-point POCUS is more useful for diagnosing DVT. We also evaluated the pooled proportion of the false-negative rate of each POCUS method. Due to the high mortality rate of DVT, the false-negative rate is as important as the accuracy. In our meta-analysis, the false-negative rates of the 2 POCUS methods were almost the same (approximately 4%). We believe the effect of the isolated SFV thrombosis in 2-point POCUS was minimal. In addition, we evaluated the meta-regression analysis. It is possible that the POCUS-trained emergency physician's awareness of the specific point of tenderness provided better sensitivity and specificity.
The current meta-analysis differs from the previous meta-analyses on POCUS in many aspects. Although the 2 previous meta-analyses[4,5] evaluated the diagnostic performance of US for DVT, they had several limitations. First, although they[4,5] evaluated the diagnostic performance of the heterogenous US methods (2-point POCUS, 3-point POCUS, and extended CUS, etc, with or without color Doppler), the studies were not divided and compared. Second, the studies did not perform a thorough analysis of the potential sources of heterogeneity, as they did not distinguish between sensitivity and specificity for the covariates’ effects, which precluded any recommendations regarding methods to increase the diagnostic performance of POCUS for DVT. Third, one of the previous studies[4] did not use a hierarchical model (e.g., the bivariate model and the HSROC model), which is a recommended statistical tool for the meta-analysis of studies on diagnostic accuracy. Finally, the 2 × 2 table evaluation when 2 or more reviewers independently assess the diagnostic accuracy remains unclear. In our meta-analysis, the result with the highest accuracy was extracted.
Our meta-regression analysis revealed that the initial POCUS performer and receipt of separate POCUS training before the study were sources of heterogeneity. In particular, the pooled sensitivity was higher in studies including the attending emergency physician than in studies including only the resident. In addition, the pooled specificity was higher in studies that included POCUS training for DVT before the study. Thus, we recommend that POCUS-trained attending emergency physicians perform the initial US for accurate diagnosis of DVT.
The present study has several limitations. First, we included a relatively small number of included studies. Nevertheless, we were able to draw several important conclusions regarding the diagnostic performance of 2-point and 3-point POCUS and related factors, which we believe provides a useful overview owing to the broad search terms used and inclusion of only easily accessible studies (published in English and available in the PubMed and EMBASE databases). Second, all included studies revealed positive results, which could be attributed to a publication bias; however, such a bias cannot be quantified. Although we omitted Deeks funnel plots according to the PRISMA-DTA guidelines, we observed a low probability of publication bias (2-point, P = .38; 3-point, P = .77), which suggests that this factor did not undermine our results. Third, there were methodological differences between the included studies, and the extensive meta-regression analysis revealed that these variables were significant sources of heterogeneity. This methodological diversity might affect the pooled estimates, especially as the POCUS technical parameters were not assessed in the meta-regression analysis because not all studies reported the values for gain, dynamic range, and mechanical index. Fourth, we only examined studies wherein the diagnostic performance of the 2-point and 3-point POCUS techniques was based on conclusive cases, as the eligible studies did not include cases with equivocal or inconclusive findings. Fifth, almost studies using 2-point and 3-point POCUS emphasized its diagnostic performance alone and did not compare it to other modalities. Thus, a future comprehensive study with a larger sample size that includes equivocal and inconclusive cases and more advanced methodology (e.g., comparison to computed tomography venography or magnetic resonance venography) may be needed to confirm the usefulness of 2-point and 3-point POCUS techniques as initial diagnostic tools in routine clinical practice and determine the optimal parameters for POCUS.
In summary, the present meta-analysis revealed that both 2-point and 3-point POCUS showed excellent performance for the diagnosis of DVT. The effect of the isolated SFV thrombosis in 2-point POCUS was minimal. We recommend that POCUS-trained attending emergency physicians perform the initial 2-point POCUS to effectively and accurately diagnose DVT.
Author contributions
Conceptualization: Sun Hwa Lee, Seong Jong Yun.
Data curation: Sun Hwa Lee, Seong Jong Yun.
Formal analysis: Sun Hwa Lee, Seong Jong Yun.
Methodology: Ju Hyung Lee, Seong Jong Yun.
Validation: Seong Jong Yun.
Writing – original draft: Sun Hwa Lee.
Writing – review & editing: Ju Hyung Lee, Seong Jong Yun.
Footnotes
Abbreviations: CFV = common femoral vein, CI = confidence interval, DVT = deep vein thrombosis, ED = emergency department, HSROC = hierarchical summary receiver operating characteristics, POCUS = point-of-care compression ultrasound, PV = popliteal vein, QUADAS-2 = Quality Assessment of Diagnostic Accuracy Studies-2.
JHL and SHL contributed equally to this work.
All authors declare that they have no conflicts of interest.
References
- [1].White RH. The epidemiology of venous thromboembolism. Circulation 2003;10723 suppl 1:I4–8. [DOI] [PubMed] [Google Scholar]
- [2].Calder KK, Herbert M, Henderson SO. The mortality of untreated pulmonary embolism in emergency department patients. Ann Emerg Med 2005;45:302–10. [DOI] [PubMed] [Google Scholar]
- [3].Goodacre S, Sutton AJ, Sampson FC. Meta-analysis: the value of clinical assessment in the diagnosis of deep venous thrombosis. Ann Intern Med 2005;143:129–39. [DOI] [PubMed] [Google Scholar]
- [4].Burnside PR, Brown MD, Kline JA. Systematic review of emergency physician-performed ultrasonography for lower-extremity deep vein thrombosis. Acad Emerg Med 2008;15:493–8. [DOI] [PubMed] [Google Scholar]
- [5].Pomero F, Dentali F, Borretta V, et al. Accuracy of emergency physician-performed ultrasonography in the diagnosis of deep-vein thrombosis: a systematic review and meta-analysis. Thromb Haemost 2013;109:137–45. [DOI] [PubMed] [Google Scholar]
- [6].Ultrasound guidelines: emergency, point-of-care and clinical ultrasound guidelines in medicine. Ann Emerg Med 2017;69:e27–54. [DOI] [PubMed] [Google Scholar]
- [7].Adhikari S, Zeger W, Thom C, et al. Isolated deep venous thrombosis: implications for 2-point compression ultrasonography of the lower extremity. Ann Emerg Med 2015;66:262–6. [DOI] [PubMed] [Google Scholar]
- [8].Farahmand S, Farnia M, Shahriaran S, et al. The accuracy of limited B-mode compression technique in diagnosing deep venous thrombosis in lower extremities. Am J Emerg Med 2011;29:687–90. [DOI] [PubMed] [Google Scholar]
- [9].Jacoby J, Cesta M, Axelband J, et al. Can emergency medicine residents detect acute deep venous thrombosis with a limited, two-site ultrasound examination? J Emerg Med 2007;32:197–200. [DOI] [PubMed] [Google Scholar]
- [10].Theodoro D, Blaivas M, Duggal S, et al. Real-time B-mode ultrasound in the ED saves time in the diagnosis of deep vein thrombosis (DVT). Am J Emerg Med 2004;22:197–200. [DOI] [PubMed] [Google Scholar]
- [11].Jang T, Docherty M, Aubin C, et al. Resident-performed compression ultrasonography for the detection of proximal deep vein thrombosis: fast and accurate. Acad Emerg Med 2004;11:319–22. [DOI] [PubMed] [Google Scholar]
- [12].Kline JA, O’Malley PM, Tayal VS, et al. Emergency clinician-performed compression ultrasonography for deep venous thrombosis of the lower extremity. Ann Emerg Med 2008;52:437–45. [DOI] [PubMed] [Google Scholar]
- [13].McInnes MDF, Moher D, Thombs BD, et al. Preferred reporting items for a systematic review and meta-analysis of diagnostic test accuracy studies: the PRISMA-DTA statement. JAMA 2018;319:388–96. [DOI] [PubMed] [Google Scholar]
- [14].Whiting PF, Rutjes AW, Westwood ME, et al. QUADAS-2: a revised tool for the quality assessment of diagnostic accuracy studies. Ann Intern Med 2011;155:529–36. [DOI] [PubMed] [Google Scholar]
- [15].Kim KW, Lee J, Choi SH, et al. Systematic review and meta-analysis of studies evaluating diagnostic test accuracy: a practical review for clinical researchers-Part I. General guidance and tips. Korean J Radiol 2015;16:1175–87. [DOI] [PMC free article] [PubMed] [Google Scholar]
- [16].Lee J, Kim KW, Choi SH, et al. Systematic review and meta-analysis of studies evaluating diagnostic test accuracy: a practical review for clinical researchers-Part II. Statistical methods of meta-analysis. Korean J Radiol 2015;16:1188–96. [DOI] [PMC free article] [PubMed] [Google Scholar]
- [17].Suh CH, Park SH. Successful publication of systematic review and meta-analysis of studies evaluating diagnostic test accuracy. Korean J Radiol 2016;17:5–6. [DOI] [PMC free article] [PubMed] [Google Scholar]
- [18].Higgins J, Green S. Cochrane Handbook for Systematic Reviews of Interventions. Version 5.1.0. The Cochrane Collaboration. Available at: http://handbook.cochrane.org/chapter_9/9_5_2_identifying_and_measuring_heterogeneity.htm Accessed November 1, 2018. [Google Scholar]
- [19].Deville WL, Buntinx F, Bouter LM, et al. Conducting systematic reviews of diagnostic studies: didactic guidelines. BMC Med Res Methodol 2002;2:9. [DOI] [PMC free article] [PubMed] [Google Scholar]
- [20].Deeks JJ, Macaskill P, Irwig L. The performance of tests of publication bias and other sample size effects in systematic reviews of diagnostic test accuracy was assessed. J Clin Epidemiol 2005;58:882–93. [DOI] [PubMed] [Google Scholar]
- [21].Duval S, Tweedie R. Trim and fill: a simple funnel-plot-based method of testing and adjusting for publication bias in meta-analysis. Biometrics 2000;56:455–63. [DOI] [PubMed] [Google Scholar]
- [22].Blaivas M, Lambert MJ, Harwood RA, et al. Lower-extremity Doppler for deep venous thrombosis: can emergency physicians be accurate and fast? Acad Emerg Med 2000;7:120–6. [DOI] [PubMed] [Google Scholar]
- [23].Magazzini S, Vanni S, Toccafondi S, et al. Duplex ultrasound in the emergency department for the diagnostic management of clinically suspected deep vein thrombosis. Acad Emerg Med 2007;14:216–20. [DOI] [PubMed] [Google Scholar]
- [24].Turnbull TL, Dymowski JJ, Zalut TE. A prospective study of hand-held Doppler ultrasonography by emergency physicians in the evaluation of suspected deep-vein thrombosis. Ann Emerg Med 1990;19:691–5. [DOI] [PubMed] [Google Scholar]
- [25].Chance JF, Abbitt PL, Tegtmeyer CJ, et al. Real-time ultrasound for the detection of deep venous thrombosis. Ann Emerg Med 1991;20:494–6. [DOI] [PubMed] [Google Scholar]
- [26].Kory PD, Pellecchia CM, Shiloh AL, et al. Accuracy of ultrasonography performed by critical care physicians for the diagnosis of DVT. Chest 2011;139:538–42. [DOI] [PubMed] [Google Scholar]
- [27].Crowhurst TD, Dunn RJ. Sensitivity and specificity of three-point compression ultrasonography performed by emergency physicians for proximal lower extremity deep venous thrombosis. Emerg Med Australas 2013;25:588–96. [DOI] [PubMed] [Google Scholar]
- [28].Abbasi S, Bolverdi E, Zare MA, et al. Comparison of diagnostic value of conventional ultrasonography by emergency physicians with Doppler ultrasonography by radiology physicians for diagnosis of deep vein thrombosis. J Pak Med Assoc 2012;62:461–5. [PubMed] [Google Scholar]
- [29].Crisp JG, Lovato LM, Jang TB. Compression ultrasonography of the lower extremity with portable vascular ultrasonography can accurately detect deep venous thrombosis in the emergency department. Ann Emerg Med 2010;56:601–10. [DOI] [PubMed] [Google Scholar]
- [30].Frazee BW, Snoey ER, Levitt A. Emergency Department compression ultrasound to diagnose proximal deep vein thrombosis. J Emerg Med 2001;20:107–12. [DOI] [PubMed] [Google Scholar]
- [31].Kim DJ, Byyny RL, Rice CA, et al. Test characteristics of emergency physician-performed limited compression ultrasound for lower-extremity deep vein thrombosis. J Emerg Med 2016;51:684–90. [DOI] [PubMed] [Google Scholar]
- [32].Pedraza Garcia J, Valle Alonso J, Ceballos Garcia P, et al. Comparison of the accuracy of emergency department-performed point-of-care-ultrasound (POCUS) in the diagnosis of lower-extremity deep vein thrombosis. J Emerg Med 2018;54:656–64. [DOI] [PubMed] [Google Scholar]
- [33].Poley RA, Newbigging JL, Sivilotti ML. Estimated effect of an integrated approach to suspected deep venous thrombosis using limited-compression ultrasound. Acad Emerg Med 2014;21:971–80. [DOI] [PubMed] [Google Scholar]
- [34].Pujol S, Laurent J, Markarian T, et al. Compression with a pocket-sized ultrasound device to diagnose proximal deep vein thrombosis. Am J Emerg Med 2018;36:1262–4. [DOI] [PubMed] [Google Scholar]
- [35].Seyedhosseini J, Fadavi A, Vahidi E, et al. Impact of point-of-care ultrasound on disposition time of patients presenting with lower extremity deep vein thrombosis, done by emergency physicians. Turk J Emerg Med 2018;18:20–4. [DOI] [PMC free article] [PubMed] [Google Scholar]
- [36].Shiver SA, Lyon M, Blaivas M, et al. Prospective comparison of emergency physician-performed venous ultrasound and CT venography for deep venous thrombosis. Am J Emerg Med 2010;28:354–8. [DOI] [PubMed] [Google Scholar]
- [37].Zitek T, Baydoun J, Yepez S, et al. Mistakes and pitfalls associated with two-point compression ultrasound for deep vein thrombosis. West J Emerg Med 2016;17:201–8. [DOI] [PMC free article] [PubMed] [Google Scholar]
- [38].Zuker-Herman R, Ayalon Dangur I, Berant R, et al. Comparison between two-point and three-point compression ultrasound for the diagnosis of deep vein thrombosis. J Thromb Thrombolysis 2018;45:99–105. [DOI] [PubMed] [Google Scholar]


