

Abstract
To investigate whether socioeconomic status is associated with the self-rated health (SRH) status among Chinese.
A cross sectional study including a national sample was conducted among Chinese adults in 2008. In total, 3225 participants were selected by a multistage cluster sampling method. Both general self-rated health and time-comparative self-rated health were measured by a standardized questionnaire. Logistic regression models were used to estimate the odds ratios (ORs) (95% confidence intervals, CIs) of occupation with SRH by occupation, and adjusted for age, sex, education, area, marriage, smoking, drinking, and health status.
Overall, 34.4% of study participants reported “good” on the general SRH (male: 35.8%; female: 32.9%) and 26.2% reported “good” on the time-comparative SRH (male: 27.2%; female: 25.3%). The prevalence of “good” general SRH varied from 28.8% to 52.8% and the prevalence of time-comparative SHR varied from 21.7% to 33.9% in different occupations. The adjusted OR (Odd Ratio) for “good” on the general SRH was 1.35 (95% CI: 1.20–1.52) for the occupation of civil servants, 2.23 (95% CI: 1.96–2.54) for farmers, and 1.15 (95%CI: 1.01–1.31) for businessmen. The full adjusted OR of “good” on the time-comparative SRH was 1.36 (95% CI: 1.17–1.58) for students and was 1.25 (95% CI: 1.10–1.42) for civil servants.
In presented study, 34.4% of the participants reported “good” on the general SRH, and 26.2% participants reported “good” on the time-comparative SRH. The prevalence of “good” general SRH and “good” time-comparative SRH varied among occupations.
Keywords: Chinese, self-rated health, socioeconomic status
1. Introduction
In many studies, socioeconomic status (SES) had been associated with differences in people's reported self-rated health[1–3] status. While many of the studies on self-related health status have been conducted in developed countries, the association between SES and self-rated health (SRH) does still vary across different countries.[4] Few studies have reported on SRH in developing countries, and where studies do exist in these contexts, the results are not consistent. For example, a Korean study found that poorer SRH cannot be entirely explained by the socioeconomic factors.[5] Whereas, a Thailand study found that income and education had little influence on SRH for females.[6] Since SES can be altered through prevention, intervention, and policy,[7] the variety of factors influencing SES and SRH should be further examined and considered within health disparities research.
In general, there are 3 indicators within the literature that are examined in relation to SES:
-
1.
occupation;
-
2.
education; and
-
3.
income.
Income may include wages, salaries, profits, or rent. For many Chinese people, wages/ salaries are only a part of their income, and it is relatively easy to obtain records of their wages/salaries. However, income is still a very sensitive topic in China and people are reluctant to disclose their income levels in surveys.[8] Thus, it is difficult to accurately estimate a participant's SES according to income and therefore it may be more reliable to use educational level in the Chinese context. Due to the challenges of using income and education, looking at people's occupation, functioned as a “bridge” to approximate SES in this study. In China, the occupation of a person is more related to the income than education level because the salary of most jobs is based on the job title rather than education level. Therefore, this better serves as an indicator of income in the current Chinese labor market. Further, occupational prestige is an important factor in SES; therefore, a particular occupation might be considered better and more prestigious than obtaining a particular “education” when examining SES. In 1999, China released the occupational classification system to provide guidance for occupational education and job qualification criteria for burgeoning industries. The occupational classification system was updated in 2015, but there was no change on the sub-group titles from the 1999 classification system. The classification has 8 sub-groups including 1838 occupations. The 8 sub-groups include: “civil servant”, “scholar/specialist”, “clerk/staff”, “businessmen”, “farmer”, “worker”, “solider”, and “others”.
The SRH is collected and categorized based on 3 criteria, the general/global SRH (In general terms, how would you describe your health?), age-comparative SRH (would you describe your health compared to others of your age and gender?), and time-comparative SRH (How would you describe your health as compared to 1 year ago?).[9] However, it is important to note that those 3 SRH categories are not direct measures of health outcomes and are self-reported measure of current health status. This must be taken into account when interpreting and applying the results of this study.[10] For example, Vuorisalmi et al reported that the age-comparative estimate does not measure an objective health condition in the same way for different age groups.[11] As a result, general SRH is more likely to be a valid measure of general self-reported health status, and a better predictor of future health, than the comparative measure.[11]
Although Xie et al conducted a study on SES-SRH relationship among Chinese,[12] the authors reported that there were no association between occupation and SRH, which was only evaluated by examining general SRH. However, Xie et al study did not address the time-comparative SRH in their study. A previous study found that the time-comparative SRH was curvilinear associated with physical health problems,[13] which means this measure may be useful to examine with under-represented populations. Hence, until now, there has not been a systematic study focusing on the relationship between occupation and SRH, and examination of both general SRH and time-comparative SRH among a Chinese population.
In this study, we examine the association between SES and self-rated health. We tested the following two hypotheses:
-
1.
general SRH varies amongst different occupations; and
-
2.
time-comparative SRH varies amongst different occupations.
2. Methods
The study cohort is reported elsewhere,[14] but briefly, the China Sub-optimal Health Survey (CSHS) was used for this study and was created in 2008 to understand the changing health status of China. The data was collected from January 2008 to July 2008 and the study was completed in January 2009. The CSHS selected individuals from 6 provinces to represent the 1.4 billion individuals in the nation's population. A multi-stage, random cluster sampling design was used to designate study subjects. All 31 provinces, or municipalities, were divided into 6 administrative regions: Northeast, North, East, Central South, Southwest, and Northwest. The regions of Jilin, Beijing, Jiangsu, Hubei, Sichuan, and Gansu were randomly selected to represent those 6 administrative regions. Each of the above randomly selected regions was divided into multiple urban and suburban regions. Then, 1 to 2 urban regions and 1 to 2 suburban regions were randomly selected to represent both the urban and suburban populations. Within those selected regions, residents including local college students, government staff, businessmen, farm workers, and other non-affiliated local residents were clustered and randomly selected as the sample population. Of the 19,665 participants selected to participate in the study, 18,631 completed the questionnaires (for a response rate of 94.7%). For this study, individuals were excluded who
-
1.
were less than 18 or greater than 65 years of age;
-
2.
had mental illnesses that could potentially affect feeling of SRH. After exclusion, 17,677 participants were included in the final analysis.
2.1. Ethics statement
This study was approved by the Institutional Review Board at Peking Union Medical College and followed the tenets of the Declaration of Helsinki. Written informed consent was obtained from all participants prior to data collection.
2.2. Data collection
All individuals in each randomly selected cluster unit were asked to complete a self- administered questionnaire. Data on demographic and personal characteristics were collected, including gender, age, marital status, education, smoking, drinking, and health information (medical history, illness and diseases that occurred during the last 12 months). Information on occupation was based on the classification system established by the Chinese labor law (as described above).
2.3. Self-rated health (SRH)
SRH was assessed by analyzing responses to the following questions included in the self-administered questionnaire:
-
1.
In general terms, how would you describe your health?
-
2.
How would you describe your health as compared to one year ago?
For these 2 questions, respondents were asked to use a Likert scale in their self-assessment and assess based on the following rating scale: 1 = very good, 2 = good, 3 = fair, 4 = poor, and 5 = very poor. This classification was consistent with what has been used in prior studies.[15,16]
2.4. Statistical analysis
Statistical analyses were carried out with Windows Statistical Software Package Version 8.0 (SAS Institute, Cary, NC). Occupations were analyzed as a categorical variable. Self-reported health (SRH) was categorized into two binary outcome variable groups: good and poor SRH. For this study, respondents who reported a “1” (very good) or “2” (good) were classified as having “good” SRH. Respondents who reported a “3” (fair), “4” (poor) or “5” (very poor) were all classified as having “poor” SRH.
The Chi-square tests were used to compare participants’ characteristics. Analysis of variance (ANOVA) was used to test the first hypothesis that body pain would vary according to occupation and education. The Tukey test was used to compare difference between the groups. Logistic regression model was applied to estimate the odds ratio and 95% CIs of SRH by occupations adjusted for potential confounders. Potential confounders considered, as outlined in Table 1, were: sex, age, education, area, marriage, smoking, drinking, and objective health status, (a significance level of .05 is required to allow the variable to enter the model). The variables were selected according to expert's suggestion and upon review of the literature.[12,17] The education level was categorized into 3 groups: literate or primary school, high school, and college or above. Health status was assessed based on self-reports of chronic illness including hypertension, diabetes, coronary heart disease, hyperlipidemia, hepatitis. Participants with any of the above chronic disease were labeled as “unhealthy.” Two sets of potential confounders were used in the adjusted models. Model 1 adjusted for sex and age and Model 2 additionally adjusted for education, area, marriage, smoking, drinking, and health status. All potential confounders are summarized in Table 1. All the tests were 2 sided and significance level was set at 0.05.
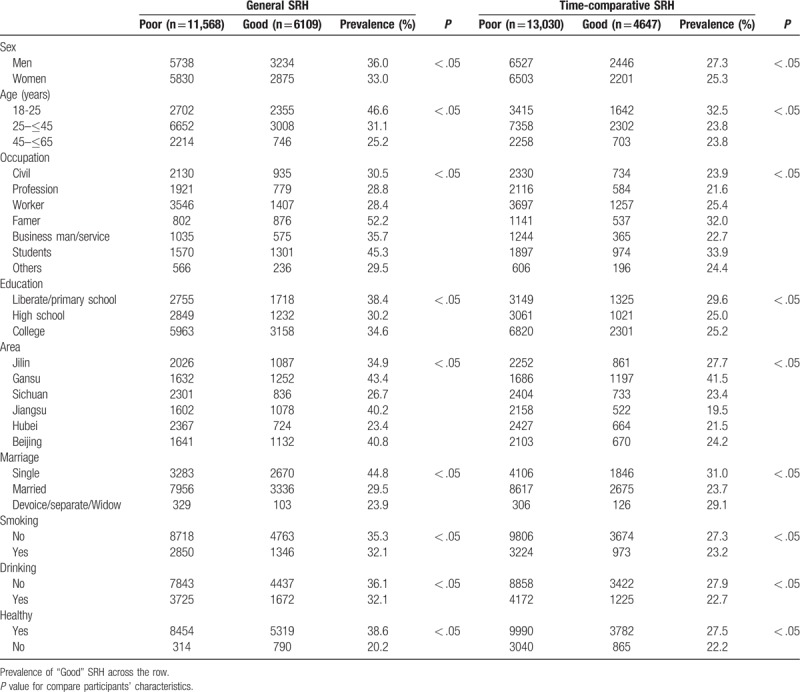
Table 1.
Participant characteristics and frequencies (in %) within SRH category.
3. Results
The study included a total of 17,677 Chinese adults from 6 provinces with a mean age of 33.1 (SD = 10.6). In the study sample, 50.79% were male and 49.21% were female. Overall, 34.6% of study participants reported “good” on general SRH (male: 36.0%; female: 33.0%) and 26.4% reported “good” on time-comparative SRH (male: 27.3%; female: 25.3%). The prevalence of “good” general SRH varied among participants with different occupations. For example, the prevalence of “good” general health among civil servants was 30.5%, it was 28.8% among professionals, 28.4% among blue collar workers, 52.2% among farmers, 35.7% among businessmen, 45.3% among students, and 29.5% among other occupations. The prevalence of time-comparative SHR varied by occupation, with the prevalence of time-comparative SHR among civil servants at 24.0%, it was 21.7% among professional, 25.4% among blue collar workers, 32.0% among farmers, 22.7% among businessmen, 33.9% among students, 24.4% and among other occupations.
3.1. Association between occupation and SRH
Table 2 shows the results of the logistic regression model controlling for age and sex, and the multiple logistic regression models used to examine the effects of different occupations on the association of SRH.
Table 2.
Multiple logistic regression models and the associations between occupations and SRH.
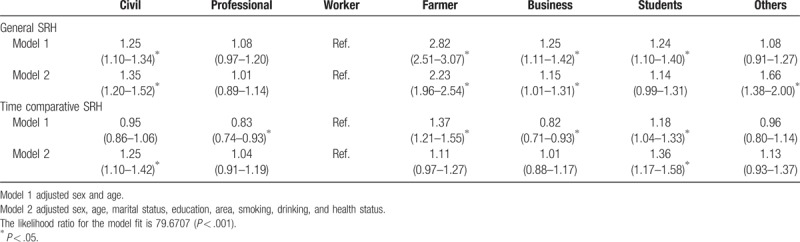
The crude OR for “good” general SRH is 1.25 (95% CI: 1.10–1.34) for civil service workers, 2.82 (95% CI: 2.51–3.07) for farmers, 1.24 (95%CI: 1.11–1.42) for businessmen, and 1.24 (95%CI: 1.10–1.40) for students, compared with blue collar workers. Additional adjustments based on education, area, marriage, smoking, drinking, and health status in Model 2 did not attenuate the effect of occupation for civil service (OR = 1.35; 95% CI: 1.20–1.52), farmers (OR = 2.23; 95% CI: 1.96–2.54), and businessmen (OR = 1.15, 95%CI: 1.01–1.31), but there was an attenuation of the effect of occupation for students (OR = 1.44; 95%CI: 0.99–1.31).
Similarly, the crude OR for time-comparative SRH is 0.83 (95%CI: 0.74–0.93) for professional workers, 1.37 (95%CI: 1.21–1.55) for farmers, 0.82 (95%CI: 0.71–0.93) for businessmen, and 1.18 (95%CI: 1.04–1.33) for students, compared with blue collar workers. Additional adjustments based on education, area, marriage, smoking, drinking, and health status in model 2 did not attenuate the effect of occupation for student (OR = 1.36; 95% CI: 1.17–1.58), but there was an attenuation of the effect of occupation for professional workers (OR = 1.04; 95% CI: 0.91–1.19), farmer (OR = 1.11; 95%CI: 0.97–1.27), and businessmen (OR = 1.01; 95%CI : 0.88–1.17). In model 2, the adjusted OR for time-comparative SRH is 1.25 (95% CI: 1.10–1.42) for civil servants compared with blue collar worker.
4. Discussion
Our results demonstrate that 34.38% of study participants reported at least “good” on general SRH, which is similar to studies from other counties, (e.g., a Pakistan study reported that overall 65.1% respondent rated their health as poor/fair).[18]
In Chinese society, people use job categories to group people into the following rankings: “Guan (Civil servant)”, “Gong” (Worker), “Nong”(Farmer), “Bing”(Solider), “Xue”(Student/Scholar), and “Shang”(Business man). Although this simple categorization might not accurately reflect the complexity of occupations in China today, these sub-categories are still commonplace and well-known across the nation. Important to consider, is that these sub-groups of occupations are not only job categorizations, but they also correspond to status rankings within Chinese society. The ranking of these sub-groups have varied over time, with the first class was considered “Gong” (worker) in the 1970s, while the first class during the 1980s was “Xue” (Student/Scholar), and after 2000 was considered the “Shang.”
The connection between education level and occupation within the context of China is complicated and has not been studied widely. In the traditional Chinese society, most occupations were unchangeable, and once a person started a particular occupation they did not deviate. However, there is a possible channel for the “Nong” (farmer) to become “Guan” (civil servant) through the Imperial Examination (Education). In the “Culture Revaluation” (1966–1976), some people were banned from being a “Bing”(Solider), “Gong”(Worker), or “Xue” (Student) due to their familial background.
Among the Chinese, civil servants had stronger associations on “good” general SRH and “good” time-comparative SRH compared to other occupations. These results are consistent with other study where high SES has been found to be associated with SRH.[19] However, Xie et al reported in their study that occupation was not related with SRH.[12] In Xie et al study, the occupation was categorized differently than in this study. Xie et al used the following categories: higher grade managers and professionals, lower grade managers and professionals, routine non-manual employees, self-employed, skilled manual workers, semi-skilled and unskilled manual workers, and agricultural workers. While Erikson study addressed the occupations in European countries in middle 1970's, based on what was then an industrial society.[20] This may explain why in these studies the results did not show the relationship among occupations and SES level to reported SRH, as it did in this current study examining China. In China, the categorization of occupations is different than that of a Western country setting and it also examined a different time-period than other studies. Additionally, the reference groups utilized in Erikson and Xie studies uses high grade managers and professionals, which is the smallest population in their study (only 6.7% in their sample). This could partly explain why they did not find an association between SES and SRH in their study. In study presented here, 1 possible reason for the finding of the high relationship of “good” general SRH among civil servant could be a result of the occupation prestige and unique medical insurance for that of civil servants found in China.
One potential explanation is that high SES has been associated with good objective health.[21] Previous studies reported that individual economic conditions are a basic factor in contributing to a good state of health, but that education could be even more relevant to preserve it.[4] However, Bartley et al pointed out that having secure employment in favorable working conditions greatly reduces the risk of healthy people developing limiting illness as secure employment increases the likelihood of recovery.[21] Chinese farmer had a more steady employment than other groups.[22–24] For instance, the rural-urban migrant workers who are farmer can go back to their home villages to avoid economic hardship, for example, the global financial crisis in 2008.[22,25] Almost thirty years ago, most jobs in China were permanent, but now very few jobs are. As a result, the stress from job insecurity has increased rapidly. While in China farming holds a large portion of the occupations and job market, it is impossible to become a farmer through buying land and in order to acquire land one must born into a family that has land. Compared with other jobs, the farmers own their land and they have a special benefit system; therefore, farmers may suffer from less stress related to job security. Liang et al claimed Chinese farmers who owned land are provided a series securities as following:
-
1.
“basic living security (i.e., farmers rely on their land for their basic living necessities);
-
2.
job security (i.e., farmers rely on their land for employment) and agricultural production,
-
3.
old-age security (i.e., farmers can sublet their lands to their children or to other individuals to support themselves during retirement); and
-
4.
value-added security (i.e., farmers rely on their farming income to send their children to school, buy health insurance, or support their families).[26]”
In China, there is a health disparity from “Hukou” system (household registration), which is one of China's main socioeconomic indicators.[27] There is a classification of agricultural /nonagricultural category in a person's hukou which detained one's socio-economic eligibility. Farmers registered under the agricultural category depended mainly on their own labor and the fluctuating harvests for survival; individuals registered under the nonagricultural category, on the other hand, were entitled to a “cradle-to-grave” welfare package provided by the government. This division remains crucial in determining people's opportunities. For example, farmers have a few channels to convert from an agricultural to a non-agricultural hukou status.[28] However, farmers also can get some special services, such as the bare foot doctors were training and provide health service for the farmers.[29] The Chinese government proposed a new rural cooperative medical system for the farmers since 2003.[30] In short, Chinese farmer is a special group and they have their own welfare/insurance system which is different from others.
In addition, the job of farmer requires more physical activity in their daily tasks compared to other occupations, which could be a benefit to the overall health status of farmers. Chronic diseases such as diabetes, hypertension is associated with decreased physical activity, in which the farmer occupation group is more active than most.
When we look at students, they face unique stress from working hard to achieve their educational goal of a degree and from facing an uncertain future of what graduation will be. They have stress from job seeking after 4 years studying, and compared with older adults in other professions, students are not rating their health status to the same time-conditions as other occupations are. In general, students are younger and healthier as an overall occupational group. Their significant association on the time-comparative SRH could be partly explained by age effect.[13,31]
It is plausible that the variation in the association between SRH on SES could be attributed to differences in how individuals define the concept of “health” among people with different SES statuses. Previous studies have found that individuals with different education or income levels may evaluate their health differently with respect to the traditional 5-point SRH scale, and hence their subjective health ratings may not be directly comparable.[32] Waller et al found that for general SRH, the answer “good” is significantly more common from the highly educated than from the medium and low educated among the adults.[33]
An alternative possibility is that health literacy may be an important indicator for SRH in SES. Health literacy could partly explain the positive association between SES and SRH. A Japanese study found that good self-reported health was significantly associated with both good employment status (OR, 2.89; 95% CI: 1.06–7.88) and higher communicative/critical health literacy (OR 2.75; 95%CI: 1.93–3.90). Respondents with lower education were more likely to have poorer communicative/critical HL.[2] Compared to blue collar workers, the civil servants and business men have more health literacy. Also, a Chinese study from Hong Kong Health pointed out that information seeking partially mediated the association between SES and SRH.[34] However, the small percentage cannot fully explain the direct effect on SRH.
Frijling et al found that when facing a disease, highly educated people may be more likely to be aware of the consequences of a health problem in terms of morbidity or mortality risks, and thus more likely to report poor SRH.[35] With regard to the association between the education level and SRH, Brouwer et al pointed out that the expectations regarding health and quality of life were greater for highly educated people than for those with a moderate level of education.[36] Further, people with greater expectations about their quality of life were more frequently dissatisfied with their current health status.[37] Thus, people with higher education level who reported a lower SRH could be partly explained by the impact of health problems on SRH may be worse for those with greater health expectations.
According to a study addressing the association between SRH and objective health among Chinese, the prevalence of all diseases was associated with poorer SRH. The people with abnormalities in laboratory parameters tended to have poorer SRH. Most of the health-related factors regarded as risks were associated with poorer SRH.[38] Among them, life and work pressure, poor spiritual status, and poor quality of interpersonal relationships were the most significant factors.[38] Of note, the SRH scores declined not only with the severity of self-reported mental/disease status, but also with the decrease of physical functional status.[39]
Despite these results based on a very large sample national study, our results have several limitations. First, we did not address age-comparative SRH (would you describe your health compared to others of your age and gender) since the relative data are not available. However, a previous study found that age-comparative SRH was linearly associated with physical health problems.[13] Our study had information on health status index which partly provided this information. Second, residual confounders, such as migration[40] and ethnicity[41] might also partly affect the results, but information on migration was not available in the present study. Third, mental illness could serve as a confounder or mediator of the relationship between occupation and SRH. By excluding individuals that are likely to have poor self-rated health, we have essentially limited the analysis to the strata of individuals that are likely to have better SRH, thereby biasing the results towards the null. Fourth, we did not address the possible temporal ambiguity between SES and SRH in this cross-sectional study. Both SES and SRH are varied from time to time. Future studies addressing long time SES and long term SRH are warranted. Fifth, the cross-sectional design cannot reveal a causal relationship between SES and Self-rated health. Sixth, the data on SRH and SES were self-reported. It could be subject to recall bias. Last, low SES unemployed workers were categorized into “other” because of small percentage in presented study. Of note, there is not widely accepted definition of “unemployment” in China other than official one which was critical as severer underestimate the actual numbers.
Our findings have considerable implications for both health disparity and economic policies that aim to reduce health disparities among various categories of SES and should target economic status as a potential area for intervention. In the surveillance of health, the annual physical examination screen could be used to identify high risk populations for improvement in SRH. Additionally, these results point to a need to target better work place interventions aiming to improve SRH of employees. Also, Public health awareness-raising for under-represented populations should be addressed and targeted for health interventions and resources.
5. Conclusion
In presented study, 34.4% of the participants reported “good” on the general SRH, and 26.2% participants reported “good” on the time-comparative SRH. The prevalence of “good” general SRH and “good” time-comparative SRH varied among occupations. Other factors may be responsible to explain the observed difference between occupation and SRH. Further investigations employing a larger sample size and objective health outcomes are warranted in the future.
Acknowledgments
We wish to thank all the participants for their co-operation in the data collection.
Author contributions
Yu Tong, Michelle Gamber, Ali Gholam, and Wenjie Sun wrote the paper, Wenjie Sun, Tan Xu conceived and designed the experiments. Yan Jiang carried out the analyses. All authors read and approved the final manuscript.
Conceptualization: Tan Xu, Wenjie Sun.
Data curation: Yan Jiang.
Formal analysis: Yan Jiang, Wenjie Sun.
Methodology: Wenjie Sun.
Project administration: Tan Xu.
Writing – original draft: Tong Yu, Wenjie Sun.
Writing – review & editing: Tong Yu, Michelle Gamber, Ali Gholam, Tan Xu, Wenjie Sun.
Footnotes
Abbreviations: ANOVA = analysis of variance, CI = confidence interval, SES = socioeconomic status, SRH = self-rated health.
The authors declare that they have no conflict of interest.
References
- [1].Suresh S, Sabanayagam C, Shankar A. Socioeconomic status, self-rated health, and mortality in a multiethnic sample of US adults. J Epidemiol 2011;21:337–45. [DOI] [PMC free article] [PubMed] [Google Scholar]
- [2].Furuya Y, Kondo N, Yamagata Z, et al. Health literacy, socioeconomic status and self-rated health in Japan. Health Promot Int 2015;30:505–13. [DOI] [PubMed] [Google Scholar]
- [3].Bauer GF, Huber CA, Jenny GJ, et al. Socioeconomic status, working conditions and self-rated health in Switzerland: explaining the gradient in men and women. Int J Public Health 2009;54:23–30. [DOI] [PubMed] [Google Scholar]
- [4].Alvarez-Galvez J, Rodero-Cosano ML, Motrico E, et al. The impact of socio-economic status on self-rated health: study of 29 countries using European social surveys (2002-2008). Int J Environ Res Public Health 2013;10:747–61. [DOI] [PMC free article] [PubMed] [Google Scholar]
- [5].Kim DS, Jeon GS, Jang SN. Socioeconomic status, social support and self-rated health among lone mothers in South Korea. Int J Public Health 2010;55:551–9. [DOI] [PubMed] [Google Scholar]
- [6].Seubsman SA, Kelly MJ, Yiengprugsawan V, et al. Gender, socioeconomic status, and self-rated health in a transitional middle-income setting: evidence from Thailand. Asia Pac J Public Health 2011;23:754–65. [DOI] [PMC free article] [PubMed] [Google Scholar]
- [7].Kottke TE, Pronk NP. Taking on the social determinants of health: a framework for action. Minn Med 2009;92:36–9. [PubMed] [Google Scholar]
- [8].Zheng Y, Yuan J, Xu T, et al. Socioeconomic status and fertility intentions among Chinese women with one child. Hum Fertil (Camb) 2016;19:43–7. [DOI] [PubMed] [Google Scholar]
- [9].Fernandez-Ruiz M, Guerra-Vales J, Trincado R, et al. The ability of self-rated health to predict mortality among community-dwelling elderly individuals differs according to the specific cause of death: data from the NEDICES cohort. Gerontology 2013;59:368–77. [DOI] [PMC free article] [PubMed] [Google Scholar]
- [10].Sargent-Cox KA, Anstey KJ, Luszcz MA. Determinants of self-rated health items with different points of reference: implications for health measurement of older adults. J Aging Health 2008;20:739–61. [DOI] [PubMed] [Google Scholar]
- [11].Vuorisalmi M, Lintonen T, Jylha M. Global self-rated health data from a longitudinal study predicted mortality better than comparative self-rated health in old age. J Clin Epidemiol 2005;58:680–7. [DOI] [PubMed] [Google Scholar]
- [12].Xie Z, Poon A, Wu Z, et al. Is occupation a good predictor of self-rated health in China? PLoS One 2015;10:e0125274. [DOI] [PMC free article] [PubMed] [Google Scholar]
- [13].Li ZB, Lam TH, Ho SY, et al. Age- versus time-comparative self-rated health in Hong Kong Chinese older adults. Int J Geriatr Psychiatry 2006;21:729–39. [DOI] [PubMed] [Google Scholar]
- [14].Sun W, Yu Y, Yuan J, et al. Sleep duration and quality among different occupations--China national study. PLoS One 2015;10:e0117700. [DOI] [PMC free article] [PubMed] [Google Scholar]
- [15].Haseli-Mashhadi N, Pan A, Ye X, et al. Self-Rated Health in middle-aged and elderly Chinese: distribution, determinants and associations with cardio-metabolic risk factors. BMC Public Health 2009;9:368. [DOI] [PMC free article] [PubMed] [Google Scholar]
- [16].Cho KO. Sleep duration and self-rated health are independently associated with physical activity level in the Korean population. Iran J Public Health 2014;43:590–600. [PMC free article] [PubMed] [Google Scholar]
- [17].Gueorguieva R, Sindelar J, Falba T, et al. The impact of occupation on self-rated health: cross-sectional and longitudinal evidence from the health and retirement survey. J Gerontol B Psychol Sci Soc Sci 2009;64:118–24. [DOI] [PMC free article] [PubMed] [Google Scholar]
- [18].Ahmad K, Jafar TH, Chaturvedi N. Self-rated health in Pakistan: results of a national health survey. BMC Public Health 2005;5:51. [DOI] [PMC free article] [PubMed] [Google Scholar]
- [19].Wang F, Zhen Q, Li K, et al. Association of socioeconomic status and health-related behavior with elderly health in China. PLoS One 2018;13:e0204237. [DOI] [PMC free article] [PubMed] [Google Scholar]
- [20].Erikson R, G JH. The constant flux: a study of class mobility in industrial societies. 1992;United States: Oxford University Press, 13–17. [Google Scholar]
- [21].Bartley M, Sacker A, Clarke P. Employment status, employment conditions, and limiting illness: prospective evidence from the British household panel survey 1991-2001. J Epidemiol Community Health 2004;58:501–6. [DOI] [PMC free article] [PubMed] [Google Scholar]
- [22].Yao J. Who is jobless? A comparison of joblessness in rural and urban areas in China. Asian Soc Work Policy Rev 2017;11:12. [Google Scholar]
- [23].Chang K-C, Wen M, Wang G. Social capital and work among rural-to-urban migrants in China. Asian Populat Stud 2011;7:18. [Google Scholar]
- [24].Heurlin C. Unemployment among land-losing farmers in China: evidence from the 2010 census. J Contemp China 2018. [Google Scholar]
- [25].Xinhua. China's unemployment rates are authentic, continue to be stable. 2016; Available from: http://www.chinadaily.com.cn/business/2016-08/25/content_26597048.htm Accessed 7 March, 2019. [Google Scholar]
- [26].Liang Y, Lu W, Wu W. Are social security policies for Chinese landless farmers really effective on health in the process of Chinese rapid urbanization? A study on the effect of social security policies for Chinese landless farmers on their health-related quality of life. Int J Equity Health 2014;13:5. [DOI] [PMC free article] [PubMed] [Google Scholar]
- [27].Guo J, Guan L, Fang L, et al. Depression among Chinese older adults: a perspective from Hukou and health inequities. J Affect Disord 2017;223:115–20. [DOI] [PubMed] [Google Scholar]
- [28].Qian Y, Qian Z. Assortative mating by education and Hukou in Shanghai. Chin Sociol Rev 2017;49:239–62. [DOI] [PMC free article] [PubMed] [Google Scholar]
- [29].Zhang D, Unschuld PU. China's barefoot doctor: past, present, and future. Lancet 2008;372:1865–7. [DOI] [PubMed] [Google Scholar]
- [30].Wu J, Deaton S, Jia B, et al. The cost-effectiveness analysis of the new rural cooperative medical scheme in China. PLoS One 2018;13:e0208297. [DOI] [PMC free article] [PubMed] [Google Scholar]
- [31].Hoeymans N, Feskens E, Van den Bos G, et al. Age, time, and cohort effects on functional status and self-rated health in elderly men. Am J Public Health 1997;87:1620–5. [DOI] [PMC free article] [PubMed] [Google Scholar]
- [32].Dowd JB, Zajacova A. Does the predictive power of self-rated health for subsequent mortality risk vary by socioeconomic status in the US? Int J Epidemiol 2007;36:1214–21. [DOI] [PubMed] [Google Scholar]
- [33].Waller G, Thalén P, Janlert U, et al. A cross-sectional and semantic investigation of self-rated health in the northern Sweden MONICA-study. BMC Med Res Methodol 2012;12:154. [DOI] [PMC free article] [PubMed] [Google Scholar]
- [34].Wang MP, Wang X, Lam TH, et al. Health information seeking partially mediated the association between socioeconomic status and self-rated health among Hong Kong Chinese. PLoS One 2013;8:e82720. [DOI] [PMC free article] [PubMed] [Google Scholar]
- [35].Frijling BD, Lobo CM, Keus IM, et al. Perceptions of cardiovascular risk among patients with hypertension or diabetes. Patient Educ Couns 2004;52:47–53. [DOI] [PubMed] [Google Scholar]
- [36].Brouwer WB, van Exel NJ. Expectations regarding length and health related quality of life: some empirical findings. Soc Sci Med 2005;61:1083–94. [DOI] [PubMed] [Google Scholar]
- [37].Ross CE, Van Willigen M. Education and the subjective quality of life. J Health Soc Behav 1997;38:275–97. [PubMed] [Google Scholar]
- [38].Wu S, Wang R, Zhao Y, et al. The relationship between self-rated health and objective health status: a population-based study. BMC Public Health 2013;13:320. [DOI] [PMC free article] [PubMed] [Google Scholar]
- [39].Meng Q, Xie Z, Zhang T. A single-item self-rated health measure correlates with objective health status in the elderly: a survey in suburban beijing. Front Public Health 2014;2:27. [DOI] [PMC free article] [PubMed] [Google Scholar]
- [40].Chang HC, Wallace SP. Migration processes and self-rated health among marriage migrants in South Korea. Ethn Health 2016;21:1–9. [DOI] [PMC free article] [PubMed] [Google Scholar]
- [41].Andersen PT, Bak C, Vangsgaard S, et al. Self-rated health, ethnicity and social position in a deprived neighbourhood in Denmark. Int J Equity Health 2011;10:5. [DOI] [PMC free article] [PubMed] [Google Scholar]