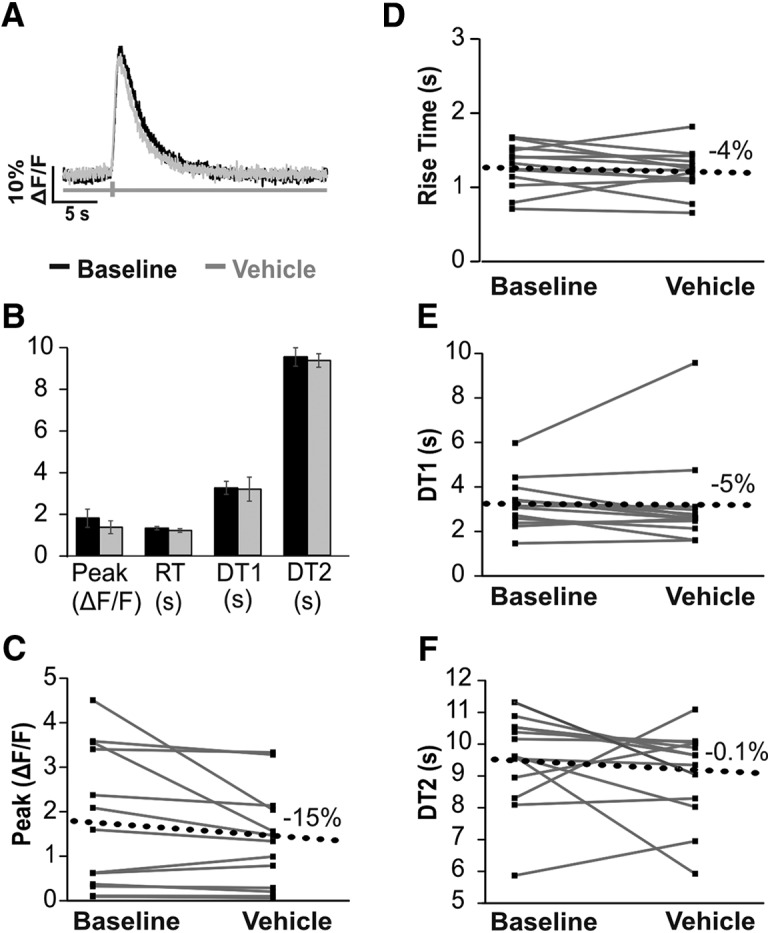
Figure 7.

GCaMP6s calcium transients do not significantly change with repeat imaging. A, Example calcium transients from one cell imaged at baseline (black) and 30 min after vehicle (ACSF with 0.1% DMSO, gray). B, Mean values (±SEM) from 13 cells imaged from three animals at baseline and after vehicle. Paired t tests found no significant differences after addition of vehicle were detected. C–F, Baseline and vehicle values for 13 cells (gray lines). Black dotted line denotes the average change from baseline for each parameter.
