Abstract
The hydrothermal treatment of sugars features a promising technology for the production of fine and platform chemicals from renewable resources. In this work the hydrothermal decomposition of fructose was studied in a buffered medium at a pH range between 2.2 and 8.0. It is demonstrated that at lower pH values mainly 5‐hydroxymethylfurfural (HMF), levulinic acid and humin are generated, while lactic acid and acetic acid are produced at higher pH values. The work shows that the use of moderate acidic conditions may have advantages for the hydrothermal HMF production over the use of strongly acidic conditions, as especially the degradation into levulinic acid is suppressed. Besides, this study deals with a rather complex reaction network, hence limitations and need for adaption of the kinetic model are discussed.
Keywords: kinetic modeling, fructose, platform chemicals, hydrotermal treatment, renewable resources
1. Introduction
The production of chemicals from renewable resources instead of fossil resources is a subject of growing importance due to increasing scarcity of fossil resources and negative environmental impacts of their production and processing. In this context, carbohydrates feature a relevant component of biomass for the production of platform chemicals such as 5‐Hydroxymethylfurfural (HMF), levulinic acid (LevA) and lactic acid (LacA).
Hydrothermal processes are an interesting technology for the conversion of biomass‐derived carbohydrates into high value products by using sub‐critical water as a cheap, safe and environmentally‐friendly solvent. They allow for the conversion of wet biomass and, in many cases, for an easy product isolation. Also, via the temperature the solvent properties of sub‐critical water, like degree of dissociation and hydrophobicity, can be influenced.1, 2 However, several works have demonstrated that the formation of some products, especially HMF, proceeds with a much lower selectivity in water than in organic solvents, because water enables or facilitates side and degradation reactions. On the other hand, certain heterogeneous catalysts may improve the selectivity of HMF formation.3, 4
Degradation reactions of sugars are usually either catalysed by acids, like in the case of HMF5, 6, 7, 8, 9, or by bases, like in the case of LacA.10, 11, 12 Although, the formation of unwanted side products is also sensitive to those catalysts. For instance, LevA is a rehydration product of HMF and its formation is also acid catalysed.13, 14, 15 The question is whether the formation of side products might be prevented by applying moderate pH values, i. e. only slightly acidic or basic. If this is possible, not only the selectivity of target product formation could be increased, also the employment of certain co‐catalysts like CrCl3, which also enhance the selectivity,16, 17, 18, 19 but might be not environmentally‐friendly, could be waived. On the other hand, the reaction rate would be lower what ought to be compensated by applying a higher temperature.
In this work, the hydrothermal treatment of fructose was studied at varying pH values between 2.2 and 8.0 using McIlvaine buffer. Kinetic modelling was applied to obtain a set of reaction rate constants that allow for a prediction of the maximum yield of each degradation product via a numerical approximation.
The objective of this study is to elucidate the degradation pathways of fructose at different moderate, stabilised pH values. The data may serve as a basis to assess whether the application of moderate pH values features an option for hydrothermal conversion of carbohydrates in an industrial scale.
Experimental Section
Materials
Fructose, citric acid, dipotassium hydrogen phosphate and sulfuric acid (98 %, HPLC grade) were purchased from VWR and used as provided. HMF was purchased from Alibaba and purified by vacuum distillation prior to use. Water was deionised. For the HPLC eluent, Millipore grade water was used. The solvents used for LC‐MS (water, methanol, formic acid) were of the respective grade.
Hydrothermal Treatment
A stock solution is prepared by dissolving 100 g/l fructose in water. The pH value is adjusted by adding 10 % v/v of a mixture of 2 M K2HPO4 solution and 1 M citric acid, whereby base and acid are mixed in different ratios in order to achieve different pH values between 2.2 and 8.0 (a mixture of 0.2 M Na2HPO4 solution with 0.1 M citric acid is known as McIlvaine buffer). The acid and the base are also prepared by dissolving the respective solids in water.
In a similar procedure, stock solutions of 170 mM HMF with different pH values are prepared.
For the hydrothermal treatment, 5.0 ml of the stock solution are filled into a stainless steel autoclave, which is closed with a screw cap (50 Nm). The autoclave is placed in an ancient GC oven and heated up to the desired temperature. The temperature inside the autoclave is checked using a thermocouple. The reaction time counts from reaching a temperature 1 K below the target temperature inside the autoclave. After the desired reaction time, the autoclave is removed from the oven and quickly cooled down in a water bath.
The samples are filtered by vacuum filtration using a Whatman 0.2 μm nylon filter. The filtrates are collected for HPLC analysis and pH value determination. The pH value is determined using a Hach Lange HQ40d device equipped with an IntelliCAL PHC201 electrode. The solid residues are washed with water, dried at 105 °C overnight and weighted.
HPLC Analysis
The filtrates are analysed by HPLC using a Shimadzu Prominence System. Fructose, glucose, lactic acid, acetic acid, formic acid, levulinic acid, HMF and furfural are separated on a BioRad Aminex column (300×7.8 mm I.D.) at 35 °C and detected by a refractive index detector. As eluent 4 mM sulfuric acid is used with a flow rate of 0.6 ml/min.
LC‐MS Analysis
To perform a LC‐MS analysis, samples of hydrothermally treated HMF solutions are separated on a Luna C18 column (150×4.6 mm I.D.) using an Agilent 1290 system and a 0.2 % w/v formic acid (solvent A), 0.1 % w/v formic acid in methanol (solvent B) gradient with the following profile: 0.0–2.5 min: 90 % A; 2.5–8.0 min: 67 % A; 13.0–18.0 min: 40 % A; 18.0–22.0 min: 10 % A; 22.0–26.0 min: 90 % A. The flow rate is 0.5 ml/min at an oven temperature of 40 °C.
For mass detection a Q‐Exactive Plus mass spectrometer is used under the control of the software XCalibur 3.0.63. The MS and MS/MS spectra are detected at the parameters detailed in Table 1 in negative and positive mode.
Table 1.
MS parameters.
| MS spectra | MS/MS spectra | |
|---|---|---|
| Resolution | 35,000 | 17,500 |
| Max. injection time | 100 ms | 64 ms |
| Automatic gain control | 1×10⁶ | 5×10⁴ |
| Normalised collision energy | – | 20, 30, 40 |
| Intensity threshold | – | 1.3×10⁵ |
| Isolation window | – | 1.5 Da |
Kinetic Model
The kinetic model used in this work is displayed in Scheme 1. The related differential equations are eqn. 1–8. The assumption that one substance can be generated from more than one educt lead to obviously wrong results. For this reason, it is assumed that LacA and HMF are formed from fructose only, while glucose can only re‐isomerise to fructose. In model 2, AceA is considered as a product of HMF only at pH 2.2 to 5.0 (k8=0, k4=0) and as a product of LacA only at pH 6.0 to 8.0 (k8=0, k10=0). In model 1, AceA is only formed from fructose (k4=0, k10=0). A “residue” is used to close the molar balance. Also, k9 covers the fact that the exact stoichiometry especially of the LacA and AceA formation and the generation of possible co‐products are not known. k9 is therefore a function of these unidentified variables.
| (1) |
| (2) |
| (3) |
| (4) |
| (5) |
| (6) |
| (7) |
| (8) |
Scheme 1.
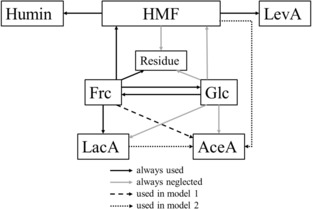
Kinetic model used in this work.
The calculation of the reaction rate constants has been done with MATLAB R2018b by numerical integration of the equations 1–8 with ODE45 followed by optimization with the lsqnonlin tool. The maximum yield was defined as the maximum value that the optimized model data displayed after modeling the reaction network within the first 1600 minutes.
2. Results
2.1. Hydrothermal Treatment of Fructose
In order to depict product yield (Y), educt conversion (C) and selectivity (S) of a reaction within one diagram, the CYS plot will be applied, which has also been used in previous publications with this purpose.9 The CYS plot is a ternary plot providing Y, the amount of unreacted educt (1‐C) and the amount of side and degradation products (C−Y). The selectivity can be found by drawing a virtual line between the respective data point and the downer left edge and identifying the intersection point with the right side of the triangle. It is important to note that CYS plots can only be used, if the product yield Y and especially the conversion degree C of the educt are available. The following CYS plots use fructose as educt, even though the products might form from intermediates. Also, it is assumed that the stoichiometry between educt and product is 1 : 1. Figures 1–6 display the CYS plots of the formation of HMF, glucose, lactic acid, acetic acid, levulinic acid and humin from fructose at different initial pH values at 140 °C.
Figure 1.
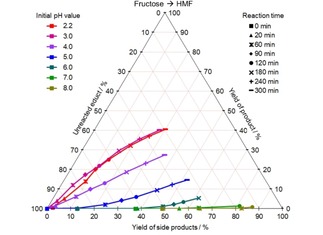
CYS plot of the HMF formation from fructose at different initial pH values and 140 °C; values given in mol %.
Figure 6.
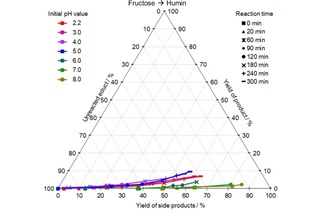
CYS plot of the humin formation from fructose at different initial pH values and 140 °C; values given in mol %.
Figure 2.
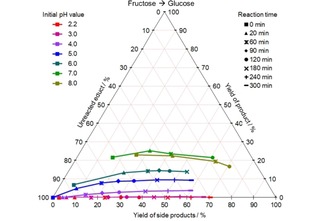
CYS plot of the glucose formation from fructose at different initial pH values and 140 °C; values given in mol %.
Figure 3.
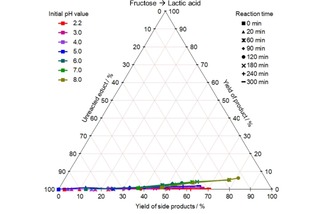
CYS plot of the LacA formation from fructose at different initial pH values and 140 °C; values given in mol %.
Figure 4.
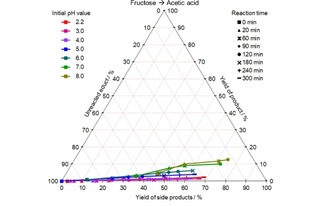
CYS plot of the AceA formation from fructose at different initial pH values and 140 °C; values given in mol %.
Figure 5.
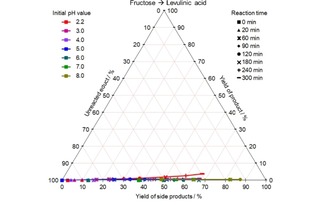
CYS plot of the LevA formation from fructose at different initial pH values and 140 °C; values given in mol %.
The formation of HMF takes place especially at low pH values: While the course of the reaction is similar at pH 2.2 and 3.0 achieving a yield of 40 mol % at a conversion of 70 mol % after 5 hours, the selectivity drops, if the pH is increased further. From pH 7 literally no HMF formation takes place.
Glucose is formed in particular at high pH values and no glucose can be detected at pH 3 or lower. Besides the beginning of the reaction, the amount of glucose in the system remains constant on a pH‐dependent level over the course of the reaction.
Lactic acid is also formed at high pH values, however less than 10 mol % yield were achieved in the best case.
Unlike lactic acid, acetic acid formation can be observed at all initial pH values, however the selectivity of formation increases with rising pH value. A yield of 13 mol % was achieved within 2 hours in the best case.
Levulinic acid, on the contrary, is only observed at low pH values, however a very low yield of 4 mol % was achieved in the best case.
A low, but significant humin formation can be observed especially at low pH values until 5. The yield amounts up to 10 mol %, if one assumes the molecular weight of humin monomers to be 108.11 g/mol.
In addition to the listed products, low amounts of formic acid were observed at all initial pH values as well as traces of furfural at initial pH values between 2.2 and 6.0 (not depicted).
The hydrothermal conversion of fructose at pH 2.2 and 3.0 was also studied at 150 and 160 °C. In this case, the most important products are HMF, LevA and humin, as it can be seen in Figure 7 and 8. At pH 2.2 up to 46 mol % HMF, 18 mol % humin and 6 mol % LevA were yielded. At pH 3.0 similar HMF (up to 47 mol %) and humin (up to 14 mol %) yields were achieved. However, the LevA yield was only up to 1 mol %.
Figure 7.
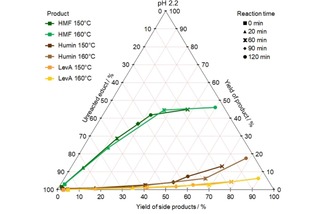
CYS plot of the formation of HMF, humin and LevA from fructose at pH 2.2 and different temperatures; values given in mol %.
Figure 8.
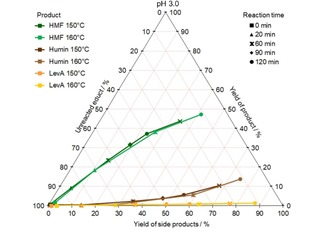
CYS plot of the formation of HMF, humin and LevA from fructose at pH 3.0 and different temperatures; values given in mol %.
The pH value of the hydrothermally treated solutions was determined as well. As Figure 9 reveals, the pH value drops the more strongly, the higher it was in the beginning. Only the initial pH values 2.2 and 3.0 remained stable over the whole reaction time. This was also the case in the treatments at 150 and 160 °C (not depicted).
Figure 9.
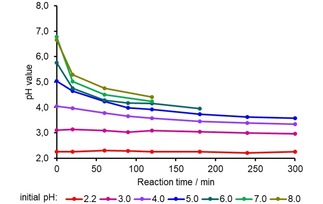
Change of the pH value as a function of the reaction time; values determined at room temperature.
The experimental data was used for the determination of the respective k‐values. Figure 10 and Figure 11 show the graphic illustration of the change of the product solution composition as function of the reaction time for pH 2.2, 140 °C, model 1 and 2, exemplarily. For all other pH values and temperatures examined the respective figures are displayed in the supplementary information. Overall, a good fit accuracy of the modelled data was achieved in all cases.
Figure 10.
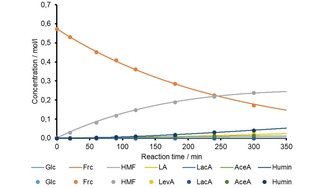
Change of the composition of the hydrothermally treated product solution as function of reaction time; the dots represent the experimental values, the curves are modelled according to model 1.
Figure 11.
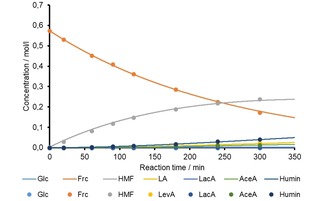
Change of the composition of the hydrothermally treated product solution as function of reaction time; the dots represent the experimental values, the curves are modelled according to model 2.
2.2. Hydrothermal Treatment of HMF
The degradation of HMF was studied in a 170 mM solution at 140 °C for 60 and 180 min. The mass balance is displayed in Figure 10 and 11. At pH 4 and lower humin, LevA and FA formed, while at higher pH most of the degradation products could not be identified. Obviously, HMF is the most stable at pH 5 with a conversion of <4 mol %. In the HPLC chromatogram several peaks appeared that could not be assigned. One was assigned as propionic acid forming especially at higher pH, but this is considered to be wrong.
Figure 12.
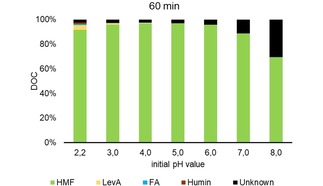
Mass balance of HMF solution treated hydrothermally at different pH values for 60 min at 140 °C; provided as Dissolved Organic Carbon (DOC).
Figure 13.
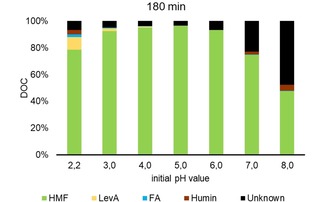
Mass balance of HMF solution treated hydrothermally at different pH values for 180 min at 140 °C; provided as Dissolved Organic Carbon (DOC).
The pH values remained stable during the hydrothermal treatment of HMF. Only the initial pH 8.0 dropped to 7.7 after 60 min and 7.5 after 180 min (not depicted).
2.3. Hydrothermal Treatment of McIlvaine Buffer
The pure buffer solution, i. e. without fructose or HMF, was treated at 140 °C for 60 min. For all pH values, a colourless and clear solution was obtained that, according to HPLC analysis, did not contain any of the compounds found after the treatment of fructose and HMF, respectively. Also, the initial pH value did not alter during the treatment.
2.4. Theoretical Maximum Yield of Fructose Degradation Products
The reaction rate constants obtained by kinetic modelling of the experimental data were used in a numerical analysis to determine the theoretical maximum yields of different fructose degradation products. Within Table 1 the maximum yields according to model 1 are displayed and within Table 2 the maximum yields according to model 3.
Table 2.
Theoretical maximum yield in mol % of fructose degradation products, if AceA is considered a product of fructose conversion (model 1); for intermediates the time is given in brackets, when the maximum yield is achieved.
| Initial pH | T [°C] | Ymax | |||||
|---|---|---|---|---|---|---|---|
| HMF | LevA | Humin | Glucose | LacA | AceA | ||
| 2.2 | 140 | 42.1 % (422 min) | 24.9 % | 56.1 % | 0.3 % (7 min) | 0.0 % | 2.5 % |
| 150 | 44.8 % (190 min) | 20.6 % | 57.3 % | 0.0 % | 0.7 % | 2.0 % | |
| 160 | 46.8 % (90 min) | 18.6 % | 54.5 % | 0.0 % | 0.7 % | 3.0 % | |
| 3.0 | 140 | 44.0 % (528 min) | 9.1 % | 75.9 % | 0.0 % | 1.6 % | 1.8 % |
| 150 | 43.6 % (233 min) | 5.8 % | 66.8 % | 0.0 % | 2.0 % | 2.1 % | |
| 160 | 45.9 % (118 min) | 4.3 % | 65.5 % | 0.0 % | 1.9 % | 2.7 % | |
| 4.0 | 140 | 26.6 % (450 min) | 0.0 % | 57.5 % | 7.1 % (1633 min) | 2.4 % | 3.0 % |
| 5.0 | 140 | 11.5 % (315 min) | 0.0 % | 33.7 % | 10.3 % (139 min) | 3.1 % | 7.4 % |
| 6.0 | 140 | 3.2 % (180 min) | 0.0 % | 9.8 % | 18.3 % (38 min) | 6.8 % | 10.4 % |
| 7.0 | 140 | 0.0 % | 0.0 % | 0.9 % | 24.9 % (36 min) | 7.4 % | 15.7 % |
| 8.0 | 140 | 1.3 % (70 min) | 0.4 % | 3.7 % | 23.0 % (0 min) | 7.3 % | 15.5 % |
Table 3.
Theoretical maximum yield in mol % of fructose degradation products, if AceA is considered a product of HMF and LacA conversion (model 2); for intermediates the time is given in brackets, when the maximum yield is achieved.
| Initial pH | T [°C] | Ymax | |||||
|---|---|---|---|---|---|---|---|
| HMF | LevA | Humin | Glucose | LacA | AceA | ||
| 2.2 | 140 | 40.5 % (391 min) | 22.3 % | 44.0 % | 0.0 % | 0.5 % | 14.2 % |
| 150 | 44.5 % (183 min) | 18.8 % | 52.9 % | 0.0 % | 0.8 % | 7.7 % | |
| 160 | 47.0 % (87 min) | 17.4 % | 50.9 % | 0.0 % | 1.0 % | 7.3 % | |
| 3.0 | 140 | 42.9 % (499 min) | 8.0 % | 64.8 % | 0.0 % | 1.7 % | 11.6 % |
| 150 | 42.9 % (222 min) | 4.2 % | 59.3 % | 0.7 % (363 min) | 1.7 % | 10.4 % | |
| 160 | 45.7 % (114 min) | 3.5 % | 59.6 % | 0.7 % (184 min) | 1.9 % | 9.0 % | |
| 4.0 | 140 | 25.9 % (419 min) | 0.0 % | 49.5 % | 7.6 % (1700 min) | 2.7 % | 8.7 % |
| 5.0 | 140 | 11.0 % (252 min) | 0.0 % | 26.3 % | 10.4 % (140 min) | 3.5 % | 13.2 % |
| 6.0 | 140 | 3.3 % (178 min) | 0.0 % | 10.2 % | 18.3 % (38 min) | 3.0 % (110 min) | 16.2 % |
| 7.0 | 140 | 0.0 % | 0.0 % | 1.4 % | 25.1 % (36 min) | 3.7 % (63 min) | 21.8 % |
| 8.0 | 140 | 0.1 % (10 min) | 0.4 % | 1.7 % | 23.0 % (0 min) | 5.2 % (54 min) | 22.4 % |
As Table 1 and Table 2 show, the maximum yield of HMF falls in a range of around 45 mol % at the most acidic conditions and decreases with increasing pH. There is no significant difference neither between the initial pH 2.2 and 3.0, nor depending on the model.
Also, the maximum LevA yield decreases with increasing pH, while there is already a large difference between pH 2.2 and 3.0. The predicted LevA yields do not depend significantly on the model.
The maximum humin yield seems to be achieved at pH 3. The predicted yields according to model 1 are slightly higher than the predicted yields according to model 2.
The maximum glucose yield increases with increasing pH, while there is no significant difference regarding the model.
The maximum LacA yield also increases with increasing pH. Between pH 2.2 and 5.0 both models provide similar predicted yields. Between pH 6 and 8 the LacA yields according to model 2 are lower.
The maximum AceA yields show the tendency to increase with increasing pH according to model 1, while according to model 2 there seems to be a minimum at pH 4. In general, the predicted maximal AceA yields are significant larger according to model 2 compared to model 1.
2.5. Activation Energies
As the initial pH values 2.2 and 3.0 have been found to be stable over the whole reaction time at 140 °C, additional hydrothermal treatments have been performed at 150 and 160 °C allowing for the determination of the activation energies (EA) and the A factors of the HMF, LevA and humin formation. These are displayed in Table 4. It can be seen that the values are essentially independent of the model chosen. Also, EA does not change, if the pH value is increased from 2.2 to 3.0. An exception features the formation of LevA of which EA declines.
Table 4.
Activation energies and A factors of the HMF, LevA and humin formation.
| pH | Path | Model 1 | Model 2 | ||
|---|---|---|---|---|---|
| EA [kJ K−1 mol−1] | A [s−1] | EA [kJ K−1 mol−1] | A [s−1] | ||
| 2.2 | Frc→HMF | 123 | 1.93E+11 | 123 | 1.73E+11 |
| HMF→LevA | 76 | 3.13E+04 | 77 | 4.45E+04 | |
| HMF→humin | 106 | 3.49E+08 | 106 | 4.07E+08 | |
| 3.0 | Frc→HMF | 118 | 3.85E+10 | 118 | 2.95E+10 |
| HMF→LevA | 51 | 4.99E+00 | 48 | 1.75E+00 | |
| HMF→humin | 107 | 5.25E+08 | 105 | 2.68E+08 | |
2.6. LC‐MS Analysis of HMF Degradation Products
The HMF solutions treated at 140 °C for one hour were analysed by LC‐MS in order to identify further degradation products of HMF. By this method, compounds with a molecular weight between 100 and 650 Da can be detected.
Besides HMF ([M+H]+=127.02 Da) and citric acid ([M−H]−=191.02 Da), which were initially present, furoic acid ([M−H]−=111.01 Da), levulinic acid ([M−H]−=115.04 Da) and a condensation product between citric acid and HMF ([M−H]−=299.04 Da; [M+H]+=301.06 Da; [M+Na]+=323.04 Da) could be identified at low initial pH values. Another condensation product between citric acid and HMF comprising an unknown residue in addition has a mass of [M−H]−=391.03 Da.
At high pH values, [M−H]−=287.08 Da is a prominent mass featured by at least two different, i. e. chromatographically separable species. This mass corresponds to a molecule built of two HMF and two water molecules. Besides, also a HMF dimer ([M−H]−=249.04 Da; [M+H]+=251.05 Da; [M+Na]+=273.04 Da; [M+K]+=289.01 Da) occurs especially at higher pH values.
At all initial pH value a mass [M+H]+=235.06 Da can be identified corresponding to a condensated HMF dimer. The masses corresponding to a condensated HMF trimer ([M+H]+=343.08 Da) and tetramer ([M+H]+=451.14 Da) were also found. A mass of [M−H]−=204.99 Da might correspond to HMF phosphate. Furthermore, there were indications for the presence of diformylfuran (DFF, [M+H]+=123.01 Da), formylfuroic acid (FFA, [M+H]+=139.04 Da) and furandicarboxylic acid (FDCA, [M+H]+=155.01 Da), although not for Cannizzaro reaction products of HMF: bishydroxymethylfuran (BHMF) and hydroxymethylfuroic acid (HMFA).
3. Discussion
3.1. Kinetic Model
As a number of degradation products of fructose were determined within this work, a relatively complex model had to be developed to cover all possible reaction pathways. However, it became evident that the modelling program cannot deal well with the assumption that one product is formed from more than one substrate. In order to facilitate the model all degradation paths of glucose, except for its re‐isomerisation to fructose, were neglected. This approach can be justified, as the amount of glucose, even in the best case, is much lower than the initial amount of fructose. Still in the consequence, this approach means that the conversion rates of fructose are potentially overrated, as they comprise the direct conversion of fructose plus the conversion of glucose. The same has to be stated for the re‐isomerisation rate, since all glucose that actually forms the other products directly is assumed to form fructose first.
A similar problem is encountered when defining acetic acid as a product of HMF and lactic acid. Within model 2, this problem is solved by neglecting the production of AceA from HMF in those cases, where almost no HMF was present (pH 6–8), and neglecting its production from LacA in those cases, where almost no LacA was present (pH 2.2–5). In model 1, AceA is considered a product of fructose only.
Apparently, the choice of the model has no impact on the fitting quality of the experimental values, but a large effect on the yield prediction. In here, the predicted maximal AceA yield is the most affected, while for humin and LacA a small influence has to be stated. For HMF, LevA and glucose both models provide similar values.
3.2. Degradation Mechanisms
In the hydrothermal treatment of fructose at different pH values a range of degradation products occurs of which formation mechanism will be elucidated here.
3.2.1. HMF
HMF is a very well know molecule obtained by the Brønsted acid catalysed, triple dehydration of hexoses, especially ketohexoses. Aldoses, such like glucose, form HMF to a smaller extent.23 The conversion is not only slower, i. e. requires harsher conditions, but also less selective. A common consideration is that aldoses have to be isomerised into the respective ketose prior to undergoing dehydration to HMF. The Lobry de Bruyn‐van Ekenstein transformation, which turns aldoses into ketoses (and back), working badly under acidic conditions is blamed for the inefficient HMF formation from aldoses. In turn, much higher HMF yields can be obtained from aldoses, if Lewis acids are employed catalysing the isomerisation via a 1,2‐hydride shift.16, 24 However, it has also been postulated that there is a direct path from the aldose to HMF bypassing the isomerisation by forming a joint intermediate with fructose after the first dehydration.8
HMF is considered a promising platform chemical for the production of plastic and fine chemicals out of biomass instead of fossil resources.25 One challenge in this context is that HMF is not stable under common reaction conditions. This study reveals that HMF is the most stable at pH 5 showing only low conversion at 140 °C. On the other hand, the maximal HMF yield at pH 3 is not lower than at pH 2.2. Also, as a previous study reveals, pH values between 2 and 1 do not achieve higher maximal yields either.9 Only the reaction time to achieve the maximum yield is shorter. However, this can be compensated by applying a higher temperature. This might be even beneficial for achieving high maximal HMF yields, as it is reported that the selectivity of HMF formation increases with increasing temperature.26
3.2.2. Levulinic Acid
Levulinic acid (LevA) is an often observed degradation product of HMF of which formation is also acid catalysed. In the sum, LevA is produced upon a single rehydration of HMF, however, according to Horvat et al.13 its formation involves several hydroxylation and dehydroxylation reactions. It has also been postulated that LevA forms from furfuryl alcohol, an alternative dehydration product of hexoses instead of HMF, although this pathway seems to be of minor importance.8
Like HMF, LevA is an interesting platform chemical, e. g. for the production of flavours or anti‐knock agents. High yields of LevA have been reported, if relatively harsh conditions with regard to pH and temperature are applied.27 In this work, only low yields were observed due to the mild reaction conditions. Compared to HMF, the advantage of LevA consists in being much more stable at reaction conditions. LevA literally does not decompose, which makes achieving good yields in a short time easier.
3.2.3. Humins
When performing hydrothermal treatment of sugars or biomass, a solid, insoluble by‐product is usually observed, which is labelled as humin or hydrochar. Hydrochar is characterised by a high carbon content of around 67 % w/w.28, 29 Hence, the hydrothermal carbonisation especially of agricultural residues features a field of growing importance in order to produce absorbents, fertilizers etc. from renewable resources. Still, formation and molecular structure of hydrochar have not been fully elucidated, yet. While for real biomass it could be demonstrated that the lignin content significantly affects yield and properties of the hydrochar,28 humin obtained from the hydrothermal treatment of pure sugars is considered polycondensated HMF. This is evident from the elemental composition of humin, which complies well with HMF minus one water molecule.29 What kind of condensation reaction takes place, is still matters of discussion. Patil et al.30 propose that intermediate 2,5‐dioxo‐6‐hexanal (DHH) is generated from HMF, which undergoes Aldol condensation with additional HMF and DHH molecules. Jung et al.29 propose that HMF might enolise and enolised HMF undergoes Aldol condensation with HMF. In this work, LC‐MS analysis of hydrothermally treated HMF solution revealed the formation of condensation products of HMF with itself, but also the possibility of a dimerization upon a formal dehydrogenation.
Aldol reactions can be both acid and base catalysed and this work delivers some indications that humin might also form under alkaline conditions, as solid by‐product could be recovered from the treatment of HMF at pH 7 and 8. Other works report that humin is soluble in alkaline media,31 hence low humin yields at elevated pH could have to do with the fact that not all humin is recovered by filtration. Negligible yields of humin from fructose at high initial pH values have to do with the fact that no HMF is formed at these conditions.
3.2.4. Redox Products of HMF
At alkaline conditions HMF forms Cannizzaro reaction products, whereby one HMF molecule serves as oxidant for another HMF molecule. As result, hydroxymethylfuroic acid (HMFA) and bishydroxymethyl furan (BHMF) are generated.32 Although, in this work these compounds could not be detected in the solutions of hydrothermally treated HMF, not even by LC‐MS. Possibly, the pH conditions during the hydrothermal treatment were not sufficiently alkaline. In contrast, HMF oxidation products (DFA, FFA, FDCA) could be detected, however they did not appear prominently, likely because of the limited reserve of oxygen in the autoclave.
3.2.5. Glucose
Monosaccharides undergo isomerisation reactions via the Lobry de Bruyn‐van Ekenstein transformation especially at high pH values. This isomerisation proceeds via an intermediate 1,2‐enediol and is thus reversible. Usually, there is never a complete conversion of one sugar to the respective isomer. Fructose isomerises to glucose and mannose. In a homogeneous, non‐enzymatic process both aldoses should be generated in an equal amount.33 In this work, significant yields of glucose were found especially after the treatment at initial pH≥4. However, the HPLC method used did not allow to distinguish glucose from mannose. Hence, the product labelled as “glucose” must be considered the sum of glucose and mannose formed.
With regard to the HMF production from glucose containing substrates, the isomerisation into fructose features an additional challenge. Therefore, it is interesting that the isomerisation works even under relatively low pH values (even though it is the isomerisation of fructose into glucose in this case).
3.2.6. Lactic Acid
Intermediate 1,2‐enediol formed from hexoses especially in alkaline media is also considered a lactic acid (LacA) precursor: According to common assumptions the enediol undergoes a reverse aldol reaction to glyceraldehyde and dihydroxyacetone, which are in an equilibrium with each other. Dihydroxyacetone is then, possibly via a triose endiol, converted into pyruvaldehyde, which undergoes a benzilic acid rearrangement to form lactic acid.12, 34, 35 However, it has also been reported that a reverse aldol condensation of hexoses may also generate erythrose along with glycolaldehyde.36 In this context different works show that both erythrose and glycolaldehyde also react to lactic acid.11, 37 It is reasonable, that within this work the highest LacA yields were obtained at the highest initial pH values, as both enolisation and benzilic acid rearrangement are catalysed by bases. However, the results also show that the formation of glucose from fructose is more efficient than the formation of LacA, as significant glucose yields were also obtained at pH values, at which almost no LacA was generated. This suggests that the reverse aldol reaction leading to intermediate trioses and tetroses is possibly the rate‐limiting step in the formation of LacA, while the enol‐keto tautomerism proceeds fast.
3.2.7. Acetic Acid
The mechanism of acetic acid (AceA) formation is not well investigated. On the one hand, AceA can be obtained by the oxidation of hydrothermally treated sugar or biomass solutions containing HMF, furfural or lactic acid. Hence, two‐step processes were developed generating much higher AceA yields compared to a direct hydrothermal oxidation of the initial substrate.38, 39 Thus, the yields of AceA in this work might be partially explainable by the presence of oxygen or other oxidants in the reactor leading to an oxidation of HMF and LacA, respectively. On the other hand, it has been reported that hexoses may generate 1,6‐anhydroglucose and erythrose via intramolecular condensation and reverse aldol reaction, respectively, and it has been demonstrated that those react to acetic acid as well.36 In this work, the highest AceA yields were found at the highest pH values suggesting a correlation between AceA and LacA formation. Obviously, AceA is generated from reverse aldol condensation products and it is a decarbonylation product of LacA.37
3.2.8. Formic Acid
Formic acid (FA) is a known side‐product from LevA formation. Also, the formation of furfuryl alcohol, an alternative LevA precursor, is accompanied by FA generation.8 Besides, FA is observed as by‐product of the chemical LacA production from carbohydrates10, 11, 12 and as an oxidation product of carbohydrates .38 In this work, FA was found in low amounts at all initial pH values.
3.2.9. Furfural
Furfural was detected within this work in literally negligible concentrations (and hence not further considered in the kinetic models). Usually, furfural is generated from pentoses like HMF is generated from hexoses. It is suggested, that small amounts of hexose can form the respective pentose at hydrothermal conditions, which subsequently reacts to furfural.20, 40
3.3. Yields of Degradation Products
Kinetic modelling was used to determine the reaction rate constants, which can be used to predict the amount of educt, intermediates and products as a function of reaction time. For this, two models were applied differing concerning the formation of AceA: in model 1, AceA is a product of fructose, in model 2, AceA is a product of HMF and LacA. While the predicted product yields fit well with the experimental ones, the extrapolated yields are not readily reliable. On the one hand, this is due to the simplified assumptions made within the models. On the other hand, the prominence of the different reaction paths does not only depend on the initial pH value, but rather on the effective pH value, that is a function of reaction time, buffer capacity and initial amount of fructose. In this work, these parameters were not varied, as the aim was to gain a fundamental understanding of the principal effect of the pH value on the fructose conversion. For the same reason, the experiments were not repeated. A repetition would have shown the reproducibility of starting solution preparation and reaction temperature rather than the principal effect of the pH value.
The maximal HMF yields are constant in a pH range between 2.2 and 3.0. However, a further increase of the pH leads to a drastic decrease of the maximal HMF yield, which is reasonable, as HMF is formed by a triple dehydroxylation of fructose, which is obligatorily Brønsted acid catalysed.
The maximal LevA yield decreases strongly with increasing pH, which is in accordance with other works.6, 9 At pH 4 and higher literally no LevA formation takes place.
The highest maximal humin yields are found at pH 3, for which there are two reasons: first, as humin is considered to form from HMF, less humin is yielded, if less HMF is generated. This is the case at pH values above 3. At pH values below 3, HMF is consumed via other pathways, especially forming LevA, at the expense of humin.
Concerning the maximum glucose yields, both models provide similar values. According to them, the glucose yield increases with increasing pH value, which is reasonable, as the Lobry de Bruyn‐van Ekenstein transformation is catalysed by bases.
Also, the maximal LacA yields increase with increasing pH value, which makes sense, as LacA is formed from an intermediate of the Lobry de Bruyn‐van Ekenstein transformation. Both models provide similar values, except for the pH range 6–8, where LacA is considered an AceA precursor in model 2 and the maximal LacA yields are thus lower compared to model 1.
Logically, the maximal AceA yields are the most affected by the choice of the model. According to model 1, the maximal yields are similar in a pH range between 2.2 and 4.0 and then increasing with increasing pH value. This trend fits quite well to the experimental observations, in which the lower initial pH values yielded less LacA than the higher initial pH values. According to model 2, there seems to be a minimum in the LacA formation at pH 4. In general, the maximum AceA yields are higher according to model 2, as there are less competitors with the AceA formation. Overall, the maximal AceA yields are the least resilient among all predicted values. AceA is not only considered a final product, of which maximal yields are achieved after a much longer reaction time than investigated and of which possible degradation is neglected. Its formation possibly also requires oxygen or another oxidant to some extent, which is not available infinitely within the reactor.
3.4. Activation Energies of the HMF, Levulinic Acid and Humin Formation
As the initial pH values 2.2 and 3.0 were stable over the whole reaction time at 140 °C, it was reasonable to determine the activation energies of the most prominent conversions under these conditions: the formation of HMF, LevA and humin (Table 4).
For humin formation the EA is constant at around 106–107 kJ mol−1, on the other hand for the preliminary and competing reactions respectively dehydration of fructose to HMF and rehydration of HMF to LevA, the EA increases with increasing pH. This result is surprising in the first moment, as one would expect a decrease of EA with increasing catalyser amount, but examples in the literature show that this is not new for dehydration41 as well as the rehydration14, 41 reaction. The authors interestingly did not mention that variable activation energy, but simply averaged them. This course of action might be doubtful, as the deviation is very strong for the rehydration reaction, but lower for the dehydration. The results in this work are in agreement with those findings from the literature and point out that especially the reaction mechanism for the rehydration is missing some crucial information. The unusual correlation between EA and pH value is explainable by the fact that the reaction paths modelled are no elementary reactions. Therefore, the k‐value determined as well as the related EA correspond more or less to the slowest elementary reaction, i. e. rate‐limiting step. Obviously, the rate‐limiting step of the humin formation is not acid (or base) catalysed and, hence, not affected by a change of the pH value. In the case of HMF and LevA formation, the rates of the elementary reactions change with increasing pH value in a way that another step becomes rate‐limiting bearing another EA. Therefore, it is not reasonable to use the assumption of a pH‐independent EA as basis of a kinetic model.
Tan‐Soetedjo et al.42 provided a broad summary of EA from literature that have been fitted to the reaction network and illustrate the high variability. Many studies have in common that they assume a constant EA, but multiply proton concentration with the pre‐exponential factor.15, 26, 42, 43, 44, 45, 46 The predictability of the experimental data by the model is mostly very accurate, therefore wrong model formulations are difficult to detect. It is likely that models that uses the proton concentration as factor in the pre‐exponential term are flexible enough to capture the variation in reaction speed, which arises through variation of proton concentration, but this does not mean that model is correct. In the framework of one kinetic study the problem might not be visible, but a comparison among different studies proves that current model formulations are missing some information. In order to better understand the Brønsted‐acid catalysed conversion of sugars to HMF and LevA future studies need to find the origin of the variable activation energy found in this reaction network.
3.5. Importance for Industrial Biomass Conversion
Considering the experimental yields of fructose degradation products upon hydrothermal treatment it has to be stated that in the most cases only low, economically not relevant yields could be achieved. This has to do with the fact that the formation of some products, like LevA, requires acid catalysts and therefore the conditions were too mild. The formation of other products, like LacA, requires basic conditions, which were not provided in a sufficient extent and stability. For a third category of products, i. e. humins, the reaction temperature was too low and the reaction time was too short in order to achieve high yields. Although, it is intriguing to note that relatively high HMF yields could be produced at pH 2.2 and 3.0. Interestingly, they are not just constant in a pH range between 2.2 and 3.0, they are also similar to those determined when different Brønsted acids were used in a pH range between 1.0 and 2.0 within a previous publication.9 This means that for obtaining maximal HMF yields pH 3 is sufficient and no benefit is gained by applying higher amounts of acids, except that more acidic conditions accelerate the reaction. However, a faster reaction can also be achieved by applying higher temperatures. Of course, it will be necessary to evaluate what would be more beneficial from an economic and ecologic point of view: a low amount of acid or a lower temperature. Still, this finding might be relevant for such processes that do not already use strongly acidic conditions for the biomass pretreatment, e. g. because enzymes are applied, or that do not need a pretreatment step, because the carbohydrates are already dissolved in the initial substrate. Those might even waive the addition of an acid catalyst.
The application of mildly acidic condition could be also advantageous for the isolation of HMF. As HMF is more stable under these conditions, the maximum titre can be maintained over a longer residence time range. This renders the process more stable and less sensitive to variations of the feed composition, which often affects the reaction rate. Furthermore, there should be less impairment by LevA at higher pH values: first, because less LevA is formed, and second, because LevA has a higher degree of dissociation and is therefore less prone to go into the organic solvent in a liquid‐liquid extraction.47
Another product of which relevant yields could be detected is glucose. While it is not really interesting to produce glucose from fructose, the reverse reaction, i. e. the formation of ketoses from aldoses, might be important, if the subsequent production of HMF is targeted. Unlike fructose, glucose is an abundant sugar. However, as an aldose it gives worse HMF yields, which is why non‐environmentally‐friendly catalysts like boric acid48, 49 or CrCl3 16, 24 are used to increase the yield by in situ isomerisation. Ex situ approaches apply an additional isomerisation step in which heterogeneous catalysts are used,50, 51 which however are not stable under acidic conditions. This work demonstrates that slightly acidic pH values, maybe around 4, might serve as an alternative, as they sufficiently facilitate the Lobry de Bruyn‐van Ekenstein transformation of aldoses into the respective ketoses and, hence, increase the HMF yield in a one‐pot process.
3.6. Error Sources
The results in this work are affected by a number of error sources.
A dominate error source are deviations from the target temperature. As a rule of thumb, the reaction rate is doubled to tripled by an increase in temperature of 10 K. In this work, the reaction temperature was approximately 2.5 K above the target temperature because of the heating device used. This should lead to an increase in reaction rate or reaction rate constant, respectively, of approximately 20 %. However, as the deviation was systematic and constant in all experiments, the comparability of the results is not affected.
A minor error source consists in the quantification of the product yields and educt conversion. The HPLC analysis was precise bearing a random error of roughly 2 % of the respective signal intensity (i. e. a yield of 5.0 mol % has an uncertainty of ±0.1 mol %). An exception features humin, which was quantified by gravimetry. Here, the error was ±1 mg because of the balance used, which corresponds to a yield of approximately ±0.3 mol %. Still, these errors are too small to be displayed in the respective figures.
The effect of pH value deviations is ambivalent. On the one hand, the initial pH value was within a range of ±0.05, which should literally have no impact on the accuracy of the results. On the other hand, the pH value was not stable in the course of the reaction, except for pH 2.2 and 3.0. In principle, this instability of the pH value is not an error, but a side effect: some fructose degradation products are acids, which lower the pH value; the buffer is able to level this acidification to some extent. Although, the degree of pH instability is affected by the preparation of the starting solution, i. e. by deviations in the fructose concentration or buffer capacity. However, in this work, the actual concentrations did not deviate more than 2 % from the target concentrations.
4. Conclusion
It has been demonstrated that fructose readily decomposes at hydrothermal conditions and initial pH values between 2.2 and 8.0. While at lower pH values mainly HMF, LevA and humin are generated, LacA and AceA are produced at higher pH values. Interestingly, the yield of HMF at pH 3 was as high as at more acidic conditions. The application of moderate acidic conditions might therefore be beneficial for the hydrothermal production of HMF in an industrial scale, as, first, the rehydration of HMF into levulinic acid is suppressed and, second, the isomerisation of hexoses is accelerated. The latter fact is relevant, if not ketohexoses, but less reactive aldohexoses, such like glucose, are used as substrate for HMF production.
Concerning the kinetic modelling, difficulties were encountered especially when one substance was assumed to be generated from more than one educt. This has to do with the fact that not for all products the exact pathway of formation is known, which renders the kinetic model too simple to handle all substances precisely. A deeper elucidation of the underlying mechanisms and intermediates features an important subject of future investigations.
Conflict of interest
The authors declare no conflict of interest.
Supporting information
As a service to our authors and readers, this journal provides supporting information supplied by the authors. Such materials are peer reviewed and may be re‐organized for online delivery, but are not copy‐edited or typeset. Technical support issues arising from supporting information (other than missing files) should be addressed to the authors.
Supplementary
Acknowledgements
The work of Paul Körner was supported by a State Graduate Scholarship and is part of the bioeconomy graduate program BBW ForWerts. Special thanks are given to the Paul and Yvonne Gillet Foundation, who supported Dennis Jung with a generous grant. Many thanks to Vladimir Ondrus for performing the vacuum distillation of HMF. Many thanks to Iris Klaiber for performing the LC‐MS measurements.
P. Körner, D. Jung, A. Kruse, ChemistryOpen 2019, 8, 1109.
References
- 1. Kruse A., Dinjus E., J. Supercrit. Fluids 2007, 39, 362–380. [Google Scholar]
- 2. Kruse A., Dahmen N., J. Supercrit. Fluids 2015, 96, 36–45. [Google Scholar]
- 3. Yang L., Yan X., Xu S., Chen H., Xia H., Zuo S., RSC Adv. 2015, 5, 19900–19906. [Google Scholar]
- 4. Xia H., Hu H., Xu S., Xiao K., Zuo S., Biomass Bioenergy 2018, 108, 426–432. [Google Scholar]
- 5. Asghari F. S., Yoshida H., Ind. Eng. Chem. Res. 2006, 45, 2163–2173. [Google Scholar]
- 6. Asghari F. S., Yoshida H., Ind. Eng. Chem. Res. 2007, 46, 7703–7710. [Google Scholar]
- 7. Yang G., Pidko E. A., Hensen E. J. M., J. Catal. 2012, 295, 122–132. [Google Scholar]
- 8. Yang L., Tsilomelekis G., Caratzoulas S., Vlachos D. G., ChemSusChem 2015, 8, 1334–1341. [DOI] [PubMed] [Google Scholar]
- 9. Körner P., Jung D., Kruse A., Green Chem. 2018, 20, 2231–2241. [Google Scholar]
- 10. Yan X., Jin F., Tohji K., Moriya T., Enomoto H., J. Mater. Sci. 2007, 42, 9995–9999. [Google Scholar]
- 11. Yan X., Jin F., Tohji K., Kishita A., Enomoto H., AIChE J. 2010, 56, 2727–2733. [Google Scholar]
- 12. Esposito D., Antonietti M., ChemSusChem 2013, 6, 989–992. [DOI] [PubMed] [Google Scholar]
- 13. Horvat J., Klaic B., Metelko B., Sunjic V., Croat. Chem. Acta 1986, 59, 429–438. [Google Scholar]
- 14. Chang C., Ma X., Cen P., Chin. J. Chem. Eng. 2006, 14, 708–712. [Google Scholar]
- 15. Weingarten R., Cho J., Xing R., Conner W. C., Huber G. W., ChemSusChem 2012, 5, 1280–1290. [DOI] [PubMed] [Google Scholar]
- 16. Binder J. B., Cefali A. V., Blank J. J., Raines R. T., Energy Environ. Sci. 2010, 3, 765–771. [Google Scholar]
- 17. Wang C., Fu L., Tong X., Yang Q., Zhang W., Carbohydr. Res. 2012, 347, 182–185. [DOI] [PubMed] [Google Scholar]
- 18. Wrigstedt P., Keskiväli J., Leskelä M., Repo T., ChemCatChem 2015, 7, 501–507. [Google Scholar]
- 19. Weiqi W., Shubin W., Chem. Eng. J. 2017, 307, 389–398. [Google Scholar]
- 20. Antal M. J., Mok W. S. L., Richards G. N., Carbohydr. Res. 1990, 199, 91–109. [DOI] [PubMed] [Google Scholar]
- 21. Caratzoulas S., Vlachos D. G., Carbohydr. Res. 2011, 346, 664–672. [DOI] [PubMed] [Google Scholar]
- 22. Assary R. S., Kim T., Low J. J., Greeley J., Curtiss L. A., Phys. Chem. Chem. Phys. 2012, 14, 16603–16611. [DOI] [PubMed] [Google Scholar]
- 23. van Putten R. J., Soetedjo J. N. M., Pidko E. A., van der Waal J. C., Hensen E. J. M., De Jong E., Heeres H. J., ChemSusChem 2013, 6, 1681–1687. [DOI] [PubMed] [Google Scholar]
- 24. Binder J. B., Raines R. T., J. Am. Chem. Soc. 2009, 131, 1979–1985. [DOI] [PubMed] [Google Scholar]
- 25. van Putten R.-J., van der Waal J. C., de Jong E., Rasrendra C. B., Heeres H. J., de Vries J. G., Chem. Rev. 2013, 113, 1499–1597. [DOI] [PubMed] [Google Scholar]
- 26. Swift T. D., Bagia C., Choudhary V., Peklaris G., Nikolakis V., Vlachos D. G., ACS Catal. 2014, 4, 259–267. [Google Scholar]
- 27. Rackemann D. W., Doherty W. O. S., Biofuels Bioprod. Biorefin. 2012, 5, 198–214. [Google Scholar]
- 28. Rodríguez Correa C., Stollovsky M., Hehr T., Rauscher Y., Rolli B., Kruse A., ACS Sustainable Chem. Eng. 2017, 5, 8222–8233. [Google Scholar]
- 29. Jung D., Zimmermann M., Kruse A., ACS Sustainable Chem. Eng. 2018, 6, 13877–13887. [Google Scholar]
- 30. Patil S. K. R., Lund C. R. F., Energy Fuels 2011, 25, 4745–4755. [Google Scholar]
- 31. Van Zandvoort I., Koers E. J., Weingarth M., Bruijnincx P. C. A., Baldus M., Weckhuysen B. M., Green Chem. 2015, 17, 4383–4392. [Google Scholar]
- 32. Subbiah S., Simeonov S. P., Esperança J. M. S. S., Rebelo L. P. N., Afonso C. A. M., Green Chem. 2013, 15, 2849–2853. [Google Scholar]
- 33. Usuki C., Kimura Y., Adachi S., Food Sci. Technol. Res. 2007, 13, 205–209. [Google Scholar]
- 34. Gibbs M., J. Am. Chem. Soc. 1950, 72, 3964–3965. [Google Scholar]
- 35. Jin F., Zhou Z., Enomoto H., Moriya T., Higashijima H., Chem. Lett. 2004, 33, 126–127. [Google Scholar]
- 36. Kabyemela B. M., Adschiri T., Malaluan R. M., Arai K., Ind. Eng. Chem. Res. 1999, 38, 2888–2895. [Google Scholar]
- 37. Kishida H., Jin F., Yan X., Moriya T., Enomoto H., Carbohydr. Res. 2006, 341, 2619–2623. [DOI] [PubMed] [Google Scholar]
- 38. Jin F., Zhou Z., Moriya T., Kishida H., Higashijima H., Enomoto H., Environ. Sci. Technol. 2005, 39, 1893–1902. [DOI] [PubMed] [Google Scholar]
- 39. Jin F., Zhou Z., Kishita A., Enomoto H., J. Mater. Sci. 2006, 41, 1495–1500. [Google Scholar]
- 40. Steinbach D., Kruse A., Sauer J., Vetter P., Energies 2018, 11, 645–659. [Google Scholar]
- 41. Bienkowski P. R., Ladisch M. R., Narayan R., Tsao G. T., Eckert R., Chem. Eng. Commun. 1987, 51, 179–192. [Google Scholar]
- 42. Tan-Soetedjo J. N. M., Van De Bovenkamp H. H., Abdilla R. M., Rasrendra C. B., Van Ginkel J., Heeres H. J., Ind. Eng. Chem. Res. 2017, 56, 13228–13239. [DOI] [PMC free article] [PubMed] [Google Scholar]
- 43. Girisuta B., Janssen L. P. B. M., Heeres H. J., Chem. Eng. Res. Des. 2006, 84, 339–349. [Google Scholar]
- 44. Girisuta B., Janssen L. P. B. M., Heeres H. J., Chem. Eng. Res. Des. 2006, 84, 339–349. [Google Scholar]
- 45. Girisuta B., Janssen L. P. B. M., Heeres H. J., Ind. Eng. Chem. Res. 2007, 46, 1696–1708. [Google Scholar]
- 46. Shen J., Wyman C. E., AIChE J. 2012, 58, 236–246. [Google Scholar]
- 47. Liu F., Sivoththaman S., Tan Z., Sustain. Eviron. Res. 2014, 24, 149–157. [Google Scholar]
- 48. Hansen T. S., Mielby J., Riisager A., Green Chem. 2011, 13, 109–114. [Google Scholar]
- 49. Ståhlberg T., Rodriguez-Rodriguez S., Fristrup P., Riisager A., Chem. Eur. J. 2011, 17, 1456–1464. [DOI] [PubMed] [Google Scholar]
- 50. Graça I., Iruretagoyena D., Chadwick D., Appl. Catal. B 2017, 206, 434–443. [Google Scholar]
- 51.I. K. M. Yu, X. Xiong, D. C. W. Tsang, L. Wang, A. J. Hunt, H. Song, J. Shang, Y. S. Ok, C. S. Poon, Green Chem., DOI:10.1039/C8GC02466 A.
Associated Data
This section collects any data citations, data availability statements, or supplementary materials included in this article.
Supplementary Materials
As a service to our authors and readers, this journal provides supporting information supplied by the authors. Such materials are peer reviewed and may be re‐organized for online delivery, but are not copy‐edited or typeset. Technical support issues arising from supporting information (other than missing files) should be addressed to the authors.
Supplementary


