Figure 8.

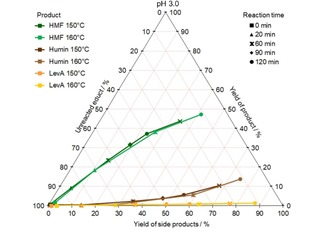
CYS plot of the formation of HMF, humin and LevA from fructose at pH 3.0 and different temperatures; values given in mol %.

CYS plot of the formation of HMF, humin and LevA from fructose at pH 3.0 and different temperatures; values given in mol %.