

Abstract
Despite the major impact of mosquitoes on human health, knowledge gaps exist regarding their natural population dynamics. Even the most basic information—such as spatiotemporal abundance—is mostly unavailable. In the USA, municipalities have created agencies for mosquito control and monitoring, yet no national open-access repository for mosquito surveillance data exists. Vectors, and the pathogens they transmit, know no jurisdictions. We identify >1,000 mosquito control agencies and identify those which make their population abundance surveillance data publicly available. We directly survey Floridian mosquito districts to estimate, from one state alone, the potential amount of hidden data. We generate a large, standardized data set from publicly available online data and demonstrate that spatiotemporal population abundance can be reconstructed and analyzed across data generators. We propose that the ensemble of US mosquito control agencies can, and should, be used to develop a national—and potentially international—open-access repository of mosquito surveillance data, generating the data capital needed to gain a mechanistic understanding of vector population dynamics, and identify existing digital infrastructure that could be leveraged for digitizing and collating extant and future surveillance data for such a repository.
Keywords: Arbovirus, Big Data, open data, surveillance, Zika
INTRODUCTION
Vector-transmitted infectious diseases pose a threat to public health worldwide, with mosquito-borne infections alone infecting more than a billion people per year. Due to the limited number of vaccines for vector-borne diseases, vector control is often the primary means to prevent outbreaks. Over the past century, municipalities across the USA have periodically launched mosquito control agencies to tackle existing or emerging disease threats, including the Aedes aegypti (L.) eradication initiative in the Americas (1947–70), the malaria eradication program in the southern USA (1947–51), and the efforts to control West Nile virus after its 1999 introduction into the USA.
Mosquito control agencies perform routine surveillance by trapping mosquitoes to estimate their abundance and inform local efforts (CDC 2013, NACCHO 2016). Importantly, the primary role of mosquito control agencies is to locally mitigate vector populations; they carefully trap and taxonomically identify mosquitoes to monitor temporal changes in their populations. These agencies, therefore, generate long-term ecological time series of mosquito abundance, which collectively represent unprecedented ecological data that are spatially, temporally, and taxonomically rich. In addition, some agencies also perform in-depth phenotyping for insecticide resistance and arbovirus infection. If the USA were to create a shared database of standardized mosquito population data, it could set the precedent for expanding such efforts to other disease vectors and being adopted by other countries that have vector control within local jurisdictions. The database would, in itself, also provide scientific and public health communities with highly resolved spatiotemporal data on mosquito disease vectors. These data could inform decision-making, empower new interventions, and lead to ecological insights, all by leveraging preexisting human efforts, operational infrastructure, and investments by taxpayers.
In the USA, clinical cases of selected mosquito-borne infectious diseases are nationally notifiable (Rosenberg et al. 2018). States report data to the Centers for Disease Control and Prevention (CDC), either through ArboNET or the National Notifiable Disease Surveillance System, and summary data are published in the Morbidity and Mortality Weekly Report and on CDC’s arboviral disease-specific websites. If a mosquito-data repository existed, it would warehouse the vast amount of mosquito surveillance data collected over decades, and these data could be cross-linked with existing human case data. Here we 1) identify mosquito control agencies that could cross-link their data, 2) identify existing digital infrastructure that could be leveraged for digitizing and collating extant and future surveillance data, 3) demonstrate data can be cross-linked by collating those available from a subset of the agencies we identified, and 4) survey Floridian mosquito abatement districts to estimate the amount of hidden data that may exist.
MATERIAL AND METHODS
There are approximately 1,000 mosquito control agencies in the USA, with a mosquito control agency broadly defined as the local government authority responsible for the surveillance and control of mosquitoes. In general, mosquito control responsibilities lie with the local health or sanitation department, or separate dedicated entities such as mosquito abatement districts.
We systematically searched online to identify mosquito control agencies within the USA. Specifically, we used 1) Google searches, 2) the American Mosquito Control Association website, 3) state government websites (e.g., Florida Department of Agriculture & Consumer Services), and 4) state mosquito control association webpages (e.g., Texas, Michigan, and California) to find the names and locations of mosquito control agencies. We then supplemented our list of mosquito control agencies by cross-referencing it with a list of mosquito control agencies generated by a joint effort of the CDC and the National Pesticide Information Center (NPIC 2018). For each agency identified (Table S1), we searched for a web presence, either an agency website or agency representation in a statewide mosquito abundance repository (e.g., such as those that exist for Iowa, New Jersey, North Dakota, and South Dakota [Table 1]). The mosquito control agency websites/repositories were searched for the presence of mosquito abundance surveillance data at a temporal resolution of daily, weekly, and/or monthly from 2009 to mid-2016.
Table 1.
Existing leverageable digital infrastructure for building a nationwide mosquito data repository: Statewide surveillance networks.
| State | Agency-institution | Web link |
|---|---|---|
| California | CalSurv (California Vectorborne Disease Surveillance System) | http://www.calsurv.org |
| North Dakota | North Dakota Department of Health | https://ndhealth.gov/wnv |
| South Dakota | Mosquito Information Systems, South Dakota State University and the South Dakota Department of Health | mosquito.sdstate.edu |
| Iowa | Iowa State University | https://mosquito.ent.iastate.edu |
| Pennsylvania | Department of Environmental Protection | http://www.westnile.state.pa.us |
| Connecticut | The Connecticut Agricultural Experiment Station | http://www.ct.gov/caes |
| New Jersey | Rutgers-New Jersey Agricultural Experiment Station | https://vectorbio.rutgers.edu/reports/mosquito |
| Georgia | Georgia Department of Public Health | https://dph.georgia.gov/environmental-health |
| Montana | Mosquito and Vector Surveillance Program, Montana State University Extension-Department of Animal and Range Sciences | https://django.msu.montana.edu/MTmosquito/ |
We used data from fixed traps. Data from temporary traps were excluded because they cannot be adequately used to reconstruct time series of abundance. The data we excluded, however, could be used for presence/absence studies. We considered only agencies with data presented in a mineable format such as online tables, graphs, and geographic information system (GIS) maps where population abundance could be followed over time. All data were limited to what was publicly available online.
As for the statewide mosquito repositories, we would like to note that North Dakota has a statewide surveillance system and local control operations. Therefore, in this work, when we refer to agencies in North Dakota, we are referring to local (county level) collection efforts, which are administered at the state level. Iowa has a statewide surveillance system, with uniform collection dates, species identified, data format, and seasonal collection window. We collated only a subset of the agency-level data from Iowa.
In addition to identifying control agencies and collating data, we conducted a self-administered, online survey with a census of Florida mosquito control programs with different funding structures (n = 65) in March-May 2017, a year after the Zika outbreak. This allowed us to understand the amount of surveillance data that is unreported, in a state hit by the recent Zika virus epidemic and a state without a centralized system for open-access data. A list of mosquito control districts, and county and municipal programs were obtained from the Florida Mosquito Control Association (for registered programs) and the Florida Department of Agriculture and Consumer Services (for unregistered programs). The questionnaire included 110 questions about program/agency characteristics, capacity to implement vector-borne disease surveillance and control, use of pesticide products, staffing, facilities, equipment, and training needs. We restricted results in this article to the questions pertaining to willingness to share mosquito surveillance data.
RESULTS
We systematically searched (see Material and Methods) online and identified 1,054 mosquito control agencies scattered throughout the contiguous USA (Table S1). We broadly define a control agency as the local government authority responsible for mosquito control and surveillance. We attempted to locate an online presence for each agency identified. A total of 152 agencies had publicly available open-access data (i.e., live weekly/monthly updates and/or archived data). We collated all publicly available data from 2009 to 2015, which included mineable formats such as tables, graphs, spreadsheets, or GIS maps from fixed trapping locations.
A total of 148 agencies (14%) across 21 states had live data from the present year or archived data from previous years. Iowa, New Jersey, Montana, and North Dakota have statewide open-access weekly surveillance dating back to 1969, 2003, 2004, and 2006, respectively. Some agencies provided trap-level data, while others reported mosquito counts aggregated from a geographic area: for example, a park, jurisdiction, or an ecological region.
In total, our data set contained reports from >600 unique agency-defined locations, >39,000 instances when traps were checked, approximately 200,000 records, and documented >15 million individual mosquitoes (Table S2). Records were each time-stamped with a collection date and geo-referenced. Taxonomic identification and resolution of reporting varied among districts. Often, mosquito reports were at the genus level; but 56 data sources reported species-level data for at least a subset of mosquitoes, reflecting local knowledge of, and interest in, disease vector and nuisance species. With >15 million mosquitoes trapped and identified by biologists on the ground (Fig. 1), these data represent a major scientific effort and substantial payout of taxpayer dollars.
Fig. 1.
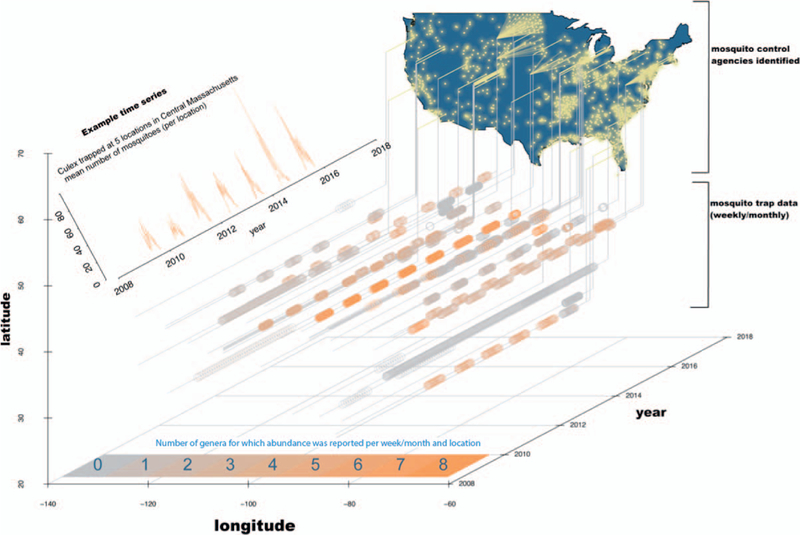
Map indicating the location of mosquito control agencies we identified (yellow points). Some agencies made their data publicly available (those with a line projection; see Table S1). Time series (gray and orange circles) show the collection dates and the number of genera whose abundance was reported in our data. Each time series represents 1 data silo (see Table S2). Despite the enormous amount of data (shown are >39,000 trap collections), far more exist. Each agency is a potential data source. (inset) Example time series of Culex abundance from one agency, the Central Massachusetts Mosquito Control Project, which had 5 trap locations in their jurisdiction. Culex is of epidemiological interest because it is the genus containing species that transmit West Nile virus.
Importantly, the data we collated are merely the tip of the iceberg. We focused on data from 2009 to 2015 and captured only the small fraction of extant data that were available online in a mineable format. Figure 1 highlights the geographical coverage of mosquito monitoring, the number of identified data silos, and the extent of data that were publicly available. In addition to mosquito abundance, which was the focus of this study, the proposed repository could be made to include data on insecticide resistance and arbovirus presence in mosquitoes. The majority of data remain hidden because there is no centralized open-access repository and most agencies do not maintain webpages for reporting. Subsequent follow-up conversations with a subset of the data holders and generators, including those that do not currently make their data publicly available, revealed a frequent (but in no way exclusive) enthusiasm for data sharing. Many of these data holders indicated that they had more data, and higher resolution data, than currently made available online and they were willing to share these data.
To demonstrate that mosquito surveillance data taken from multiple data generators across multiple silos could be brought together to reconstruct spatiotemporal abundance patterns, we searched our compiled data for a taxonomic group for which we have 3+ years of data from multiple states. Data from Culex pipiens Linnaeus in Minnesota, Iowa, and California fit these criteria and were of particular interest because Cx. pipiens is the vector of West Nile virus (Fig. 2). We are able to reconstruct that the Cx. pipiens season is restricted to a narrow time frame (late summer) in Minnesota (Fig. 2A), the most northern of the 3 states. In Iowa and California, the Cx. pipiens season extended later into the fall (Fig. 2B, 2C). In California, the Cx. pipiens season begins in the early spring. This demonstrates it is possible to unify mosquito abundance data collected by different people, using different collection protocols, and different reporting protocols (e.g., “females per trap-night,” “mosquitoes,” and “mean capture–CO2 traps”). For any given taxonomic group, seasonal phenology may vary geographically due to variation in environmental conditions. We acknowledge that California spans a large latitudinal range, and the springtime presence of Cx. pipiens may be localized within the state; therefore, by aggregating data to the state level, we may have masked geographic variation within California.
Fig. 2.
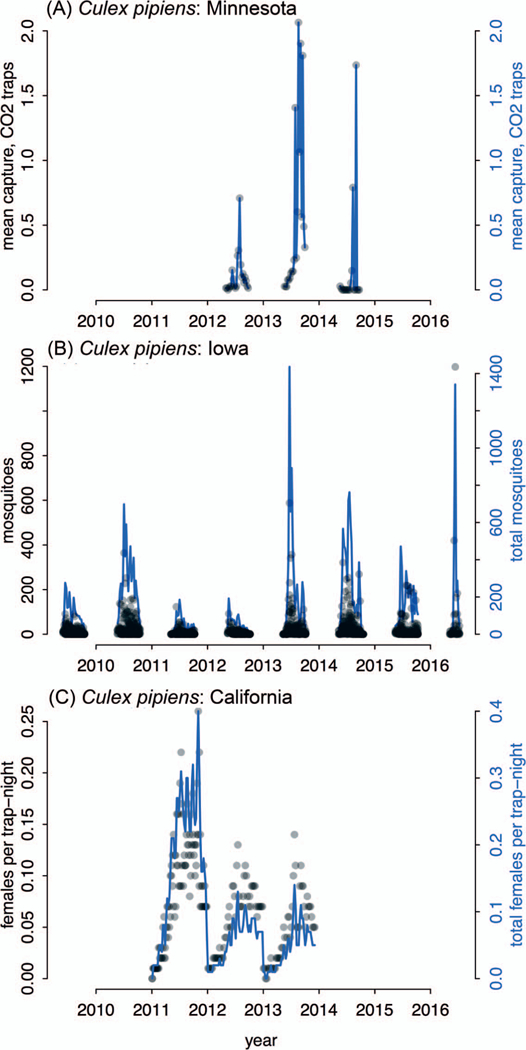
Culex pipiens seasonality from disparate regions of the country can be reconstructed from diverse data silos. We searched the compiled data for taxonomic groups for which we had 3 or more years of data from multiple states. Black points show the raw data from each trap within the state and correspond to the left y-axis. Blue time series are aggregated data across traps within the state, corresponding to the right y-axis.
In addition to identifying control agencies and collating data, we surveyed a subset of agencies, focusing on agencies in Florida because it is a state hit by the recent Zika virus epidemic and it is also a state without a centralized system for open-access data. This allowed us to understand the amount of surveillance that is going on unreported. Of the 65 mosquito control agencies in Florida, 68% (n = 44) completed the survey we sent out. Of those that completed the survey, 68% (n = 30) indicated that their agency conducted adult mosquito surveillance and 57% (n = 25) indicated conducting larval mosquito surveillance. Agency respondents were asked if they trap mosquitoes at fixed trap sites and the majority responded “yes” (84%, n = 26 of 31 agencies responding to this question). Almost a third (30%, n = 13) of the agencies reported performing surveillance at least weekly.
It is important to note, in our data collation exercise, we were able to access surveillance data from only 4 Floridian mosquito control agencies. When asked whether their agency would be willing to share fixed trap locations for a statewide mapping of traps across Florida, 84% (n = 21) of 25 agencies who responded to this question said “yes.” Further, when the agency respondents were asked, “Are the mosquitoes trapped in your jurisdiction identified to species?”, 91% (n = 21) of 23 agencies who responded to this question reported performing species-level identification of collected mosquitoes.
We identified significant amounts of operational (i.e., on the ground) and digital infrastructure for building a national mosquito data repository that already exist. There is, thus, no need to build a network from scratch. Existing digital infrastructure (Table 2) that could be used to house a national repository includes VectorBase, a US National Institute of Allergy and Infectious Diseases Bioinformatics Resource Center, which warehouses genomic and phenotypic data from studies of vectors sampled worldwide. There are also biodiversity databases housing species occurrence records. In order to facilitate sharing, these databases use a data standard known as Darwin Core (Wieczorek et al. 2012) and include generalist databases (i.e., GBIF and iDigBio), SCAN (arthropod records), and VectorMap (which is rich in US military installation mosquito records). We propose these and other digital systems should be actively threaded together to warehouse, share, and display data. For a repository of the type we are proposing, the 1st step could be to have existing statewide mosquito surveillance systems provide their data to existing database providers mentioned above. The data could be standardized into the Darwin Core format. There are statewide surveillance systems in Iowa, North Dakota, Montana, Connecticut, Georgia, Indiana, Arkansas, South Dakota, California, and Pennsylvania (Table 1). The combined data of these 9 states alone would be unparalleled. The repository could then be enhanced by adding data-generators at the county or city level from states lacking a statewide repository. We believe that the recently formed CDC Vector-Borne Disease Regional Centers of Excellence (Table 3) could be a natural choice to lead the flow of information from within their regions to a national vector data repository.
Table 2.
Existing leverageable digital infrastructure for building a nationwide mosquito data repository: Repositories to host collated data.
| Name | Agency and resource | Web link |
|---|---|---|
| VectorMap | Walter Reed Biosystematics Unit Uses DarwinCore common data format | http://vectormap.si.edu |
| MosquitoNET | Centers for Disease Control and Prevention Repository and input gateway for mosquito abundance surveillance | https://wwwn.cdc.gov/Arbonet/MosquitoNET |
| VectorBiTE | Population biology repository for arthropod vectors of disease | http://www.vectorbite.org |
| VectorBase | National Institutes of Health contract Bioinformatic and ecoinformatic repository of arthropod vectors of human disease | https://www.vectorbase.org |
| NEON | National Ecological Observatory Network National Science Foundation open-access data collected from 47 terrestrial sites across the USA. Will use automated instruments and observational field sampling (including vectors) to gather data over 30 years. | https://www.neonscience.org |
Table 3.
Centers for Disease Control and Prevention Vector-Borne Disease Regional Centers of Excellence.
| Region | Lead institution | Web link |
|---|---|---|
| Western Gulf | University of Texas-Galveston | https://www.utmb.edu/wgcvbd |
| Upper Midwestern | University of Wisconsin Madison | http://mcevbd.wisc.edu |
| Northeast | Cornell University | http://neregionalvectorleft.com |
| Southeastern | University of Florida | http://cdcsercoevbd-flgateway.org |
| Pacific Southwest | University of California | http://www.pacvec.us |
DISCUSSION
If a national vector data repository were to be created, one of the most important uses would be as a data source to inform mathematical models of mosquito-borne disease transmission. Mathematical models are relied upon to infer the risk of mosquito-transmitted infectious diseases. It is not possible to monitor individual mosquito-to-human or human-to-mosquito transmission events; therefore, transmission rates must be inferred by fitting transmission models to data. The notification of clinical cases of vector-borne diseases allows for the partial observation of transmission events, but without vector surveillance, we are missing the opportunity to observe a key component of the system: the mosquito population dynamics. Data, both historical and contemporary, from geographically independent regions are critical for model calibration and validation (Acheson and Kerr 2015, Campbell et al. 2015, Monaghan et al. 2016); however, these data are lacking for arboviral disease vectors. Acheson and Kerr (2015) reviewed 29 vector-borne disease modeling publications and revealed the recurrent need for mosquito data. At least 6 of the publications reviewed explicitly claimed insufficient data for model validation (Acheson and Kerr 2015). During the 2016 Zika outbreak, this data gap was particularly acute (Campbell et al. 2015, Hahn et al. 2016, Monaghan et al. 2016). Rich longitudinal data of mosquito abundance would facilitate new analyses relating to mosquito biology and pathogen ecology that would inform routine vector control and could be useful during outbreaks, especially those that impact multiple jurisdictions. It is important to note that mosquito trapping does not provide measures of absolute abundance of vectors. It can, however, be used to infer relative abundance. Data from existing mosquito control agencies represent the breadth of urban and ecological conditions in the USA, and could be used to gain mechanistic insight into the factors regulating vector populations and the pathogens they carry (Sugihara et al. 2012, Costello et al. 2013). A national vector data repository would allow for the study of the points highlighted below. We would like to stress that even if only a subset of vector control agencies participated from around the country, the following points could be addressed: variation in the relative abundance of vectors (i.e., seasonal variation within a geographic location and variation among geographic locations); mechanisms by which vector populations are regulated (e.g., how temperature or competition impacts vector abundance); local and metapopulation transmission dynamics of vector-borne pathogens; and long-term changes in population structure, relative abundance, and species ranges (e.g., the impact of climate change).
The ability to quantify the relative abundance of vectors throughout the year and across the landscape would be powerful for understanding disease transmission. This is because spatially and temporally resolved relative abundance could be used to identify the window containing the high season for virus transmission within a geographic location, and how this window varies across the landscape. This information—when combined with 1) mechanistic transmission models, 2) data on clinical disease (publicly available through the CDC), and 3) human demography data (publicly available through the US Census)—could be used to reveal pathogen meta-population dynamics and inform disease control and eradication strategies. See Table 4 for example for clinical and demography data sources.
Table 4.
Existing leverageable digital infrastructure for building a nationwide mosquito data repository: Data sources for cross-referencing.
| Database | Agency and resource | Web link |
|---|---|---|
| ArboNET | Centers for Disease Control and Prevention Clinical cases of arbovirus infections in humans, mosquito testing for viruses, and sentinel animal reports | https://diseasemaps.usgs.gov/mapviewer |
| National Land Cover Database | US Geological Survey US-wide 30-m resolution data on land cover/use such as pasture land, cropland, urban, wetland, or forest | https://www.mrlc.gov/nlcd2011.php |
| CDO (Climate Data Online) | National Oceanic and Atmospheric Administration Historical weather and climate data | https://www.ncdc.noaa.gov/cdo-web |
| CCSM 4.0 (Community Climate System Model) | National Center for Atmospheric Research Climate change prediction models | http://www.cesm.ucar.edu/models/ccsm4.0 |
| MMWR (Morbidity and Mortality Weekly Report) | Centers for Disease Control and Prevention (CDC) Weekly disease reports to the CDC by state health departments | https://cdc.gov/mmwr |
| US National Vital Statistics System | Centers for Disease Control and Prevention Human demography data | https://cdc.gov/nchs/nvss |
| US Census | US Census Bureau Human demography data | https://census.gov/data.html |
As for mosquito population biology, the observed spatiotemporal variation in vector abundance can be used to study how climate and ecological factors regulate vector populations. For instance, vector abundance time series may be combined with other sources of data, such as land use and meteorological data (Table 4), to determine how climate and vegetation work to shape vector abundance. A mechanistic understanding of how climate and ecological conditions impact vector populations is particularly important under climate change predictions and changes in urbanization (WHO 2014).
The increasing interconnectedness of human populations, global climate change, and the emergence of new vector-borne diseases necessitates diligent vector control that goes beyond jurisdictional boundaries. Mosquito surveillance is currently conducted with large amounts of human labor and expert knowledge and at tremendous taxpayer cost. In some locales, these investments have been ongoing for decades. A national open-access repository of mosquito population data would be a simple low-cost solution for empowering foundational research on mosquito and infectious disease ecology. The CDC, the National Association of County and City Health Officials, and/or the American Mosquito Control Association are organizations that could take the lead in coordinating participation in the effort that we here describe.
As has generally been the case with the recent move toward open-access data in science, there are general concerns about open data, which have been addressed by numerous authors (Roche et al. 2014, Evans 2016). Regarding national mosquito surveillance, there are also quite valid data-standardization concerns. Particularly, the need to account for nonstandardized collection protocols (e.g., different trap types, different attractants, different durations traps are set), but these challenges are not insurmountable and are indeed being addressed. In fact, the VectorBiTE consortium is developing minimal information standards for arthropod spa-tiotemporal data to facilitate data sharing. They are defining the metadata necessary to account for nonstandardized collection protocols (Rund et al. 2018). Despite cross-jurisdictional differences, from our collated data, we were able to reconstruct spatiotemporal abundance patterns across jurisdictions (e.g., Fig. 2). Recent studies have also demonstrated that disparate disease vector data from across multiple silos can be brought together to reveal meaningful insights. These include biting midge trap data from 9 European countries brought together to reveal the seasonal spatiotemporal distribution and abundance—despite differences in number of sampling sites per country, trap types, trapping frequency, etc. (Reiskind and Lounibos 2013). Similarly, disparate mosquito data from 4 European countries collected at various time frames and sampling strategies and methods were brought together to model the spatiotemporal dynamics of Cx. pipiens (Chaskopoulou et al. 2016).
Through national surveillance, mosquito control agencies and the public health community would have an excellent opportunity to maximize health and research benefits of mosquito control efforts. We have identified preexisting digital infrastructure that can be leveraged to develop the repository. In the future, the logistics of data streaming will be vastly simplified with automated data collection. Next-generation traps—such as those from Microsoft’s (Redmond, WA) Project Premonition and Biogent’s (Regensburg, Germany) BG-Counter—will connect to cellular networks and have the potential to automatically deliver mosquito population data (and metadata) in real time to a national surveillance system. With new technology on the horizon, the emergence of chikungunya and Zika in the Americas, yellow fever in Brazil, and the momentum behind vector research and control in the USA, we believe the USA is perfectly placed to demonstrate that national vector surveillance can be done and that it will benefit its citizens.
Supplementary Material
ACKNOWLEDGMENTS
This work was possible due to the efforts of the 148 mosquito control agencies who collected mosquito population abundance data and made their data available online. We thank all the Florida Mosquito Control agency representatives who participated in the survey. We also thank research students Nathan Nixon and Ben Weise for their assistance in locating and digitizing data and Paul Hickner, Luke McNally, Cynthia Lord, and Frank Collins for their helpful comments. Micaela Martinez was funded by a US National Science Foundation Postdoctoral Fellowship in Biology, Award Number 1523757, and is currently funded by the NIH Directors Early Independence Award. Research reported in this publication was supported by the Office of the Director, National Institutes of Health, under Award Number DP5OD023l00. Samuel S.C. Rund was funded by the Royal Society (NF140517) and the National Institute of Allergy and Infectious Diseases, National Institutes of Health, Department of Health and Human Services, under Contract Number HHSN272201400029C. Imelda K. Moise and John C. Beier were supported by Cooperative Agreement Number U01CK000510, funded by the Centers for Disease Control and Prevention. The contents are solely the responsibility of the authors and do not necessarily represent the official views of the Centers for Disease Control and Prevention or the Department of Health and Human Services.
Footnotes
Supplemental materials
Supplemental data files have been submitted to Figshare on November 13, 2018 (Table S1 https://doi.org/10.6084/m9.figshare.7335281.v1; Table S2 https://doi.org/10.6084/m9.figshare.7335284.v1).
REFERENCES CITED
- Acheson ES, Kerr JT. 2015. Looking forward by looking back: using historical calibration to improve forecasts of human disease vector distributions. Vector Borne Zoonotic Dis 15:173–183. [DOI] [PubMed] [Google Scholar]
- Campbell LP, Luther C, Moo-Llanes D, Ramsey JM, Danis-Lozano R, Peterson AT. 2015. Climate change influences on global distributions of dengue and chikungunya virus vectors. Philos Trans R Soc Lond B 370:20140135. [DOI] [PMC free article] [PubMed] [Google Scholar]
- CDC [Centers for Disease Control and Prevention]. 2013. West Nile virus in the United States: guidelines for surveillance, prevention, and control [Internet]. Fort Collins, CO: Centers for Disease Control and Prevention, National Center for Emerging and Zoonotic Infectious Diseases Division of Vector-Borne Diseases; [accessed August 12, 2018]. Available from: https://www.cdc.gov/westnile/resources/pdfs/wnvGuidelines.pdf. [Google Scholar]
- Chaskopoulou A, L’Ambert G, Petric D, Bellini R, Zgomba M, Groen TA, Marrama L, Bicout DJ. 2016. Ecology of West Nile virus across four European countries: review of weather profiles, vector population dynamics and vector control response. Parasit Vectors 9:482. [DOI] [PMC free article] [PubMed] [Google Scholar]
- Costello MJ, Michener WK, Gahegan M, Zhang ZQ, Bourne PE. 2013. Biodiversity data should be published, cited, and peer reviewed. Trends Ecol Evol 28:454–461. [DOI] [PubMed] [Google Scholar]
- Evans SR. 2016. Gauging the purported costs of public data archiving for long-term population studies. PLoS Biol 14:e1002432. [DOI] [PMC free article] [PubMed] [Google Scholar]
- Hahn MB, Eisen RJ, Eisen L, Boegler KA, Moore CG, McAllister J, Savage HM, Mutebi J. 2016. Reported distribution of Aedes (Stegomyia) aegypti and Aedes (Stegomyia) albopictus in the United States, 1995–2016 (Diptera: Culicidae). J Med Entomol 53:1169–1175. [DOI] [PMC free article] [PubMed] [Google Scholar]
- Monaghan AJ, Morin CW, Steinhoff DF, Wilhelmi O, Hayden M, Quattrochi DA, Reiskind M, Lloyd AL, Smith K, Schmidt CA, Scalf PE, Ernst K. 2016. March 16 On the seasonal occurrence and abundance of the Zika virus vector mosquito Aedes aegypti in the contiguous United States. PLoS Curr Outbreaks 8 10.1371/currents.outbreaks.50dfc7f46798675fc63e7d7da563da76 [DOI] [PMC free article] [PubMed] [Google Scholar]
- NACCHO [National Association of County and City Health Officials]. 2016. Mosquito surveillance and control assessment in Zika virus priority jurisdictions [Internet]. Washington, DC: National Association of County and City Health Officials; [accessed August 12, 2018]. Available from: https://www.naccho.org/uploads/downloadable-resources/VectorAssessmentDec2016NACCHO.pdf. [Google Scholar]
- NPIC [National Pesticide Information Center]. 2018. State contacts for mosquito/vector control [Internet]. Corvallis, OR: National Pesticide Information Center; [accessed November 14, 2018]. Available from: http://npic.orst.edu/vecmlr.html. [Google Scholar]
- Reiskind MH, Lounibos LP. 2013. Spatial and temporal patterns of abundance of Aedes aegypti L. (Stegomyia aegypti) and Aedes albopictus (Skuse) [Stegomyia albopictus (Skuse)] in southern Florida. Med Vet Entomol 27:421–429. [DOI] [PubMed] [Google Scholar]
- Roche DG, Lanfear R, Binning SA, Haff TM, Schwanz LE, Cain KE, Kokko H, Jennions MD, Kruuk LEB. 2014. Troubleshooting public data archiving: suggestions to increase participation. PLoS Biol 12:e1001779. [DOI] [PMC free article] [PubMed] [Google Scholar]
- Rosenberg R, Lindsey NP, Fischer M, Gregory CJ, Hinckley AF, Mead PS, Paz-Bailey G, Waterman SH, Drexler NA, Kersh GJ, Hooks H, Partridge SK, Visser SN, Beard CB, Petersen LR. 2018. Vital signs: trends in reported vector-borne disease cases—United States and territories, 2004–2016. MMWR Morb Mortal Wkly Rep 67(17):496–501. [DOI] [PMC free article] [PubMed] [Google Scholar]
- Rund SSC, Braak K, Cator L, Copas K, Emrich SJ, Giraldo-Calderon GI, Johansson MA, Heydari N, Hobern D, Kelly SA, Lawson D, Lord C, MacCallum RM, Roche DG, Ryan SJ, Schigel D, Vandegrift K, Watts M, Zaspel JM, Pawar S. 2018. Minimum information for reusable arthropod abundance data (MIReAAD). bioRxiv [Internet]. doi 10.1101/429142 [accessed November 14, 2018]. Available from: https://www.biorxiv.org/content/early/2018/10/17/429142. [DOI] [Google Scholar]
- Sugihara G, May R, Ye H, Hsieh C, Deyle E, Fogarty M, Munch S. 2012. Detecting causality in complex ecosystems. Science 338:496–500. [DOI] [PubMed] [Google Scholar]
- Wieczorek J, Bloom D, Guralnick R, Blum S, Döring M, Giovanni R, Robertson T, Vieglais D. 2012. DarwinCore: an evolving community-developed biodiversity data standard. PLoS One 7:e29715. [DOI] [PMC free article] [PubMed] [Google Scholar]
- WHO [World Health Organization]. 2014. A global brief on vector-borne diseases [Internet]. Geneva, Switzerland: World Health Organization; [accessed August 12, 2018]. Available from: http://www.who.int/campaigns/world-health-day/2014/global-brief/en/. [Google Scholar]
Associated Data
This section collects any data citations, data availability statements, or supplementary materials included in this article.