

Abstract
Metabotropic glutamate receptors are Family C G protein coupled receptors that form obligate dimers and possess extracellular ligand binding Venus flytrap (VFT) domains, which are linked via cysteine rich domains (CRDs) to their 7-transmembrane (7TM) domain. Spectroscopic studies show that signaling is a dynamic process, with large scale conformational changes underlying the transmission of signal from the extracellular VFTs to the G protein-coupling domains (7TMs) in the membrane. Using a combination of x-ray crystallography, cryo-electron microscopy and signaling studies, we present a structural framework for the activation mechanism of metabotropic glutamate receptor subtype 5. Our results show that agonist binding at the VFTs leads to a compaction of the intersubunit dimer interface, thereby bringing the CRDs into close proximity. Interactions between the CRDs and the second extracellular loops of the receptor enable the rigid body repositioning of the 7TM domains, which come into contact with each other to initiate signaling.
Metabotropic glutamate receptors (mGlus) are G protein coupled receptors (GPCRs) activated by the excitatory neurotransmitter L-glutamate1,2. Family C receptors are unusual in that, besides the GPCR-defining 7TM domain, they possess relatively large amino-terminal extracellular domains (ECDs) that form obligate dimers and contain the orthosteric ligand binding sites. In the mGlu subfamily, the ECD is composed of a conserved, ligand-binding VFT domain and a CRD. The VFT is connected to the 7TM domain by means of the CRD, which provides a semi-rigid linker between the ligand binding and 7TM (signaling) domains2. Previous structural work on VFTs in isolation has shown that agonist binding leads to two major structural changes in the conformation of the dimer. The first is a closure of the two VFT lobes 3. Signaling studies in live cells have suggested that VFT closure is essential for activation, with closure of one lobe being sufficient for signaling, while closure of both lobes is necessary for full efficacy4. The second conformational change involves an intersubunit reorientation that brings the CRDs of the adjacent VFTs in close proximity3 (Figure 1a). FRET studies of full-length receptors in live cells have shown that activation likely depends on sequential inter- and intrasubunit conformational changes5.
Figure 1. mGlu5 activation through orthosteric and allosteric ligands.

a) Schematic of mGlu5 activation, with major domains labeled. ECDs are solidly outlined, while 7TM domains are indicated by a dashed line due to prior uncertainty in their position. b) Nb43 and CDPPB show positive binding cooperativity with the radioligand [3H]-L-quisqualate whereras L-glutamate displaces the radioligand from the orthosteric binding site. c) In absence of co-transfection of the neuronal excitatory amino acid transporter 3 (EAAT3), Nb43 and CDPPB show high intrinsic activity at mGlu5 likely due to ambient cellular-released glutamate. d) Co-expression of EAAT3 completely removes the intrinsic activity of Nb43 and significantly reduces the intrinsic activity of CDPPB. Nb43 (e) and CDPPB (f) increases the potency and thereby show signaling cooperativity with L-quisqualate. For panel b individual datapoints from one representative experiment performed in triplicate is shown of 3 independent experiments with similar results. For panels c-f data represent mean ± SEM from 4 (panel c) or 5 (panel d, e, f) independent experiments.
The 7TM domain of mGlu receptors is the binding site of various non-endogenous allosteric ligands that can modulate signaling either on their own or in conjunction with orthosteric ligands, thereby acting as positive allosteric modulators (PAMs), or negative allosteric modulators (NAMs). Crystal structures of the mGlu16 and mGlu5 7TM7–9 domains show that the allosteric ligand binding pockets largely overlap with those of orthosteric ligands in family A GPCRs10. Isolated 7TM domains also function similarly to rhodopsin-like GPCRs, with PAMs acting similarly to agonists at family A receptors11. Of note, many PAMs that are normally silent in full length receptors act as full agonists at isolated 7TM domains12, suggesting that the conformation of the mGlu receptor extracellular domains is a critical regulator of activation and signaling. To understand how agonist binding at the VFT is relayed over 120Å to the intracellular G protein-coupling region of the 7TM domain, we employed a combination of cryo-EM, X-ray crystallography, and biochemical assays, to obtain structures of the mGlu5 dimer in the inactive and active states.
Characterization of active-conformation stabilizing ligands
For structural studies, we sought to complement orthosteric and allosteric small molecule ligands with a nanobody, a single chain camelid antibody, that could further stabilize the receptor in one conformation13. We thus immunized a llama with full-length mGlu5, and after an initial screen for receptor binding and function, we selected one nanobody, termed Nb43, on the basis of its ability to potentiate orthosteric agonist binding. Whereas the orthosteric endogenous agonist L-glutamate (L-glu) displaces the orthosteric analogue 3H-L-quisqualic acid from its orthosteric binding site, both Nb43 and the 7TM domain binding PAM-agonist CDPPB exhibited positive binding cooperativity with 3H-L-quisqualic acid (Figure 1b, Supplemental Data Table 1). Despite previous conflicting reports14,15,16, CDPPB was found to increase the Kd and Bmax of 3H-L-Quisqualic acid binding, suggesting the existence of a tight structural coupling between the VFT and 7TM domains (Supplemental Data Figure 1, Supplemental Data Table 2). Functionally, L-glu and L-quisqualate activate mGlu5, as measured by intracellular calcium release, induced by Gq coupling (Figure 1c, Supplemental Data Table 3). During initial functional testing of Nb43 and CDPPB, both ligands appeared to potently activate mGlu5 (Figure 1c). Since high receptor expression levels17, as well the presence of minute amounts of glutamate in the assay media, are known confounders of these assays18, we overexpressed the neuronal excitatory amino acid transporter 3 (EAAT3) together with lower levels of mGlu5 that are similar to what has been observed in cortical astrocytes16 (Supplemental Data Table 5). Under these conditions Nb43 was virtually devoid of any intrinsic activity and the intrinsic activity of CDPPB was greatly reduced (Figure 1d). Nonetheless, Nb43 and CDPPB functionally potentiated each other (Supplemental Data Figure 1) as well as L-quisqualate (Figure 1e,f, Supplemental Data Table 3), suggesting that they act as PAMs to further stabilize an active signaling complex.
To understand the binding mode of Nb43 and its cooperativity with orthosteric agonists, we solved the X-ray structures of the amino terminal domain of mGlu5 in complex with the nanobody in the presence, and absence of L-quisqualate (Figure 2). Our construct extends through the CRD of mGlu5; however, in the apo state this region has weak electron density protruding diametrically opposite to the CRD of the second monomer, thereby assuming an orientation that is incompatible with a membrane anchored receptor dimer (Extended Data Figure 1a). Nb43 binds the apex of the VFT domain (Figure 2a), with most contacts occurring between the CDR2 and CDR3 of the nanobody and two loops formed by residues 345–357, as well as 365–375 on mGlu5, respectively (Figure 2 a,b, Extended Data Figure 1b,c). The binding interface of Nb43 is defined by the presence of two tryptophan residues (Trp 107, 110) that fold CDR3 against the core regions of the nanobody and orient it for binding within a groove at the apex of the VFT (Extended Data Figure 1d). The majority of interactions between Nb43 and mGlu5 are polar (Figure 2b) and involve poorly conserved residues amongst mGlu receptor subtypes (Extended Data Figure 1c), suggesting Nb43 would be a subtype-selective PAM of mGlu5. Overall, the architecture of this VFT dimer is that of an elusive “Aoo” (active open-open) form19 that has been observed very infrequently in crystal structures of antagonist-bound ECDs of mGlu1 (PDB 3SK9) and mGlu2 (PDB 5KZN)20. The Aoo form is characterized by the close proximity of the VFT bottom lobes despite the flytraps being open (Figure 2d, middle panel). The structure of mGlu5 ECD with bound Nb43 suggests that lobe closure is sufficient, but not necessary for activation.
Figure 2. X-ray structures of mGlu5 ECD in complex with Nb43.

a) Overall structure of the mGlu5 ECD+Nb43 complex. Nb43 binds the apex of the VFT through a series of polar interactions as shown in b). c) The overall structure of the mGlu5 ECD with Nb43 and L-quisqualate is similar, but shows a pronounced intersubunit Cysteine Rich Domain (CRD) interface. d) Activation process illuminated by structures of the mGlu5 ECD. Both Nb43 and L-quisqualate lead to an intersubunit reorientation as measured by a reduced B/C helix angle. This brings the VFT bottom lobes together as indicated by a red sphere at the C-terminus of the VFT (Asp 497).
We also solved the crystal structure of the mGlu5 extracellular domain in the presence of Nb43 and L-quisqualate at a resolution of 3.75Å. We could only confidently model the backbone of the CRDs (Extended Data Figure 1e), and one nanobody in the dimer, although we observe diffuse, positive density where the second nanobody should bind. Overall, this structure looks almost identical to that of the mGlu5 VFT in complex with glutamate (PDB 3LMK) (RMSD of 0.5Å) and we observe the canonical agonist-bound Acc (active closed-closed) VFT conformation (Figure 2c) that, like the Aoo form presented above, is typified by a close proximity between VFT bottom lobes (Figure 2 c,d). Compared to the Nb43-apo structure, binding of L-quisqualate not only leads to VFT lobe closure around the ligand, but also results in the establishment of a defined intersubunit CRD interaction interface (Figure 2 c,d). This close apposition of the CRDs is consistent with observations that introduction of intersubunit CRD cross-links leads to constitutive activity in mGlu receptors21.
Despite extensive optimization, crystals of a full-length construct of mGlu5 bound to the F-MTEB analogue 3-fluoro-5-(2- (2-(fluoromethyl)thiazol-4-yl)ethynyl)benzonitrile 22 (referred to as FFMTEB), a potent and selective NAM, only diffracted to 4Å resolution and lacked interpretable electron density in the transmembrane domain. Nonetheless, we were able to build a backbone model of the VFT and parts of the CRD domains (Figure 2d-left panel) in their apo-form. A comparison of this structure to that of the Nb43 and Nb43+L-quisqualate complexes elucidates the structural transitions that underlie activation at the extracellular domain of mGlu5. Agonist binding reorients the dimer interface from the resting (R) to the active state (A) as measured by a reduced B-C helix angle3, and leads to a conformation where the VFT bottom lobes are located proximally to each other. The CRDs are accordingly repositioned to relay this conformational change towards the membrane (Figure 2d).
Cryo-EM Structures of full-length mGlu5
To better understand activation in the full length mGlu5, we employed cryo-EM to obtain structures of the receptor dimer in both inactive and active states (Extended Data Figure 2 b–f). Initial efforts to obtain the structure of detergent-reconstituted mGlu5 in the inactive (apo) state revealed a large population of receptors with split micelles that each contained one of the 7TM domains, suggesting the inactive state is characterized by a lack of strong interactions between the transmembrane domains (Extended Data Figure 2a). Given the possibility that the 7TM domain separation is a result of detergent solubilization, we reconstituted mGlu5 into nanodiscs and obtained a cryo-EM map of the full-length receptor at 4.0 Å resolution (Figure 3a, Extended Data Figure 2 - 4). This map allowed us to build a full-length apo-state model of mGlu5 including unambiguous placement of all transmembrane helices, aided in part by the availability of crystal structures of all components7,23 (Extended Data Figure 5a, b). The inactive conformation of mGlu5 involves a single interaction interface at the apex of the Venus Flytrap Domain (Figure 3a, Extended Data Figure 6, top panel). This interface, mostly formed by hydrophobic residues, is further stabilized by the conserved disulfide bond between Cysteines 129 of each subunit; however, this disulfide is neither required for dimer formation nor signaling24. We note that the cryo-EM map lacks density for residues 123–135 and we thus cannot confidently model the position of the disulfide. Although our crystal structure of apo-mGlu5 only allowed building of the ECD (discussed above), its observed conformation is in the context of a full-length receptor that is restrained by its 7TM domains in detergent. It thus allows for a direct comparison with the cryo-EM structure, which includes density for all domains. Both structures show a nearly identical ECD conformation, as evidenced by a backbone RMSD of 0.9Å (Extended Data Figure 7a), with the CRD conformation dictating well-separated 7TM domains.
Figure 3. Cryo-EM Maps and Models of Full Length mGlu5.

Cryo-EM maps of full length mGlu5 in the a) apo-VFT state, and the b) active state bound to Nb43, and L-quisqualate. Left panels in a) and b) show the same view of mGlu5 in the apo and active conformation, respectively. Right panels in a) and b) are 90˚ rotated relatively to left panels a) and b). Models of apo (c) and active (d) mGlu5 are shown from side (c, d, left panels) and top (c, d, right panels) views. Positions in the VFT (red), CRD (yellow), CRD/7TM interface (purple), and 7TM domain (green) show that the active state is characterized by smaller intersubunit distances. The TM5 position in the apo model (pink) shows that at their closest point, the 7TM domains remain separated.
We were able to prepare a stable detergent-solubilized mGlu5 in the presence of L-quisqualate, CDPPB and Nb43, enabling us to obtain a cryo-EM map of an active-state complex at a global resolution of 4.0Å (Figure 3b). The map shows well resolved features in the VFT and CRD domains (Extended Data Figure 4, 5 c–f), and in spite of the lower local resolution in the TM portion, it allows unambiguous placement of TM helices (Figure 3b, Extended Data Figure 4, 5g–h). The active state of mGlu5 is very compact with interactions between subunits at each of the VFT, CRD and 7TM domains (Figure 3b, Extended Data Figure 6, bottom panel). This is reflected in a substantially buried surface area of 2160Å2 compared to 630Å2 in the inactive state (Extended Data Figure 6).
Activation leads to compaction of the mGlu5 dimer
The cryo-EM structures of full-length mGlu5 in active and inactive states complement our crystallographic observations of the ECDs, and explain how ligand binding at the ECD is relayed to the 7TM domain. Globaly, agonist binding leads to a substantial compaction of the mGlu receptor dimer (Figure 3c,d, Supplemental Video 1). In its apo state, the mGlu5 VFT adopts an “Roo” (Resting open-open) conformation with a bottom lobe separation of 35Å at Asp 233, while in the agonist-bound Acc conformation this distance is reduced to 21Å . In both states the CRDs extend almost straight down from the C terminus of the VFT towards the membrane. In the inactive state, the average separation at Glu 527 of the CRD is 43Å, while this distance is reduced to 10Å in the active state. The 7TM domains are completely separated in the inactive state, with a backbone distance of 21Å between TM5 of the two protomers, which are the most proximal transmembrane helix pair (Figure 3c). In the active state the 7TM domains show a strong interaction along TM6 with a backbone separation distance of 6Å (Ile 791) (Figure 3d).
The individual 7TM domains of both apo- and agonist-bound mGlu5 align well with each other and are almost identical in conformation to thermostabilized NAM-bound crystal structures7–9 of the mGlu5 transmembrane domain in isolation (RMSD of 1.4Å) (Extended Data Figure 7c,d). Though the local resolution of the 7TM domains in both of our maps preclude unambiguous assignment of ligand state at the allosteric site, the full agonist L-quisqualate appears unable to stabilize an active conformation within the 7TM bundle. This observation is not entirely unexpected, as most family A receptors do not fully adopt their active conformation in the absence of intracellular stabilizers, such as G proteins 25,26. Thus, the structure of an active family C 7TM domain remains elusive.
Agonist-induced structural changes are thought to be in part regulated by a hydrophobic patch of residues formed by the B and C helices at the apical surface of the VFT (Figure 4 a,b). Notably, this hydrophobic patch is the only interface that is conserved between apo and active mGlu5 (see above, Extended Data Figure 6). Single molecule FRET studies in mGlu2 showed that mutations that weaken this interface not only led to increased glutamate affinity, but also to increased occupancy of the active conformation, even in the absence of agonists27. Our structures complement these results. Compared to the tight interactions of the apo-state (Figure 4 e,f), the active state shows a more open interface (Figure 4 g,h). Since the loops that immediately precede both the B and C helices contain residues that are important for ligand recognition, binding of an agonist in the VFT may trigger relaxation of the B-C intersubunit interface, which releases its constraint on activation. A further network of polar interactions at the apical surface of the B helices helps to stabilize the active conformation. Notably, Arg 114 releases its interaction with Glu 111 (Figure 4 c) of the complementary subunit to engage the more distal Glu 121 (Figure 4 d), and thus helps to maintain the acute intersubunit B helix angle that defines the active state. Unexpectedly, we also observed a potential interaction between Arg 29 of Nb43 and Glu 124 on the B helix of the protomer opposite to its major binding interface, which may provide a structural explanation for its allosteric properties (Figure 4d). We note however, that Nb43 on its own cannot stabilize the active receptor conformation and the CRD interface. This interpretation is supported by cryo-EM analysis of full-length mGlu5 with bound Nb43 in the absence of orthosteric ligand, showing a dimer configuration that is very similar to the apo-state (Extended Data Figure 3b). In agreement with this finding, our MD simulations show that Nb binding alone does not induce closure of the VFTs but restricts the extent of their opening up to the fully inactive conformation (Extended Data Figure 8).
Figure 4. Structural Changes at the VFT.

Comparison of intersubunit VFT interfaces in the apo (a), and active (b) state of mGlu5. The first interface is a hydrophobic patch between residues on B and C helices (black boxes). In the apo form, we observe a tight interface (e,f), while the active state is characterized by a more open interface (g,h). Panels f and h show surface representations of e and g, respectively. The slipping of the B helices relative to each other leads to rearrangement of a polar interface around residue Arg 114 (c,d). Further stabilization may be provided by Nb43 (panel d).
Activation of mGlu5 leads to a reorientation of the 7TM interface
While dimeric associations between normally monomeric family A receptors have been observed in crystal structures, they show varied interaction interfaces, and their physiological relevance is debated28–30. Prior work on mGlu1 and mGlu2 led to contradicting models about the relative intersubunit transmembrane interface. While the crystal structure of the mGlu1 7TM domain bound to the negative modulator FITM suggested a sterol-rich TM1 interface6, cross linking studies of mGlu2 proposed an inactive state TM4/5 mediated interface that transitions to a TM6 driven interface in the presence of agonist31.
Our structures revealed that, in addition to moving closer to each other, there is a 20º rotation of each 7TM (Figure 5a–d, Extended Data Figure 9 a,b). In doing so, the TM1-TM1 distance decreases from ~70Å in the inactive state to ~43Å in the active state, as previously proposed31 (Figure 5 c,d). More importantly, the propagation of structural changes leads to a TM6-TM6 interface that appears to be a hallmark of activation (Figure 5d). This “active” TM6 interface was confirmed by introduction of a cysteine mediated cross link at the extracellular face of TM6 (I7916.56C after removal of the cross-link in the VFT (C129A)) (Extended Data Figure 9c) (Superscripts indicate generic GPCR numbering 32). Surface expression levels of the C129A, I791C and C129A+I791C mutants were comparable to the wild type (Supplemental Data Figure 3). Dimer formation of the C129A+I7916.56C mutation was observed to spontaneously form with higher efficiency in the absence of the negative allosteric modulator MPEP (Figure 5e, Extended Data Figure 9d. The TM6 cross-linked mGlu5 is constitutively active (Figure 5f-top panel) and not responsive to orthosteric agonist, a finding that was previously observed in a I6.56C TM6-locked mGlu231. Interestingly, despite being locked in an active conformation, the I791C mutant receptor was still responsive to the 7TM negative allosteric modulator MPEP, which inhibited signaling in a dose-dependent manner (Figure 5f-bottom panel) albeit with lower potency. The fact that a 7TM NAM is able to overcome the constitutive activity of the TM6-locked construct strongly suggests that the activation profile of mGlu receptors requires both inter- and intra-subunit conformational changes5.
Figure 5. Activation leads to a rearrangement of the 7TM interface.

Side views of apo and active mGlu5 CRD and 7TM domains are shown in a) and b) respectively. Top views of the mGlu5 7TM domain in the apo and active state are shown in c) and d) respectively. Both apo and active mGlu5 are shown in the same view after alignment to each other to allow direct comparison. The position of I7916.56 is shown as a sphere for reference. Cross linking of TM6 and subsequent reestablishment of the homodimer after removal of the cross-link in the VFTs by a C129A mutation is less efficient when the receptor is bound to a negative allosteric modulator (MPEP), as shown by yellow bars in e) A TM6 cross-linked mGlu5 is constitutively active (f, top panel) but responds to a 7TM negative modulator (f, bottom panel). Bars in e represent mean ± SEM from 8 independent experiments. Statistics were performed using Repeated measures one-way ANOVA followed by Tukey’s multiple comparison’s test and indicated P values were adjusted to account for multiple comparisons. Data in f represent mean ± SEM from 5 (top panel) and 6 (bottom panel) independent experiments performed in duplicate.
Role of ECL2 in propagation of orthosteric activation signals
Our cryo-EM structures of both active and inactive mGlu5 revealed an unexpected intra subunit interaction between the CRD and ECL2 of the 7TM domain (Figure 6a). A first hint into the potential role of ECL2 in aiding signal transduction came from the crystal structure of the mGlu1 7TM domain6, which featured an extended ECL2 hairpin that projected outwards towards TM1 and the space where the CRD was predicted to reside33. Interestingly, the conformation of ECL2 in our full-length structure is almost identical to that of the mGlu1 7TM domain. Despite the limited resolution of our maps, we can model two interaction interfaces using previous structural information as a guide. Interface 1 involves a short hydrophobic interface between residues 729–731 of ECL2 and residues 568–571 at the CRD-TM1 boundary (Figure 6a). Interface 2 encompasses residues 725–727 at the apical loop of the ECL2 β-hairpin and a composite interface composed of residues Glu 539 and Trp 557 of the CRD (Figure 6 a). In particular, the chemistry and proximity of Arg 727 in ECL2 allows it to potentially form interactions with either Glu 539 or Trp 557 in the CRD, through ionic or cation-pi interactions. In order to further validate the role of this interface in propagating signals to the 7TM domain, we generated ECL2 mutants of full length mGlu5 as well as a truncated mGlu5 construct that encodes the 7TM domain alone. Previous work has shown that an isolated mGlu5 transmembrane domain functions similarly to rhodopsin-like receptors, with PAMs and NAMs acting analogously to orthosteric agonists and antagonists at family A GPCRs11. Deletion of residues Ile 726 and Arg 727 at the apex of ECL2 drastically reduces orthosteric agonist responses of L-glutamate and (S)-3,5-DHPG in the full-length receptor (Figure 6b, Supplemental Data Figure 2, Supplemental Table 4), but has only a small effect on the action of CDPPB in the full-length receptor (Figure 6c, Supplemental Table 4), and no effect on CDPPB activation of the 7TM domain alone (Figure 6d, Supplemental Table 4). We note that surface expression, as well as total expression levels, of the ECL2-I726-R727 deletion mutant were comparable to wild type but that further truncation of ECL2 compromised surface expression (Supplemental Data Figure 3). Deletion of ECL2-I726-R727 did not affect the respective constitutive activities of the full-length receptor and 7TM domain construct (Supplemental Data Figure 2). The reduction in maximal signaling response for orthosteric agonists of the ECL2-I726-R727 deletion mutant implies that ECL2 may serve as a rigid fulcrum that aids in the propagation of agonist induced conformational changes at the VFT to the signaling domain in the membrane. It is likely that in the absence of this ECL2 interaction, the loop at the boundary of the CRD and TM1 does not have the rigidity to relay the conformational change to the 7TM domain and is thus unable to coordinate the structural rearrangements leading to the formation of the active TM6 interface.
Figure 6. ECL2 is necessary for activation by orthosteric agonists.
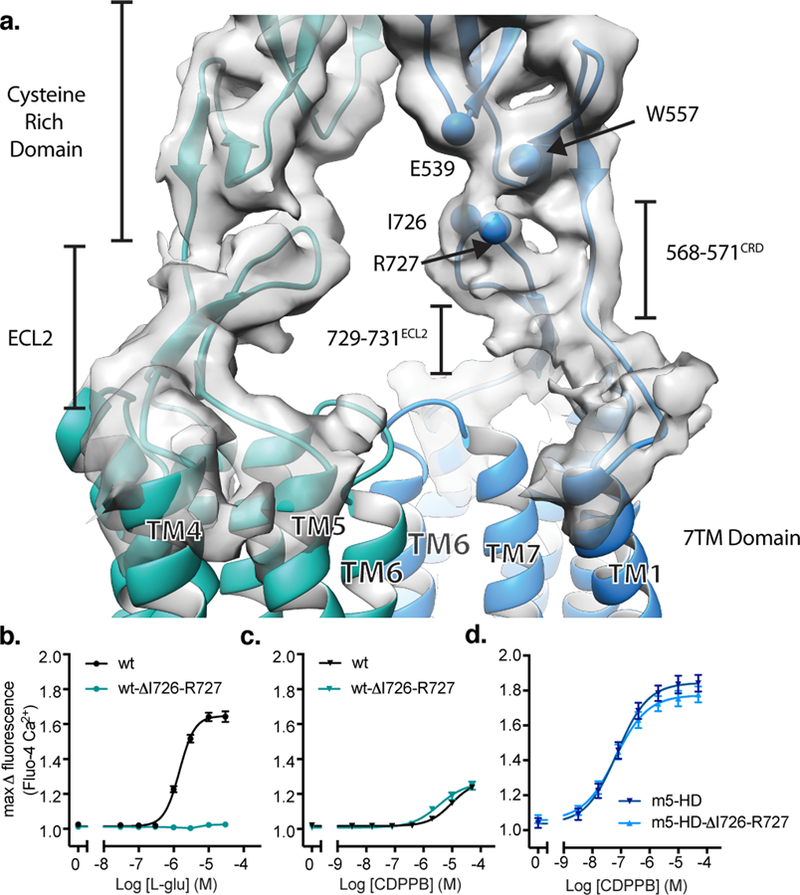
a) Model (teal/blue) and map (gray) showing interactions between the ECL2 of the 7TM domain and the CRD. Residues that make up this interface are shown as spheres at their Cα positions. Deletion of the distal loop residues in ECL2 leads to compromised signaling by the orthosteric agonist both upon low expression of mGlu5 with co-transfection of EAAT3 (b) and whereas the effect of the ago-PAM CDPPB is not compromised (c) likely reflecting disruption of the functional coupling of VFT with the 7TM domain. This mutation has no effect on signaling by the ago-PAM CDPPB at the 7TM domain alone, as shown in (d). Data in panels b-d represent mean ± SEM from 6 independent experiments performed in duplicate or triplicate.
Discussion
The combination of our in vitro data, crystal structures, and cryo-EM structures of mGlu5 allow us to propose a structural framework for mGlu5 activation. Agonists stabilize a compact VFT conformation that is characterized by a relatively small intersubunit bottom-lobe distance. The proximity of these bottom lobes is propagated through the CRDs to the 7TM domains that reorient to form a TM6-mediated interface that is signaling competent. The geometry of this structural rearrangement is essential, as only certain intersubunit CRD crosslinks have been shown to increase receptor activity5. Similar rearrangements have been observed in other class C GPCRs, suggesting that a conformation transition whereby the TM domains come into close proximity may be a hallmark of activation in this family34,35.
Our studies identified ECL2 as being necessary for relaying the agonist-induced conformational changes to the 7TM domain by providing a second, rigid attachment point between the ECD and transmembrane domains. Thus, we propose that the ECL2-CRD interaction is the structural basis for the allostery that has been observed between the ECD and 7TM domains36,37. While our results do not fully explain how agonist binding at the VFT leads to G protein coupling and activation, they do support a model in which both inter- and intrasubunit rearrangements are required for full activity5. This work addresses the first of these conformational changes. Further studies are required to elucidate the mechanism by which the establishment of a TM6-TM6 interface leads to transmembrane domain rearrangements that enable G protein coupling and signaling.
Methods
Online Methods
No statistical methods were used to predetermine sample size. The experiments were not randomized and the investigators were not blinded to allocation during experiments and outcome assessment.
Purification of mGlu5 ECD
A construct encoding residues 21–569 of wild-type human mGlu5 followed by a hexahistidine tag was cloned into the insect cell secretion vector pACGP67 and used to generate Baculovirus using the BestBac method (Expression Systems). Hi-Five (Trichoplusia ni) cells were infected with baculovirus at a density of 3.5×10⁶ cells/mL for 72 hours at 27˚C. Cells were removed from media by centrifugation at 4000rpm, at which point the media was quenched of chelating agents by addition of 1mM NiCl2 and 5mM CaCl2 with rapid stirring at 25C for one hour. Precipitates were removed from media by centrifugation at 4000 rpm. Media pH was balanced by addition of Tris pH 8.0 to 50mM final before loading over 5mL of Ni-NTA resin. Resin was washed in 500mM NaCl, 20mM HEPES pH 7.5 and 20 mM Imidazole, then in 100mM NaCl, 20mM HEPES pH 7.5 and 20mM Imidazole. Protein was eluted in 100mM NaCl, 20mM Hepes pH 7.5 and 250 mM Imidazole, fractions containing ECD were pooled, and the His tag was removed by addition of carboxypeptidase A and B during overnight dialysis into 100mM NaCl, 20 mM Hepes pH 7.5 at 4˚C. Contaminants and uncleaved protein were separated by flowing over Ni-NTA resin and flow-through was collected. Protein was finally purified by size exclusion chromatography on a Superdex 200 10/30 column in 100mM NaCl with 20mM Hepes pH 7.5. Monomeric fractions were pooled and concentrated to 30 mg/mL and flash frozen in liquid nitrogen.
Purification of Nb43 for signaling studies and crystallography
Nb43 was cloned into a modified pE-SUMO vector containing a PelB leader sequence and AAA linker in front of the SUMO fusion tag. Transformed BL21 E. coli were grown to OD600 of ~0.6 at 37˚C and induced with 1mM IPTG and transferred to 25C shakers where induction was allowed to run overnight. Bacteria were harvested by centrifugation and frozen. Nb43 was purified from the periplasm using established protocols. Briefly, cells were thawed in two volumes SET buffer (0.5M Sucrose, 0.5mM EDTA, 0.2M Tris pH 8.0) and stirred until homogenized before addition of 3 volumes 25 C Milli-Q water with rapid stirring for 45 minutes to release periplasmic contents. Cell debris was removed by centrifugation at 15000 rpm for 20 minutes. Prior to loading over Ni-NTA resin, 100mM NaCl and 10mM MgCl2 were added to provide ionic strength and to quench EDTA, respectively. After loading quenched sample, resin was washed in 500mM NaCl, 20mM HEPES pH 7.5, and 20 mM Imidazole, then in 100mM NaCl, 20mM HEPES pH 7.5 and 20mM Imidazole. Protein was eluted in 100mM NaCl, 20mM Hepes pH 7.5, and 250 mM Imidazole, and fractions containing SUMO-Nb43 were pooled, and His-Sumo tag were removed by addition of ULP1. Imidazole was removed by overnight dialysis into 100mM NaCl, 20 mM Hepes pH 7.5 at 4˚C. Contaminants and uncleaved protein were separated by flowing over Ni-NTA resin and flow-through was collected. Nb43 was finally purified by size exclusion chromatography on a Superdex 200 10/30 column in 100mM NaCl with 20mM Hepes pH 7.5. Monomeric fractions were pooled and concentrated to 98 mg/mL (~3mM) and flash frozen in liquid nitrogen. Nb43 purified in this manner was used for both structural and pharmacological studies.
Crystallization of the Apo ECD+Nb43 Complex and Data Collection
mGlu5 ECD was incubated with 1.2 molar excess Nb43 for 30 minutes at 25˚C and excess Nb43 was removed by size exclusion chromatography on a Superdex 200 10/30 column in 100mM NaCl with 20mM Hepes pH 7.5. Fractions containing complex were pooled and concentrated to 20 mg/mL and flash frozen in liquid nitrogen.
Initial crystallization hits were identified in ~30% of conditions in commercial screens, and a refined condition containing 18–20% Peg3350, 0.15M Potassium Nitrate, with 1% Benzamidine gave final crystals. These crystals were cryo protected in reservoir solution+25% glycerol and frozen in liquid nitrogen.
Data were collected on BL12–2 at SSRL at 100K and processed using XDS36 and scaled using AIMLESS37 in the CCP438 suite. Phases were obtained by molecular replacement, using individual top and bottom VFT lobes from a structure of the mGlu5 VFT bound to glutamate (PDB 3LMK). A homology model of Nb43 was generated using Swiss-Model39 and manually placed in positive density after refinement to the VFT alone. The model was iteratively refined using Phenix40 and manually in Coot41 and showed good stereochemistry with 94.95% of residues in Ramachandran favored zones, 4.97% in allowed and 0.08% outliers.
Crystallization of the ECD in complex with Quisqualate and Nb43
mGlu5 ECD +Nb43 complex (described above) was incubated with a 10-fold molar excess of L-quisqualic acid (Tocris) for 30 minutes at 25˚C and initial crystallization hits were identified using commercial screens. Crystals reproducibly emerged in 100mM NaCl with 20% PEG species at a range of pH values. Final crystals were grown in 100mM NaCl, 50mM ADA pH 7.0 and 20% PEG 4000. Crystals were cryo-protected in reservoir solution plus 25% glycerol and frozen in liquid nitrogen.
Data were collected on Beamline 23 IDB at APS and processed using XDS36 and AIMLESS37 from the CCP438 package. Phases were obtained by molecular replacement using a structure of the mGlu5 VFT bound to glutamate (PDB 3LMK), and nanobodies were placed using the structure of the Apo-ECD Nb43 complex. Model building was performed manually in Coot41 and refined using Phenix40 and BUSTER42. The final model showed good stereochemistry with 94.66% of residues in Ramachandran favored zones, 5.34% in allowed and 0 outliers.
Expression, purification and crystallization of full-length mGlu5 bound to NAM FFMTEB
The haemagglutinin (HA) signal peptide, followed by a FLAG epitope tag (DYKDDDD) and a three Alanine linker were added to the N terminus of unmodified human mGlu5 (21–865) with a hexahistidine tag at the C terminus. This construct was cloned into the pFastBac1 sf9 expression vector and recombinant baculovirus was prepared using the Bac-to-Bac baculovirus expression system (Invitrogen). SF9 insect cells were infected with the virus at cells density of 3.5 X 10⁶ cells per milliliter and grown for 48h at 27˚C with gentle rotation.
Cells were harvested by centrifugation, and lysed by resuspension in hypotonic buffer containing 10mM Tris at pH 7.8 and 1mM EDTA with protease inhibitors followed by homogenization. The cell membrane pellet was collected by centrifugation and was solubilized with 1% (w/v) n-dodecyl-β-D-maltoside (DDM) (Anatrace), 0.1% (w/v) Cholesteryl hemisuccinate (CHS)(Steraloids), 0.2% (w/v) Sodium Cholate (Anatrace), 750mM NaCl, 30% Glycerol, Iodoacetimide 2mg ml−1, protease inhibitor and 10μM FFMTEB (compound 3 in ref 22) 22 (Gift from H. Lundbeck A/S). FFMTEB (3-fluoro-5-(2- (2-(fluoromethyl)thiazol-4-yl)ethynyl)benzonitrile) is a fluorinated analogue of F-MTEB with exceptionally high affinity and selectivity for mGlu5. The supernatant was isolated and incubated with anti-Flag M1 affinity resin (Sigma) overnight at 4˚C. The resin was washed with 0.1% (w/v) DDM, 0.01% (w/v) CHS, 500mM NaCl, 10% Glycerol and 10μM FFMTEB, followed by 0.1% (w/v) lauryl maltose neopentyl glycol (LMNG), 0.01%(w/v) CHS, 150mM NaCl and 10μM AF57974 buffer to exchange the detergent. mGlu5 bound to FFMTEB was eluted in 30mM HEPES pH 7.5, 150mM NaCl, 0.01%(w/v) MNG, 0.01%(w/v) CHS, 200 μg/ml Flag peptide, 5mM EDTA, and 10μM FFMTEB. The protein was concentrated in a 50 kDa cut-off Vivaspin (Millipore) and run on a Superdex 200 size exclusion column (GE Healthcare).
Purified mGlu5 receptor was concentrated to 20 mg/ml and crystallized using the vapor-phase diffusion method. Protein was mixed with precipitant solution at 1:1 ratio in sitting drops, using a Gryphon Crystallography Robot (Art Robbins Instrument) for setups. The crystals that were used for data collection were grown in 15% PEG3350 (w/v), 0.2M Sodium Cacodylate pH 6.5 at 20˚C in a 24 well plate (Hampton Research). Crystals were cryo-protected by adding glycerol in a step-wise manner to reach final concentration of 30%, and then flash-frozen in liquid nitrogen.
X-ray data collection, processing, and structure determination of full-length mGlu5 bound to the NAM FFMTEB.
X-ray diffraction data was collected at the Advanced Photon Source at Argonne National Laboratories at GM/CA beamline 23ID-D and 23ID-B. Even though the crystals were of sufficient size (>0.2 mm), usually only a particular small region yielded suitable diffraction. Thus, the entire crystal was first screened by rastering using a 40 µm by 40 µm beam with 5-fold attenuation and 0.5 s exposure. Regions that contained strongest diffraction were then sub-rastered using a 20 µm collimated beam with fivefold attenuation. Data was then collected with the 20 µm beam using 2 to 5-fold attenuation with 1–2 second exposures and 0.2 degree oscillations. Due to radiation damage, data was collected in wedges of 5–25 degrees before moving onto either a different site on the crystal or a new crystal. Diffraction data was processed using XDS36 and statistics are summarized in Extended Data Table 1. The structure was solved by molecular replacement using Phaser with mGlu5 Venus Fly Trap domain structure in open conformation (from the Apo-ECD structure with Nb43, but with Nb43 removed) as search model. The resulting model was completed by iterative refinement in Phenix40, Refmac43, and BUSTER42,44 and manual building with Coot41. MolProbity45 was used for structure validation, and figures were prepared using PyMOL (Schrödinger). Final refinement statistics are reported in Extended Data Table 1. In short, despite the limited resolution, we were able to refine a model with excellent stereochemistry (94% Ramachandran favored, 5.9% Ramachandran allowed and 0.1% outliers) and well-defined electron density for the main chain and the majority of side chains.
Liposome reconstitution and llama immunization.
mGlu5 full length receptor was purified as described above. The resulting receptor was reconstituted into phospholipid vesicles composed of DOPC (1,2-dioleoyl-sn-glycerol-3-phosphocholine, Avanti Polar Lipids) and lipid A (Avanti Polar Lipids) in 10:1 ratio at final receptor concentration of 1mg ml-1. The reconstituted receptor was flash frozen in liquid nitrogen in 100ug aliquots for llama immunization. One llama was immunized over 6 weeks with 0.25mg of liposome reconstituted mGlu5. Peripheral blood lymphocytes were isolated from the llama to extract total RNA, prepare cDNA and construct a Nanobody phage display library as previously described 46. Animal studies were performed under ethical guidelines outlined by EU animal welfare legislation and a local ethical committee for use of laboratory animals of the Vrije Universiteit Brussel.
Preparation of mGlu5 Membranes for Cryo-EM Studies
The HA-FLAG- human mGlu5 (21–865) construct described above was used to infect Spodoptera frugiperda Sf9 cells at a density of 4 million/mL in the presence of MTEP. Infection continued for 60 hours at 27˚C with 130 rpm rotation, at which point cells were harvested by centrifugation and stored at −80˚C. Membranes were prepared following established protocols. In brief, harvested cell pellets were thawed and lysed in hypotonic buffer (10mM Hepes pH 7.5, 1mM EDTA with 160μg/mL Benzamidine and 2.5μg/mL and 10μM MTEP). Cytoplasmic contents were separated by centrifugation, and cell remains were resuspended in a high salt buffer composed of 1M NaCl, 20mM Hepes pH 7.5, 160μg/mL Benzamidine and 2.5μg/mL and 10μM MTEP) using a tissue shearer (polytron). Fine membrane particulates were pelleted by ultracentrifugation at 44000 rpm in a Ti-45 rotor for 60 minutes and pellets were topped with 100mM NaCl, 20mM Tris pH 7.5, 10μM MTEP, 30% Glycerol before flash-freezing in liquid nitrogen.
Preparation of the MTEP-bound mGlu5 in Nanodiscs
Crude membranes (described above) were thawed and solubilized in a buffer consisting of 750 mM NaCl, 20 mM Hepes pH 7.5, 1% DDM, 0.2% Cholate, 0.12% CHS, 10μM MTEP47 and 160μg/mL Benzamidine and 2.5μg/mL Leupeptin (EMD Millipore). Solubilization proceeded for 90 minutes at 4˚C with constant stirring, and 1mg/mL iodoacetamide was added to block reactive cysteines. Insoluble material was removed by centrifugation at 37000xg for 25 minutes, at which point 2mM calcium and 4mL M1 Anti-FLAG resin was added. Batch binding occurred for 90 minutes at 4˚C with constant stirring.
Resin was harvested by centrifugation at 3000xg for 2 mins, and washed in batch with 500mM NaCl, 20mM Hepes pH 7.5, 0.1% DDM, 0.01% CHS, 2mM CaCl2, and 10μM MTEP. Resin was transferred to an EconoPac column and washed with the same buffer, and finally with 100mM NaCl, 20mM Hepes pH 7.5, 0.1% DDM, 0.01% CHS, 2mM CaCl2, and 10μM MTEP. Protein was finally eluted using 100mM NaCl, 20mM Hepes pH 7.5, 0.1% DDM, 0.01% CHS, 10μM MTEP, as well as 0.2 mg/mL FLAG Peptide and 5mM EDTA. Fractions containing protein were pooled and concentrated to ~10 μM. Concentrated protein was reconstituted in MSP1D1 nanodiscs following previously-published protocols48. In brief, mGlu5 was mixed with MSPD1 belt protein and lipids in the following ratio: 0.1 Receptor: 1 MSP1D1 : 65 POPC:POPG (3 POPC: 2 POPG ratio). After 3 hours of incubation on ice, biobeads were added at a ratio of 1 mg biobead:14 mg lipid. After 1 hour at 4˚C, the same amount of biobeads were added again and reconstitution continued at 4˚C overnight with gentle rocking.
Reconstitution mixture was removed from beads, concentrated, and injected on a Superose 6 10/30 gel filtration column in 100mM NaCl, 20mM Hepes pH 7.5, 10μM MTEP to separate aggregates and empty discs. Monomeric peak fractions were collected and concentrated to ~6mg/mL for imaging.
Preparation of mGlu5 bound to CDPPB, L-quisqualate and Nb43
Crude membranes (described above) were thawed and solubilized in a buffer consisting of 750 mM NaCl, 20 mM Hepes pH 7.5, 1% DDM, 0.2% Cholate, 0.12% CHS, 10μM MTEP and 160μg/mL Benzamidine and 2.5μg/mL). Solubilization proceeded for 90 minutes at 4˚C with constant stirring, and 1mg/mL iodoacetamide was added to block reactive cysteines. Insoluble material was removed by centrifugation at 37000xg for 25 minutes, at which point 2mM calcium and 4mL M1 Anti-FLAG resin was added. Batch binding occurred for 90 minutes at 4˚C with constant stirring.
Resin was harvested by centrifugation at 3000xg for 2 mins, and washed in batch with 500mM NaCl, 20mM Hepes pH 7.5, 0.1% DDM, 0.01% CHS, 2mM CaCl2, and 10μM MTEP. Resin was transferred to an EconoPac column and washed with the same buffer. At this point, detergent was exchanged for GDN by stepwise incrementation of a 0.2% GDN/0.02% CHS mixture and lowering of the 0.1% DDM/0.01%CHS over a period of 30 minutes. The concentration of GDN was then lowered to 0.02% (~10x CMC) in 100mM NaCl, 20mM Hepes, 0.02% CHS, 2mM CaCl2 and 5μM CDPPB49 was added to the wash buffer to exchange NAM for PAM. Ligand exchange was allowed to proceed for 20 minutes with buffer at 25C, at which point receptor was eluted in 0.02% GDN, 0.002% CHS, 100mM NaCl, 20mM Hepes pH 7.5, 5μM CDPPB supplemented with 5mM EDTA and 0.2 mg/mL FLAG peptide. Protein-containing fractions were pooled, concentrated, and mixed with a 1.2 molar excess of Nb43 before injection on a Superose 6 10/30 gel filtration column to remove excess nanobody and aggregate. Fractions containing both mGlu5 and Nb43 were pooled and concentrated to ~10–15mg/mL for imaging.
Cryo-EM data acquisition and processing
3.0 μL of inactive MTEP bound mGlu5 in nanodiscs at a concentration of 6 mg/ml was applied to glow-discharged 200 mesh grids (Quantifoil R1.2/1.3), containing 0.0005% Amphipol A8–35 (Anatrace). A8–35 was included to aid with sample vitrification, rather than an attempt to further reconstitute receptor into amphipol. Excess sample was removed by blotting prior to plunge-freezing using a Vitrobot Mark IV (Thermo Fischer Scientific) at 4°C and 100% humidity. Cryo-EM samples of mGlu5-Nb43 and mGlu5-Nb43-quisqualate in GDN were prepared similarly with the addition of 0.1% OG. Cryo-EM images were collected on a Titan Krios operated at 300 kV at a nominal magnification of 130,000x with a Gatan GIF Quantum LS Imaging energy filter using a Gatan K2 Summit direct electron camera in counting mode, corresponding to a pixel size of 1.06 Å. Each image was dose-fractionated over 40 frames with a dose rate of 7 e/pix/s and total exposure time of 8s, resulting in an accumulated dose of 50 electrons per Å2. The defocus range was set to 1.2 to 2.5 μm. The datasets of inactive mGlu5, inactive mGlu5-Nb43, and active mGlu5-Nb43-quisqulate included 5391, 7414 and 1984 micrographs, respectively. Dose fractionated image stacks were subjected to beam-induced motion correction and dose weighting using MotionCor250. CTF parameters for each micrograph were determined by Gctf v1.0651.
Data processing of inactive mGlu5 was performed in RELION2.152. A subset of 618,306 particle projections from well-defined averages were selected after two rounds of 2D reference-free classification starting with 1.6 million particles. This group was subjected to two rounds of 3D classifications with a pixel size of 2.12Å. A selected subset of 123,096 projections were used to obtain the final map with Relion using a pixel size of 1.06Å and C2 symmetry imposed in the last rounds of refinement. This map has an indicated global resolution of 4.0Å at 0.143FSC. The dataset of inactive mGlu5-Nb43 was similarly processed in RELION, with a subset of 44,831 particle projections producing a map with indicated 7.9Å resolution. The dataset of active mGlu5-Nb43-quisqualate was preprocessed and sorted by 2D classification in RELION, resulting in 748,593 particles in well-defined averages. This subset of particle projections were exported to cryoSPARC53 for further 2D and 3D classification . After two rounds of 3D classification in cryoSPARC, the angular and translational parameters for a selected group of 256,884 particles were imported to RELION for 3D classification without alignment. The final dataset of 73,472 particle projections was used in RELION to obtain a map with indicated global resolution of 4.0Å. The final resolution estimate was based on the FSC between two unfiltered half-maps. Local resolution was determined using the Bsoft package54 with unfiltered half-maps as input.
Molecular Dynamics Simulations
The nanobody/VTF-domain complex and the VTF-domain alone were prepared for molecular dynamics simulations with the Maestro software (Schrödinger) to add any missing sidechains or hydrogens. Protonation state and hydrogen bonding were also optimized. VMD55 was then used to generate input files for NAMD56 with the OPLS-AA/M force field for proteins57. Implicit solvent molecular dynamics simulations were run with NAMD using the generalized Born method with an α-cutoff of 14 Å. Smoothing at 14 Å and a cutoff at 16 Å were applied to the nonbonded interactions. Temperature was maintained at 300K with a Langevin thermostat using a damping coefficient of 1 ps-1. A 1 femtosecond time step was used with the SHAKE algorithm. Harmonic restraints were placed on all Cα before the system was minimized for 5000 steps and gradually heated from 0 to 300 Kelvin in 20 Kelvin intervals ran for 50 ps each. Restraints were then removed and simulations were run for 25 ns. Four trajectories were run for each system with different initial random number seeds. The results of these replicates were used to obtain error bars for measured quantities.
Molecular pharmacology methods
Constructs
The mGlu5 used for the studies consisted of the human mGlu5 with the signal peptide replaced by an extended HA-signal peptide and FLAG-sequence (MKTIIALSYIFCLVFA-DYKDDDDAAA) before the mature mGlu5 sequence starting at amino acid Q21 (Uniprot P41594–2). Furthermore, part of the C-terminus was removed by introducing a 6xHis tag after amino acid L865. The mGlu5 construct (termed mGlu5-wt) was subcloned into pcDNA3.1(+)neo.
An ECD-truncated construct encoding the helical domain of mGlu5 was generated by introducing the HA-FLAG tag and the first 20 residues of beta2AR in front of the mGlu5 helical domain from residues D565 to L865 followed by a 6xHis tag. The constructs was subcloned into pcDNA3.1(+)neo and termed m5-HD. Introduction of the beta2AR residues rescued surface expression of the helical domain construct.
Receptor mutants were generated by site-directed mutagenesis or by overlap PCR using appropriate primers, restriction enzymes and subcloning of mutated PCR products. All constructs were sequence verified. For the ECL2 truncation study the ECL2 residues I726-R727 (and S725-E728, P724-V729, D722-Y730) were removed by overlap PCR in full length and ECD truncated constructs. For the TM6 mutational study the C129A, I791C, and C129A+I791C mutants were generated.
Intracellular calcium release assay
The day before transfection HEK293 cells (ATCC® CRL-1573™) were seeded at a density of 0.6×10⁶ cells in T25 flasks and a volume of 4 mL growth medium. On the day of transfection, a mixture of 2.5 µg (high expression level) or 0.05 µg (low expression level) DNA encoding each of the receptor constructs, and 2 µg of EAAT3 encoding DNA, if indicated, was incubated with 8.5 µL FuGene6 (Promega E2692) in a total of 150 µL OptiMEM (Gibco 51985) for 20 min at room temperature (RT) and then added to the cells. The day after transfection cells were trypsinized and seeded in black-sided, clear bottom poly-L-lysine coated 96-well plates at a density of 50.000 cells/well.
On the day of assay (2 days after transfection), the (glutamate-containing) growth medium was replaced with HBSS buffer (HBSS Gibco 14025, 20 mM HEPES pH7.5, 1 mM CaCl2, 1 mM MgCl2 and 0.1% BSA) supplemented with BSA to 0.5% and left in the incubator at 37°C for 4–6 hrs. Then cells were washed once in 100 µL HBSS buffer, and replaced with 100 µL of buffer containing Fluo-4, probenecid and 0.1% BSA (Fluo-4 Direct™ Calcium Assay Kit, Invitrogen F10471). After 30 min incubation at 37°C, intracellular calcium release upon receptor activation was initiated by addition of 50 µL ligand solutions in 3 times its final concentrations to each well and read using a FLIPR® Tetra High Throughput Cellular Screening System (Molecular Devices, Inc.). The maximum fluorescence response from each well was used in the data analysis. Data was fitted by non-linear regression using GraphPad Prism.
IP1 accumulation assay
HEK293 cells were transfected and seeded and to the point of assay initiation treated as described above except that cells were seeded in clear poly-L-lysine coated 96-well plates. Following the wash, 50 μL HBSS buffer was added to each well. MPEP (Sigma M5435) or buffer were preincubated by addition of MPEP or buffer in 50 µL HBSS buffer for 15 min at 37°C before adding the orthosteric and/or allosteric activating ligands (or vehicle condition) also diluted in 50 µL HBSS buffer now supplemented with LiCl to a final concentration of 20 mM. After incubation for 30 min at 37°C the reaction was stopped by addition of 40 µL lysis buffer from the CisBio IP-One Tb HTRF Kit (CisBio 62IPAPEC). The accumulated IP1 levels were then quantified according to the manufactures instructions and quantified using an Envision plate reader (Perkin Elmer). Data were calculated as the amount of IP1 formed per well or normalized to the basal IP1 level and fitted by non-linear regression using GraphPad Prism.
Radioligand binding ([3H]-L-Quisqualic acid)
HEK293 cell were transfected by adding 15 µg mGlu5-wt DNA and 38 µg polyethylenimine (from 2 mg/mL stock of Sigma-Aldrich 408727) into a volume of 1 mL OptiMEM and incubating for 20 min at RT before adding the mixture to cells seeded at a density of 5×10⁶ in 150 mm the day before transfection. 48 hr after transfection cells were washed once and detached in DPBS supplemented with 2 mM EDTA. After pelleting, the cell pellet was resuspended in lysis buffer (50 mM HEPES pH 7.5 supplemented with cOmplete™, EDTA-free Protease Inhibitor Cocktail (Roche 30307800) and homogenized using a glass douncer. The lysate was spun at 1500 rpm at 4°C for 10 min. The supernatant was then isolated and spun at 40000g in SV-34 tubes for 20 min at 4°C. The membrane pellet was resuspended in binding buffer (50 mM HEPES pH 7.5, 150 mM NaCl, 1 mM CaCl2, 1 mM MgCl2) and frozen in aliquots at −80°C.
For saturation binding experiments 15 µg membrane protein was added together with varying concentrations of [3H]-Quisqualic acid (PerkinElmer NET1165050UC) and 10 µM Nb43 or CDPPB (Sigma SML0235) diluted in binding buffer into 96-deepwell plates. Non-specific binding was determined by addition of 100 µM L-glutamate. For competition binding experiments 10 nM 3H-L-quisqualic acid was added together with 15 µg membranes protein and varying concentrations of L-glutamate, Nb43 or CDPPB into 96-deepwell plates. After shaking at 600 rpm for 2 hrs at RT the receptor-bound radioligand was separated by filtration over Whatmann GF/C unifilters (PerkinElmer 6005174) using a 96-well FilterMate harvester (PerkinElmer). The filters were washed rapidly three times with a total of 2.5 mL of ice-cold binding buffer, and radioactivity was determined in a MicroBeta2 scintillation counter (PerkinElmer) after addition of 40 µL of MICROSCINT O (PerkinElmer 6013611). Data was fitted by non-linear regression using GraphPad Prism.
Western blot
HEK293 cells were seeded and transfected in T25 flasks as described above using FuGene6. Immediately after transfection and the day following transfection 10 µM MPEP or corresponding vehicle was added to the growth medium during expression. 48 hrs after transfections cells were washed once and detached in 1 mL DPBS supplemented with 2 mM EDTA. The cells were pelleted and resuspended in 100 µL lysis buffer (10 mM Tris, pH 7.5 supplemented with cOmplete™, EDTA-free Protease Inhibitor Cocktail). Then cells were homogenized using a Precellys homogenizer and CK28 beads (Bertin Corp. 03961CK28) by homogenizing for 10 sec at 5000 rpm and spinning of the lysate at 500 g for 10 min to isolate the membrane-bound receptor. Equal amounts of receptor protein was resuspended in LDS buffer (LDS Sample Buffer, Non-Reducing (4X), Invitrogen NP0007) supplemented with 8% SDS (Sigma L3771) and loaded on a NuPAGE™ 3–8% Tris-Acetate Gel (Invitrogen cat no. EA03752BOX). Protein was blotted onto PVDF membranes (Invitrogen cat no. LC2005), and stained first with primary FLAG-M2 antibody (Sigma F3165) followed by HPR-conjugated anti-mouse antibody (Thermo Scientific 32430). Receptor monomers and dimers were detected and quantified using a chemiluminsecent substrate and a ChemiDoc imaging system, followed by Imager Lab 6.0 software analysis (Bio-Rad).
All cell lines were obtained directly from the manufacturer, but were not tested further for contamination nor re-authenticated by the authors.
Extended Data
Extended Data Figure 1. Structural Basis of Nb43 Binding to mGlu5.

a) Cartoon view of the apo- mGlu5 Nb43 complex, colored by b-factors. Notably, the CRDs are diametrically opposed and do not form a stable interface with each other, as reflected by elevated b- factors. The Nb43 binding interface is highlighted in panel b) with a 2Fo-Fc map of residues comprising CDR3 at 1σ shown as blue mesh. Residues involved in Nb43 binding are located on Helix L and the L-M loop, and are not conserved (c,d). The 2Fo-Fc map of the mGlu5 ECD bound to L-quisqualate and Nb43 is shown in gray mesh at 1σ around a cartoon representation of the refined model (f). Inset shows quality of density in the L-quisqualate binding pocket.
Extended Data Figure 2. Overview of mGlu5 Cryo-EM studies.

a) 2D negative stain class averages of apo-mGlu5 in LMNG shows several classes with split detergent micelles. Representative cryo-EM images of apo-mGlu5 in nanodiscs and active mGlu5 bound to L-quisqualate and Nb43 in GDN are shown in b) and c) respectively. Cryo-EM class averages of inactive, and active mGlu5 bound to L-quisqualate and Nb43 are shown in d) and e) respectively. Particle angular distribution of the final cryo-EM reconstructions of apo, and active mGlu5 are shown in the left and right panels of f), respectively.
Extended Data Figure 3. Cryo-EM 3D reconstruction workflow.

a) Processing workflow of apo mGlu5 in MSP1D1 nanodiscs, and b) apo-mGlu5 bound to Nb43 in GDN.
Extended Data Figure 4. Cryo-EM 3D active state processing and map resolution calculations.

a) Flow chart of cryo-EM data processing of mGlu5 with Nb43 and quisqualate. b) 3D density maps of mGlu5 and mGlu5 bound to L-quisqualate and Nb43 colored by local resolution. c) ‘Gold standard’ FSC curves from RELION indicate that both mGlu5 and mGlu5+L-quisqualate + Nb43 maps reach nominal resolutions of 4.0Å at FSC=0.143.
Extended Data Figure 5. Cryo-EM map to model agreement.

Representative cryo-EM densities and fitted atomic models for apo (a,b) and active (c-g) mGlu5. The B and C helices of the VFT, and the 7TM domain are highlighted in a) for the apo-mGlu5 structure, and density and model fits are shown in b). Various helices of the VFT, as well as the ligand binding pocket, CRD, and TM6 are highlighted in c, and their cryo-EM density and fitted models are shown in d-h for active mGlu5 bound to L-quisqualate and Nb43.
Extended Data Figure 6. Interface comparison between apo and active mGlu5.

Comparison of intersubunit interfaces in apo, and active mGlu5 are. Contact regions (purple) show residues within 4 A of the opposite subunit. Notably, apo mGlu5 lacks any interactions beyond the VFT.
Extended Data Figure 7. Comparison cryo-EM structures of full length mGlu5 with crystal structures.

The conformation of the VFT and CRD portions of full length apo mGlu5 obtained by cryo-EM (colored cartoon) is almost identical to the conformation revealed by crystal structure of the full length apo mGlu5 (7TM domain not resolved) (gray cartoon) (a). Similarly, the conformation of the VFT and CRD portions of full length Nb43-bound, active-state mGlu5 obtained by cryo-EM (colored cartoon) is almost identical to the conformation revealed by crystal structure of the ECD bound to L-quisqualate and Nb43 (b). Despite being bound to a NAM (green) and PAM (blue), the 7TM domains of in our full-length structures both align almost identically to a crystal structure of NAM-bound 7TM domain in isolation (c), as well as to each other (d).
Extended Data Figure 8. Molecular Dynamics of Nb43.
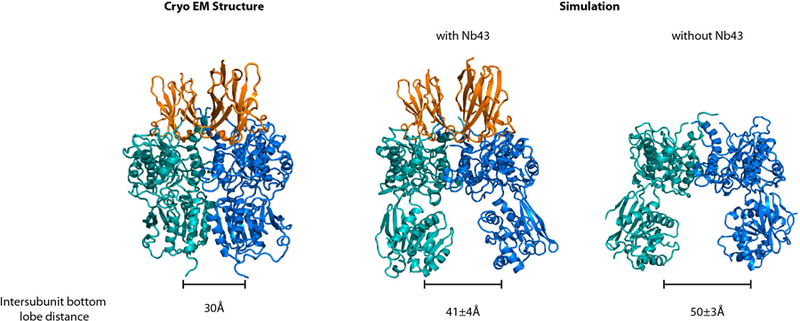
Simulation of the apo-form mGlu5 ECD with, and without Nb43. In the absence of Nb43, the ECD relaxes to an open conformation (right panel) with significant separation between VFT bottom lobes. The presence of Nb43 restricts opening of the ECD to an intermediate degree (middle panel) but does not stabilize the compact R state (left panel).
Extended Data Figure 9. Structural transitions in the 7TM domain upon activation.

Activation involves a 20Å translation of the 7TM domains relative to each other (a) followed by a 20˚ rotation around TM4 (b). The 7TM domains of the apo-state are shown as shades of purple, while the active state 7TM domains are shown as shades of blue. c) Model of the I7916.56C mutation on the active state structure shows ideal positioning for disulfide formation. d) Western Blot analysis of disulfide formation of the I7916.56C in both wild-type and C129A background in the presence, and absence, of the NAM MPEP. Bars in d (bottom) represent mean ± SEM from 8 independent experiments. Statistics were performed using Repeated measures one-way ANOVA followed by Tukey’s multiple comparison’s test and indicated P values were adjusted to account for multiple comparisons.
Extended Data Table 1.
– Cryo EM (Top) and X-Ray (Bottom) data collection and refinement statistics
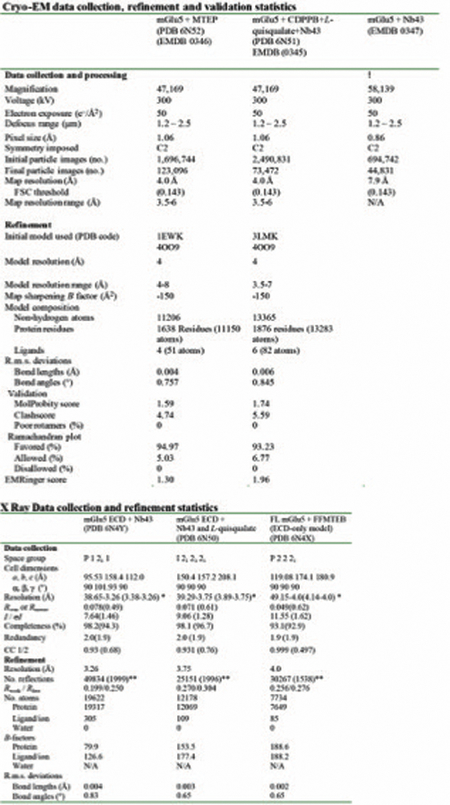 |
Values in parentheses are for highest-resolution shell.
Value in parentheses indicates Rfree set
Supplementary Material
Acknowledgements
The work is supported by NIH grant R01 NS092695 (G.S. and B.K. and J.M.M.) and NIH grant R01 NS028471 (B.K.). Research reported in this publication was supported by the National Institute of General Medical Sciences of the National Institutes of Health under award number T32GM007276 (A.K.). R.F. is funded by grant NNF15OC0015268 from the Novo Nordisk Foundation and the Stanford Bio-X Program. The authors thank H. Lundbeck A/S for synthesis of FFMTEB. This research used resources of the Advanced Photon Source, a U.S. Department of Energy (DOE) Office of Science User Facility operated for the DOE Office of Science by Argonne National Laboratory under Contract No. DE-AC02-06CH11357. Use of the Stanford Synchrotron Radiation Lightsource, SLAC National Accelerator Laboratory, is supported by the DOE under Contract No. DE-AC02-76SF00515. The SSRL Structural Molecular Biology Program is supported by the DOE Office of Biological and Environmental Research, and by the NIGMS (including P41GM103393). The content is solely the responsibility of the authors and does not necessarily represent the official view of the National Institutes of Health. Brian Kobilka is a Chan Zuckerberg Biohub Investigator.
Footnotes
The authors declare one competing interest: Brian Kobilka and Tong Sun Kobilka are founders of and consultants for ConfometRx, Inc. Dan Feng and Bingfa Sun are employees of ConfometRx, Inc., and Matthew Chu was an employee of ConfometRx, Inc. Readers are welcome to comment on the online version of the paper.
Data availability
All data generated or analyzed during this study are included in this published article and its Supplementary Information. The X-ray crystal structures and structure factors of the apo mGlu5 ECD, of the apo-mGlu5 ECD with Nb43, and of the mGlu5 ECD bound to Nb43 and L-quisqualate have been deposited in the Protein Data Bank under accession codes 6N4X, 6N4Y, and 6N50 respectively. Cryo-EM Maps of apo mGlu5 in nanodiscs, apo mGlu5 bound to Nb43 and active mGlu5 bound to Nb43 and L-quisqualate in GDN have been deposited in the Electron Microscopy Data Bank under accession codes 0346, 0347, and 0345 respectively. The atomic coordinates of apo mGlu5 and active mGlu5 bound to Nb43 and L-quisqualate have been deposited in the Protein Data Bank under accession codes 6N52 and 6N51 respectively.
References
- 1.Niswender CM & Conn PJ Metabotropic Glutamate Receptors: Physiology, Pharmacology, and Disease. Annu. Rev. Pharmacol. Toxicol 50, 295–322 (2010). [DOI] [PMC free article] [PubMed] [Google Scholar]
- 2.Pin J-P & Bettler B Organization and functions of mGlu and GABA. Nature 540, 60–68 (2016). [DOI] [PubMed] [Google Scholar]
- 3.Kunishima N et al. Structural basis of glutamate recognition by a dimeric metabotropic glutamate receptor. Nature 407, 971–977 (2000). [DOI] [PubMed] [Google Scholar]
- 4.Kniazeff J et al. Closed state of both binding domains of homodimeric mGlu receptors is required for full activity. Nat. Struct. Mol. Biol 11, 706–713 (2004). [DOI] [PubMed] [Google Scholar]
- 5.Hlavackova V et al. Sequential inter- and intrasubunit rearrangements during activation of dimeric metabotropic glutamate receptor 1. Sci Signal 5, ra59–ra59 (2012). [DOI] [PubMed] [Google Scholar]
- 6.Wu H et al. Structure of a class C GPCR metabotropic glutamate receptor 1 bound to an allosteric modulator. Science 344, 58–64 (2014). [DOI] [PMC free article] [PubMed] [Google Scholar]
- 7.Doré AS et al. Structure of class C GPCR metabotropic glutamate receptor 5 transmembrane domain. Nature 511, 557–562 (2014). [DOI] [PubMed] [Google Scholar]
- 8.Christopher JA et al. Fragment and Structure-Based Drug Discovery for a Class C GPCR: Discovery of the mGlu5 Negative Allosteric Modulator HTL14242 (3-Chloro-5-[6-(5-fluoropyridin-2-yl)pyrimidin-4-yl]benzonitrile). J. Med. Chem 58, 6653–6664 (2015). [DOI] [PubMed] [Google Scholar]
- 9.Christopher JA et al. Structure-Based Optimization Strategies for G Protein-Coupled Receptor (GPCR) Allosteric Modulators: A Case Study from Analyses of New Metabotropic Glutamate Receptor 5 (mGlu5) X-ray Structures. J. Med. Chem acs.jmedchem.7b01722 (2018). doi: 10.1021/acs.jmedchem.7b01722 [DOI] [PubMed] [Google Scholar]
- 10.Thal DM, Glukhova A, Sexton PM & Christopoulos A Structural insights into G-protein-coupled receptor allostery. Nature 559, 45–53 (2018). [DOI] [PubMed] [Google Scholar]
- 11.Goudet C et al. Heptahelical domain of metabotropic glutamate receptor 5 behaves like rhodopsin-like receptors. Proc. Natl. Acad. Sci. U.S.A 101, 378–383 (2004). [DOI] [PMC free article] [PubMed] [Google Scholar]
- 12.Moustaine El, D. et al. Distinct roles of metabotropic glutamate receptor dimerization in agonist activation and G-protein coupling. Proceedings of the National Academy of Sciences 109, 16342–16347 (2012). [DOI] [PMC free article] [PubMed] [Google Scholar]
- 13.Manglik A, Kobilka BK & Steyaert J Nanobodies to Study G Protein-Coupled Receptor Structure and Function. Annu. Rev. Pharmacol. Toxicol 57, 19–37 (2017). [DOI] [PMC free article] [PubMed] [Google Scholar]
- 14.Kinney GG et al. A novel selective positive allosteric modulator of metabotropic glutamate receptor subtype 5 has in vivo activity and antipsychotic-like effects in rat behavioral models. J. Pharmacol. Exp. Ther 313, 199–206 (2005). [DOI] [PubMed] [Google Scholar]
- 15.Gregory KJ et al. Investigating metabotropic glutamate receptor 5 allosteric modulator cooperativity, affinity, and agonism: enriching structure-function studies and structure-activity relationships. Mol. Pharmacol 82, 860–875 (2012). [DOI] [PMC free article] [PubMed] [Google Scholar]
- 16.Bradley SJ, Langmead CJ, Watson JM & Challiss RAJ Quantitative analysis reveals multiple mechanisms of allosteric modulation of the mGlu5 receptor in rat astroglia. Mol. Pharmacol 79, 874–885 (2011). [DOI] [PMC free article] [PubMed] [Google Scholar]
- 17.Noetzel MJ et al. Functional impact of allosteric agonist activity of selective positive allosteric modulators of metabotropic glutamate receptor subtype 5 in regulating central nervous system function. Mol. Pharmacol 81, 120–133 (2012). [DOI] [PMC free article] [PubMed] [Google Scholar]
- 18.Bradley SJ, Watson JM & Challiss RAJ Effects of positive allosteric modulators on single-cell oscillatory Ca2+ signaling initiated by the type 5 metabotropic glutamate receptor. Mol. Pharmacol 76, 1302–1313 (2009). [DOI] [PMC free article] [PubMed] [Google Scholar]
- 19.Doumazane E et al. Illuminating the activation mechanisms and allosteric properties of metabotropic glutamate receptors. Proceedings of the National Academy of Sciences 110, E1416–25 (2013). [DOI] [PMC free article] [PubMed] [Google Scholar]
- 20.Chappell MD et al. Discovery of (1S,2R,3S,4S,5R,6R)-2-Amino-3-[(3,4-difluorophenyl)sulfanylmethyl]-4-hydroxy-bicyclo[3.1.0]hexane-2,6-dicarboxylic Acid Hydrochloride (LY3020371·HCl): A Potent, Metabotropic Glutamate 2/3 Receptor Antagonist with Antidepressant-Like Activity. J. Med. Chem 59, 10974–10993 (2016). [DOI] [PubMed] [Google Scholar]
- 21.Huang S et al. Interdomain movements in metabotropic glutamate receptor activation. Proc. Natl. Acad. Sci. U.S.A 108, 15480–15485 (2011). [DOI] [PMC free article] [PubMed] [Google Scholar]
- 22.Siméon FG et al. Synthesis and simple 18F-labeling of 3-fluoro-5-(2-(2-(fluoromethyl)thiazol-4-yl)ethynyl)benzonitrile as a high affinity radioligand for imaging monkey brain metabotropic glutamate subtype-5 receptors with positron emission tomography. J. Med. Chem 50, 3256–3266 (2007). [DOI] [PubMed] [Google Scholar]
- 23.Muto T, Tsuchiya D, Morikawa K & Jingami H Structures of the extracellular regions of the group II/III metabotropic glutamate receptors. Proc. Natl. Acad. Sci. U.S.A 104, 3759–3764 (2007). [DOI] [PMC free article] [PubMed] [Google Scholar]
- 24.Ray K & Hauschild BC Cys-140 is critical for metabotropic glutamate receptor-1 dimerization. J. Biol. Chem 275, 34245–34251 (2000). [DOI] [PubMed] [Google Scholar]
- 25.Manglik A et al. Structural Insights into the Dynamic Process of β2-Adrenergic Receptor Signaling. Cell 161, 1101–1111 (2015). [DOI] [PMC free article] [PubMed] [Google Scholar]
- 26.Rosenbaum DM et al. Structure and function of an irreversible agonist-β(2) adrenoceptor complex. Nature 469, 236–240 (2011). [DOI] [PMC free article] [PubMed] [Google Scholar]
- 27.Levitz J et al. Mechanism of Assembly and Cooperativity of Homomeric and Heteromeric Metabotropic Glutamate Receptors. Neuron 92, 143–159 (2016). [DOI] [PMC free article] [PubMed] [Google Scholar]
- 28.Stenkamp RE Identifying G protein-coupled receptor dimers from crystal packings. Acta Crystallogr D Struct Biol 74, 655–670 (2018). [DOI] [PubMed] [Google Scholar]
- 29.Milligan G G protein-coupled receptor hetero-dimerization: contribution to pharmacology and function. Br. J. Pharmacol 158, 5–14 (2009). [DOI] [PMC free article] [PubMed] [Google Scholar]
- 30.James JR, Oliveira MI, Carmo AM, Iaboni A & Davis SJ A rigorous experimental framework for detecting protein oligomerization using bioluminescence resonance energy transfer. Nat Meth 3, 1001–1006 (2006). [DOI] [PubMed] [Google Scholar]
- 31.Xue L et al. Major ligand-induced rearrangement of the heptahelical domain interface in a GPCR dimer. Nat Chem Biol 11, 134–140 (2015). [DOI] [PubMed] [Google Scholar]
- 32.Isberg V et al. Generic GPCR residue numbers - aligning topology maps while minding the gaps. Trends Pharmacol. Sci 36, 22–31 (2015). [DOI] [PMC free article] [PubMed] [Google Scholar]
- 33.Rondard P, Rovira X, Goudet C & Pin J-P in mGLU Receptors 25, 129–147 (Springer International Publishing, 2017). [Google Scholar]
- 34.Geng Y, Bush M, Mosyak L, Wang F & Fan QR Structural mechanism of ligand activation in human GABAB receptor. Nature 504, 254–259 (2013). [DOI] [PMC free article] [PubMed] [Google Scholar]
- 35.Geng Y et al. Structural mechanism of ligand activation in human calcium-sensing receptor. eLife 5, 213 (2016). [DOI] [PMC free article] [PubMed] [Google Scholar]
- 36.Martín M, Sanz JM & Cubero A Characterization of metabotropic glutamate receptors coupled to a pertussis toxin sensitive G-protein in bovine brain coated vesicles. FEBS Lett 316, 191–196 (1993). [DOI] [PubMed] [Google Scholar]
- 37.Doornbos MLJ et al. Molecular mechanism of positive allosteric modulation of the metabotropic glutamate receptor 2 by JNJ-46281222. Br. J. Pharmacol 173, 588–600 (2016). [DOI] [PMC free article] [PubMed] [Google Scholar]
- 38.Kabsch W XDS. Acta Crystallogr. D Biol. Crystallogr 66, 125–132 (2010). [DOI] [PMC free article] [PubMed] [Google Scholar]
- 39.Evans P Scaling and assessment of data quality. Acta Crystallogr. D Biol. Crystallogr 62, 72–82 (2006). [DOI] [PubMed] [Google Scholar]
- 40.Winn MD et al. Overview of the CCP4 suite and current developments. Acta Crystallogr. D Biol. Crystallogr 67, 235–242 (2011). [DOI] [PMC free article] [PubMed] [Google Scholar]
- 41.Waterhouse A et al. SWISS-MODEL: homology modelling of protein structures and complexes. Nucleic Acids Res 46, W296–W303 (2018). [DOI] [PMC free article] [PubMed] [Google Scholar]
- 42.Adams PD et al. The Phenix software for automated determination of macromolecular structures. Methods 55, 94–106 (2011). [DOI] [PMC free article] [PubMed] [Google Scholar]
- 43.Emsley P & Cowtan K Coot: model-building tools for molecular graphics. Acta Crystallogr. D Biol. Crystallogr 60, 2126–2132 (2004). [DOI] [PubMed] [Google Scholar]
- 44.Bricogne G. et al. BUSTER. version 2.10.3. [Google Scholar]
- 45.Murshudov GN, Vagin AA & Dodson EJ Refinement of macromolecular structures by the maximum-likelihood method. Acta Crystallogr. D Biol. Crystallogr 53, 240–255 (1997). [DOI] [PubMed] [Google Scholar]
- 46.Smart OS et al. Exploiting structure similarity in refinement: automated NCS and target-structure restraints in BUSTER. Acta Crystallogr. D Biol. Crystallogr 68, 368–380 (2012). [DOI] [PMC free article] [PubMed] [Google Scholar]
- 47.Williams CJ et al. MolProbity: More and better reference data for improved all-atom structure validation. Protein Sci 27, 293–315 (2018). [DOI] [PMC free article] [PubMed] [Google Scholar]
- 48.Pardon E et al. A general protocol for the generation of Nanobodies for structural biology. Nat Protoc 9, 674–693 (2014). [DOI] [PMC free article] [PubMed] [Google Scholar]
- 49.Cosford NDP et al. 3-[(2-Methyl-1,3-thiazol-4-yl)ethynyl]-pyridine: a potent and highly selective metabotropic glutamate subtype 5 receptor antagonist with anxiolytic activity. J. Med. Chem 46, 204–206 (2003). [DOI] [PubMed] [Google Scholar]
- 50.Vélez-Ruiz GA & Sunahara RK Reconstitution of G protein-coupled receptors into a model bilayer system: reconstituted high-density lipoprotein particles. Methods Mol. Biol 756, 167–182 (2011). [DOI] [PMC free article] [PubMed] [Google Scholar]
- 51.Lindsley CW et al. Discovery of Positive Allosteric Modulators for the Metabotropic Glutamate Receptor Subtype 5 from a Series of N-(1,3-Diphenyl-1 H- pyrazol-5-yl)benzamides That Potentiate Receptor Function in Vivo. J. Med. Chem 47, 5825–5828 (2004). [DOI] [PubMed] [Google Scholar]
- 52.Zheng S, Palovcak E, Armache J-P, Cheng Y & Agard D Anisotropic Correction of Beam-induced Motion for Improved Single-particle Electron Cryo-microscopy (2016). doi: 10.1101/061960 [DOI] [PMC free article] [PubMed] [Google Scholar]
- 53.Zhang K Gctf: Real-time CTF determination and correction. Journal of Structural Biology 193, 1–12 (2016). [DOI] [PMC free article] [PubMed] [Google Scholar]
- 54.Scheres SHW Journal of Structural Biology. Journal of Structural Biology 180, 519–530 (2012). [DOI] [PMC free article] [PubMed] [Google Scholar]
- 55.Punjani A, Rubinstein JL, Fleet DJ & Brubaker MA cryoSPARC: algorithms for rapid unsupervised cryo-EM structure determination. Nat Meth 14, 290–296 (2017). [DOI] [PubMed] [Google Scholar]
- 56.Heymann JB & Belnap DM Bsoft: image processing and molecular modeling for electron microscopy. Journal of Structural Biology 157, 3–18 (2007). [DOI] [PubMed] [Google Scholar]
- 57.Humphrey W, Dalke A & Schulten K VMD: Visual molecular dynamics. Journal of Molecular Graphics 14, 33–38 (1996). [DOI] [PubMed] [Google Scholar]
- 58.Phillips JC et al. Scalable molecular dynamics with NAMD. J Comput Chem 26, 1781–1802 (2005). [DOI] [PMC free article] [PubMed] [Google Scholar]
- 59.Robertson MJ, Tirado-Rives J & Jorgensen WL Improved Peptide and Protein Torsional Energetics with the OPLSAA Force Field. J Chem Theory Comput 11, 3499–3509 (2015). [DOI] [PMC free article] [PubMed] [Google Scholar]
Associated Data
This section collects any data citations, data availability statements, or supplementary materials included in this article.