

Abstract
Metabolic programming of bone marrow stromal cells (BMSCs) could influence the function of progenitor osteoblasts or adipocytes and hence determine skeletal phenotypes. Adipocytes predominantly utilize oxidative phosphorylation, whereas osteoblasts use glycolysis to meet ATP demand. Here, we compared progenitor differentiation from the marrow of two inbred mouse strains, C3H/HeJ (C3H) and C57BL6J (B6). These strains differ in both skeletal mass and bone marrow adiposity. We hypothesized that genetic regulation of metabolic programs controls skeletal stem cell fate. Our experiments identified Bcl-2–like protein 13 (Bcl2l13), a mitochondrial mitophagy receptor, as being critical for adipogenic differentiation. We also found that Bcl2l13 is differentially expressed in the two mouse strains, with C3H adipocyte progenitor differentiation being accompanied by a >2-fold increase in Bcl2l13 levels relative to B6 marrow adipocytes. Bcl2l13 expression also increased during adipogenic differentiation in mouse ear mesenchymal stem cells (eMSCs) and the murine preadipocyte cell line 3T3-L1. The higher Bcl2l13 expression correlated with increased mitochondrial fusion and biogenesis. Importantly, Bcl2l13 knockdown significantly impaired adipocyte differentiation in both 3T3-L1 cells and eMSCs. Mechanistically, Bcl2l13 knockdown reprogrammed cells to rely more on glycolysis to meet ATP demand in the face of impaired oxidative phosphorylation. Bcl2l13 knockdown in eMSCs increased mitophagy. Moreover, Bcl2l13 prevented apoptosis during adipogenesis. Our findings indicate that the mitochondrial receptor Bcl2l13 promotes adipogenesis by increasing oxidative phosphorylation, suppressing apoptosis, and providing mitochondrial quality control through mitophagy. We conclude that genetic programming of metabolism may be important for lineage determination and cell function within the bone marrow.
Keywords: B-cell lymphoma 2 (Bcl-2) family, adipogenesis, mitochondria, apoptosis, mitophagy, adipocyte, bone marrow, mitochondrial metabolism, energy metabolism, Bcl-2-like protein 13 (Bcl2l13), lineage determination, metabolic reprogramming, oxidative phosphorylation
Introduction
There is increasing awareness of the importance of understanding bone marrow adiposity because of its intimate relationship to bone remodeling and systemic energy metabolism (1). Bone marrow stromal cells (BMSCs)2 give rise to both osteoblasts and adipocytes that ultimately direct bone and adipose generation within the niche. Lineage-specific transcription factors have traditionally been thought to direct BMSC fate into preosteoblasts or preadipocytes. Several transcription factors regulate adipogenesis, including peroxisome proliferator-activated receptor γ (PPARγ), CCAAT/enhancer-binding protein α (CEBPα) during early differentiation, and fatty acid–binding protein (FABP4) in terminal differentiation. We previously reported that C3H/HeJ (C3H) mice have higher bone mass yet markedly more marrow adiposity than C57BL/6J (B6) despite similar body weights (2). We also noted that C3H calvarial osteoblasts exhibited greater oxidative phosphorylation than but similar glycolytic rates as B6 mice (3), and that preadipocytes predominantly utilize oxidative phosphorylation to generate ATP, whereas preosteoblasts utilize glycolysis (4). Thus, we hypothesized that BMSCs from C3H mice were metabolically programmed to increase bone marrow adipogenesis via enhanced oxidative phosphorylation.
Bcl-2–like protein 13 (Bcl2l13) is a member of the B cell lymphoma 2 (BCL-2) family known for its central role in regulating apoptosis and ubiquitously expressed in human cells (5). Recently, it has been reported that Bcl2l13 is a mammalian homolog of yeast Atg32 that mediates mitophagy and mitochondrial fragmentation (6). It binds to cleaved type II light chain 3 (LC3-II), the main component of the autophagosomal membrane, to allow the mitochondria to be engulfed within an autophagosome. Bcl2l13 is thought to have a role in controlling the proper quality and quantity of mitochondria to maintain proper cellular homeostasis via regulation of mitophagy, but its physiological and pathological role in stromal cell differentiation is still unclear.
Due to the high oxidative phosphorylation requirement in adipocytes, mitochondrial regulatory mechanisms are critical during adipogenesis. In support of this notion, recent studies have shown that mitochondrial biogenesis increases with 1) adipogenic differentiation of human MSCs (7), 2) progression of brown/beige adipocyte differentiation in white adipose tissue (8), and 3) regulation of mitochondrial content through autophagy pathways. The latter in turn has been suggested to be critical for maintaining and controlling “beiging” during thermogenesis (9). Furthermore, a recent report implicated a role for Bcl2l13 in promoting beiging in response to cold and adrenergic activation (10). Despite these initial reports, there is still no clear mechanistic understanding of how Bcl2l13 regulates adipogenesis. To this end, using C3H mice as a model, we found that the mitochondrial mitophagy receptor Bcl2l13 was essential for increasing oxidative phosphorylation activity by regulating mitophagy and apoptosis during adipocyte differentiation. These new insights reflect a growing appreciation of how metabolic programming might influence lineage allocation in the bone marrow.
Results
BMSCs in C3H mice showed higher differentiation ability for adipocytes and osteoblasts than that in B6 mice
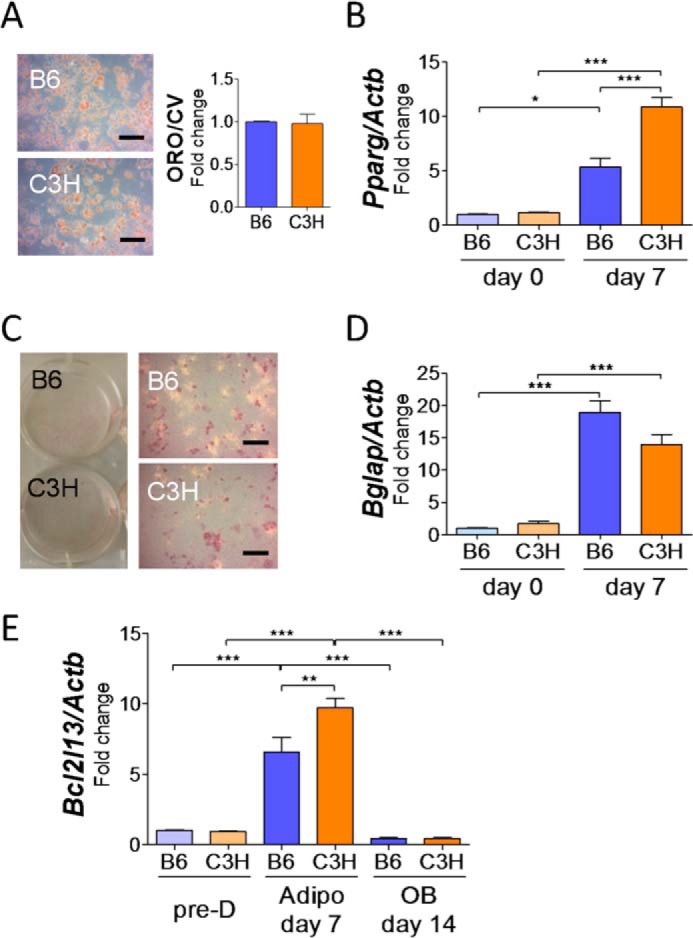
BMSCs from both B6 and C3H strains were cultured with adipogenic medium for 9 days or with osteogenic medium for 14 days. As for adipogenic differentiation, BMSCs from C3H mice showed significantly high staining with Oil Red O (Fig. 1A). Pparg expression in C3H BMSCs was increased during adipogenesis and significantly higher than that of B6 mice (Fig. 1B). Other adipocyte marker genes, Cebpα and Adipoq, also showed a trend toward higher expression in C3H than in B6. Osteogenic differentiation cultures showed higher alkaline phosphatase activity and von Kossa mineralization in BMSCs of C3H mice than that of B6 mice (Fig. 1C). The expression of Osterix (Sp7) was significantly greater in BMSCs from C3H mice in osteogenic media with increases in other osteogenic genes (Fig. 1D). Mouse ear mesenchymal stem cells (eMSCs), which have been shown to differentiate into adipocytes in vitro (11), also showed similar genetic patterns in adipogenic culture, although osteogenic induction was not sufficient to compare with BMSCs (Fig. 2, A–D).
Figure 1.

Comparison of differentiation ability in BMSCs from B6 and C3H mice and identification of Bcl2l13 as a specific factor of adipogenesis. A and B, BMSCs from B6 and C3H mice after 9 days in adipogenic differentiation medium. A, Oil Red O staining, scale bars = 10 μm. ORO/CV, Oil Red O/crystal violet ratio, relative to B6 levels. n = 3. B, relative mRNA levels of Pparg, Cebpa, and Adipoq. The value for B6 on day 0 was set as 1. n = 3. C and D, BMSCs from B6 and C3H mice after 14 days in osteogenic differentiation medium. C, alkaline phosphatase (red) and Von Kossa (black) staining. Scale bars, 10 μm. D, relative mRNA levels of Bglap, Alpl, SP7, and Runx2. The value for B6 on day 0 was set as 1. n = 3. E, scheme of the inversion on chromosome 6 in the C3H/HeJ mouse. Bcl2l13 gene is located at 9 kb downstream of the distal cut point. F and G, relative mRNA levels (F) and protein levels (G) of BCL2L13 during adipogenic and osteogenic differentiation culture. Pre-D, predifferentiation; Adipo, adipogenesis; OB, osteogenesis; ACTB, β-actin. The value for B6 in predifferentiation was set as 1. n = 3. *, p < 0.05; **, p < 0.01; ***, p < 0.001. Error bars, S.E.
Figure 2.
Comparison of differentiation ability and Bcl2l13 expression in eMSCs from B6 and C3H mice. eMSCs from B6 and C3H mice after 7 days with adipogenic or 14 days with osteogenic medium. A, Oil Red O staining in adipogenesis. Scale bars, 10 μm. ORO/CV, Oil Red O/crystal violet ratio, relative to B6 levels. n = 3. B, relative mRNA levels of Pparg in adipogenesis. The value for B6 on day 0 was set as 1. n = 3. C, alkaline phosphatase (red) and Von Kossa (black) staining in osteogenesis. Scale bars, 10 μm. D, relative mRNA levels of Bglap in osteogenesis. The value for B6 on day 0 was set as 1. n = 3. E, relative mRNA levels of Bcl2l13 in adipogenic or osteogenic culture. The value for B6 on predifferentiation was set as 1. n = 3. Pre-D, predifferentiation; Adipo, adipogenesis; OB, osteogenesis. *, p < 0.05; **, p < 0.01; ***, p < 0.001. Error bars, S.E.
The expression of mitochondrial mitophagy receptor Bcl2l13 in BMSCs was higher in C3H mice than in B6 mice during adipogenesis
Next, we asked whether metabolic determinants could be responsible for the enhanced marrow adipogenic phenotypes in C3H/HeJ mice, which have a unique homozygous chromosomal inversion on chromosome 6 from 62 to 116 Mb (12). The cut point for the distal inversion is located only 9 kb upstream of Bcl2l13, which encodes a mitochondrial mitophagy receptor protein (Fig. 1E). Bcl2l13 transcript and protein expression during adipogenic or osteogenic culture of BMSCs demonstrated that Bcl2l13 was significantly higher in BMSCs with adipogenesis compared with predifferentiation. Furthermore, BMSCs from C3H mice cultured in adipogenic medium had a 2.7- and 2.6-fold increase of Bcl2l13 in gene and protein expression relative to that from B6 mice, respectively. Meanwhile, during osteogenesis, Bcl2l13 gene and protein expression showed a slight increase, but there was no difference between B6 and C3H (Fig. 1, F and G). Bcl2l13 also had a higher expression pattern in eMSCs during adipogenic culture (Fig. 2E).
Higher Bcl2l13 gene and protein during adipogenesis is accompanied by mitochondrial biogenesis and dynamics in BMSCs
To confirm the association between adipogenesis and Bcl2l13, gene expression in BMSCs from B6 mice was performed. During 9 days of adipogenesis, Bcl2l13 expression increased progressively in a pattern similar to that of the adipocyte marker genes, Pparg and Adipoq (Fig. 3A). Accompanied by this increase of Bcl2l13 expression, mitochondrial/nuclear DNA ratio (Mt/N) also increased during adipogenesis (Fig. 3B), revealing that the amount of mitochondria was increased during adipocyte differentiation of BMSCs. Assaying for mitochondrial fusion protein mitofusin-2 (MFN2) showed a significant increase during adipogenesis but not in osteogenesis (Fig. 3C), again reinforcing the tenet that oxidative phosphorylation is necessary for adipocyte differentiation.
Figure 3.

Bcl2l13 expression and mitochondrial biogenesis and dynamics in BMSCs from B6 mice during adipogenic differentiation. A, relative mRNA levels of Bcl2l13, Pparg, and Adipoq in B6 BMSCs during a 9-day adipogenic culture. The value for day 0 was set as 1. n = 3. **, p < 0.01 versus day 0; ***, p < 0.001 versus day 0; ##, p < 0.01 versus day 3. B, mitochondrial/nuclear DNA ratio (Mt/N) shown by the rate of mitochondrial DNA (Mito) and β2-microglobulin (B2M). n = 3. C, Western blotting for MFN2 protein during adipogenesis or osteogenesis and its relative protein level. Pre-D, predifferentiation; Adipo, adipogenesis; OB, osteogenesis; ACTB, β-actin. The value for predifferentiation was set as 1. n = 3. **, p < 0.01. Error bars, S.E.
Bcl2l13 knockdown in 3T3-L1 cells suppressed adipogenic differentiation, mitochondrial biogenesis, and mitochondrial dynamics
Bcl2l13 knockdown in 3T3-L1 cells by siRNA revealed that Bcl2l13 expression, which was increased during adipogenesis, led to ∼90 and 54% significant reduction by the knockdown after 3 and 6 days, respectively (Fig. 4A). The knockdown also showed a 50% reduction in its protein levels on day 6 (Fig. 4B). There was a morphological difference between the knockdown and control cells (Fig. S1A). The Bcl2l13 knockdown caused a significant impairment in adipocyte differentiation as shown by decreased Oil O Red staining (Fig. 4C). The expression of Pparg during adipogenesis was significantly decreased in knockdown cells compared with control. The knockdown also decreased the other adipocyte marker genes, Fabp4 and Adipoq, and increased preadipocyte marker gene Dlk1, but not significantly (Fig. 4D). The mitochondrial/nuclear DNA ratio in 3T3-L1 cells increased during adipogenesis and was significantly decreased by Bcl2l13 knockdown (Fig. 4E). The knockdown resulted in a significant decrease of mitochondrial fusion protein MFN2, along with a decrease in the total amount of mitochondrial fission protein dynamin-related protein-1 (DRP1) (Fig. 4F). Both the expression of phosphorylated DRP1, serine 616 (fission activation) and serine 637 (fission inactivation), did not show differences between the knockdown and control cells.
Figure 4.

Bcl2l13 knockdown in 3T3-L1 cells during adipogenesis. 3T3-L1 cells with transduction of scramble siRNA (Scr) or Bcl2l13 siRNA were cultured in adipogenic medium for 6 days. A, relative mRNA levels of Bcl2l13. The value for scramble on day 0 was set as 1. n = 3. B, BCL2L13 protein level. The arrow in Western blotting shows a specific band of BCL2L13. CYPA, cyclophilin A. The value for scramble was set as 1. n = 3. C, Oil Red O staining. Scale bars, 10 μm. ORO/CV, Oil Red O/crystal violet ratio. The value for scramble was set as 1. n = 3. D, relative mRNA levels of Pparg, Fabpa, Adipoq, and Dlk1. The value for scramble on day 0 was set as 1. n = 3. E, mitochondrial/nuclear DNA ratio (Mt/N) shown by the rate of mitochondrial DNA (Mito) and β2-microglobulin (B2M). n = 3. F, Western blotting of mitochondrial fission/fusion proteins and relative protein level of MFN2. The value for scramble was set as 1. T-DRP1, total DRP1; pDRP1, phosphorylated DRP1; Ser616, serine 616; Ser637, serine 637; CYPA, cyclophilin A. n = 3. *, p < 0.05; **, p < 0.01; ***, p < 0.001. Error bars, S.E.
Knockdown of Bcl2l13 expression in 3T3-L1 cells inhibited oxidative phosphorylation and resulted in increased glycolysis
Given the functional role for Bcl2l13 in mitochondrial respiration during adipogenesis, we studied oxidative phosphorylation and glycolysis of 3T3-L1 cells with Bcl2l13 knockdown during adipogenic or nondifferentiation culture conditions. Using the Agilent XF Cell Mito Stress Test, 3T3-L1 cells with Bcl2l13 knockdown showed no difference of oxygen consumption rate (OCR) in nondifferentiation culture but significantly lower OCR in adipogenic cultures compared with control (Fig. 5A). In addition, the Bcl2l13 knockdown cells revealed a higher extracellular acidification rate (ECAR) than control during both nondifferentiation and adipogenic cultures (Fig. 5B). The seahorse XFp glycolytic rate assay demonstrated that glycolytic ATP production, like total ATP production, was significantly higher in Bcl2l13 knockdown cells than in control in both adipogenic and nondifferentiation culture (Fig. 5C).
Figure 5.

Mitochondrial respiratory function analysis in 3T3-L1 cells with Bcl2l13 knockdown. 3T3-L1 cells with transduction of scramble siRNA (Scr) or Bcl2l13 siRNA were cultured in nondifferentiation or adipogenic medium for 6 days. A and B, OCRs (A) and ECAR (B). Oligomycin (Oligo), FCCP, and the combination of antimycin and rotenone (Anti/Rot) were injected in sequence. Basal, basal respiration; Maximal, maximal respiration; Spare, spare respiration capacity. Data shown are representative of three independent seahorse runs. C, ATP production rate from mitochondrial respiration (mito-ATP) or glycolysis (glyco-ATP), calculated from rate of proton efflux from total and respiration. p values are for glycolytic contribution (dashed lines) and total ATP production rate (solid lines). *, p < 0.05; **, p < 0.01; ***, p < 0.001. Error bars, S.E.
Bcl2l13 knockdown in eMSCs with nondifferentiation culture increased mitophagy
In eMSCs, Bcl2l13 knockdown by siRNA resulted in more than 75% reduction in Bcl2l13 expression in both gene and protein levels after 6 days of adipogenesis, respectively (Fig. 6, A and B). Morphological change was induced in the knockdown cells as well as 3T3-L1 cells (Fig. S1B). Oil Red O staining also revealed significant suppression of adipocyte differentiation in the knockdown eMSCs (Fig. 6C). The expression of adipogenic marker genes and mitochondrial/nuclear DNA ratio showed a decrease in the knockdown cells (Fig. S2).
Figure 6.

Mitophagy analysis of eMSCs with Bcl2l13 knockdown. eMSCs with transduction of scramble siRNA (Scr) or Bcl2l13 siRNA were cultured in nondifferentiation (NonD) or adipogenic (Adipo) medium for 6 days. A, relative mRNA levels of Bcl2l13. The value for scramble on day 0 was set as 1. n = 3. B, BCL2L13 protein level. CYPA, cyclophilin A. The value for scramble was set as 1. n = 3. C, Oil Red O staining; scale bars, 10 μm. ORO/CV, Oil Red O/crystal violet ratio. The value for scramble was set as 1. n = 3. D, confocal microscope images of eMSCs from mito-QC mice cultured with nondifferentiation medium. In contrast to the yellow region (merge of GFP and mCherry, representing cytosolic mitochondria), red spots (only mCherry-positive, representing mitolysosomes) were observed. Scale bars, 20 μm. E, comparison of mitophagy/mitochondria ratio among each culture group of mito-QC eMSCs. n = 49, 57, 54, and 59 for scramble, scramble + DFP, siRNA, and siRNA + DFP group, respectively. F, relative mRNA levels of Bnip3, Bnip3l, Pink1, and Parkin2 during nondifferentiation or adipogenic culture. The value for scramble on day 0 was set as 1. n = 3. *, p < 0.05; **, p < 0.01; ***, p < 0.001. Error bars, S.E.
Using primary eMSCs from mito-QC mice, which have mCherry-GFP tandem-tagged mitochondria for the visualization of mitochondrial architecture and mitophagy (13), we quantified the degree of mitophagy in the Bcl2l13 knockdown cells. When there is active mitophagy taking place, we can visualize the lysosome-engulfed mitochondria as mCherry-positive red spots. After a 6-day culture in nondifferentiation medium, the mCherry-positive red spots were confirmed in confocal microscopy images (Fig. 6D). Using ImageJ, the pixels of each mitochondria and mitophagy region were quantified, and the ratio of mitophagy in the mitochondria was calculated (Fig. S3). As a result, in the cells with scramble siRNA, the mitophagy/mitochondria scores were significantly increased by 1.73-fold with the mitophagy inducer deferiprone (DFP). Surprisingly, the mitophagy/mitochondria scores in the cells with Bcl2l13 knockdown showed a significant increase compared with control by 1.39-fold, and furthermore, the addition of DFP led to significant decrease of mitophagy in the knockdown eMSCs by 0.85-fold (Fig. 6E). Real-time PCR for the expression of the genes associated with other mitophagy systems, Bnip3, Bnip3l (coding Nix), Pink1, and Prkn2, was performed. Bnip3, Pink1, and Prkn2 showed a significant increase during adipogenesis, although there was no difference between Bcl2l13 knockdown and control in their expression except Prkn2 (Fig. 6F).
Bcl2l13 suppressed apoptosis during adipogenic differentiation
The number of 3T3-L1 cells with or without Bcl2l13 knockdown was counted at 6 days of adipogenic or nondifferentiation culture. As a result, the cell population showed significant decrease in Bcl2l13 knockdown cells in both cultures compared with control cells (Fig. 7A). Annexin V and propidium iodide (PI) staining flow cytometry performed after adipogenic culture in 3T3-L1 cells revealed that the ratio of annexin V–positive and PI-negative cells, which represent early apoptotic cells, was significantly higher in Bcl2l13 knockdown cells (24.0%) compared with control (7.4%) (Fig. 7B).
Figure 7.

Apoptosis analysis of 3T3-L1 cells with Bcl2l13 knockdown. 3T3-L1 cells with transduction of scramble siRNA (Scr) or Bcl2l13 siRNA were cultured in nondifferenatiation (NonD) or adipogenic (Adipo) medium for 6 days. A, the cell population of 3T3-L1 cells, which were detached and resuspended in 1 ml of medium. n = 4. B, flow cytometry analysis on day 6 of adipogenic culture. The x and y axes represent annexin V (AV) and PI, respectively. p value is for cell rate of early apoptosis (AV+PI−). *, p < 0.05; **, p < 0.01; ***, p < 0.001. Error bars, S.E.
Reactive oxygen species (ROS) production was not significantly changed in 3T3-L1 cells with Bcl2l13 knockdown
3T3-L1 cells with Bcl2l13 knockdown were stained with the ROS-responsive dye CellROX Deep Red and analyzed by flow cytometry. During adipogenesis, the rate of ROS-positive living cells was significantly increased by 3 times in cells with both scramble and Bcl2l13 siRNA. In nondifferentiation culture, Bcl2l13 knockdown cells showed an increased tendency in ROS-positive rate by 2.0-fold compared with control, although it was not statistically significant (Fig. S4). Hence, increased ROS was not responsible for the changes in mitochondrial activity in the knockdown cells.
Discussion
In this work, we demonstrated that the mitochondrial mitophagy receptor Bcl2l13 is necessary for adipogenesis, but not osteogenesis, in the marrow and that it provides a quality control mechanism for oxidative phosphorylation via regulation of mitophagy and apoptosis during adipogenesis.
Initially, we sought to test the hypothesis that BMSCs from C3H/HeJ mice were metabolically programmed to increase bone marrow adipogenesis via enhanced oxidative phosphorylation, by determining the responsible gene or genes that drove bone marrow adipocyte differentiation and their relationship to mitochondrial function. After confirming the higher differentiation capacity of C3H BMSCs during both adipogenesis and osteogenesis, we found differential expression of the Bcl2l13 gene, which is located only 9.0 kb downstream of the distal cut point of a unique chromosomal inversion in C3H/HeJ mice (14). Results of higher Bcl2l13 gene and protein expression in BMSCs from C3H versus B6 during adipogenesis but not osteogenesis implied that Bcl2l13 was directly related to adipocyte differentiation. It is noteworthy that we previously made a congenic mouse B6.C3H.6T (6T) that had the same genomic background of the C57BL6J mouse but with the chromosomal 6 inversion of C3H/HeJ backcrossed 10 generations (15). Unlike C3H, the 6T mice had B6 alleles for Bcl2l13 combined with the more proximal C3H alleles in the inversion yet only showed high bone marrow adiposity after being exposed to a high-fat diet (12, 16). Furthermore, stromal cells from the bone marrow of 6T mice in vitro did not show an increase in adipogenesis relative to BMSCs from B6 mice.3 Thus, the genetic background of Bcl2l13 and the presence of more proximal enhancers or repressors in the inverted chromosomal region ultimately determine its expression in C3H/HeJ mice. Nevertheless, adipogenic differentiation and the function of mitochondria were directly related to high Bcl2l13 expression during adipogenesis in BMSCs and eMSCs of C3H/HeJ mice.
Bcl2l13 knockdown in 3T3-L1 cells and eMSCs decreased Oil Red O staining and reduced the master adipogenic transcriptional factor Pparg mRNA. This strongly suggested a critical role of Bcl2l13 in the regulation of adipogenesis. Fabp4 coding FABP4, which reversibly binds to fatty acids in adipocytes to regulate their storage (17–19), was also decreased following knockdown. On the other hand, Dlk1 coding preadipocyte factor-1 (PREF1), an inhibitor of adipogenesis (20) and regulator of MSCs adipogenesis (21), showed a slight but not significant increase after the knockdown of Bcl2l13 in 3T3-L1 cells. These results suggested that reduced Bcl2l13 might partially contribute to a deficiency in fatty acid storage or regulation during preadipocyte differentiation.
Recently, it has been suggested that the regulation of mitochondrial dynamics and function is essential for normal adipogenic differentiation of MSCs (22). Our studies, which were consistent with other work, demonstrated that mitochondrial amount was increased in BMSCs during adipogenic differentiation (7). Furthermore, Bcl2l13 knockdown caused a decrease in the amount of mitochondria in 3T3-L1 and eMSCs, implying an important role for Bcl2l13 in mitochondrial biogenesis. Relative to mitochondrial dynamics, two genes, Mfn2 and Drp1, are essential for mitochondrial turnover, the former for fusion (23, 24) and the latter for fission (25). Forni et al. (26) reported that Mfn2 was up-regulated during the early stages of adipogenesis, and knockdown resulted in a loss of adipogenic differentiation. Our study also showed an increase of MFN2 protein in BMSCs and 3T3-L1 cells during adipogenesis but not during osteogenesis. Silencing of Bcl2l13 led to a significant decrease of MFN2 and a trend for decreased DRP1 in 3T3-L1 cells reflecting not only a decrease in mitochondrial mass but also a change in mitochondrial dynamics during adipocyte differentiation.
A previous study reported that oxidative phosphorylation is the predominant mechanism for ATP generation during adipocyte differentiation (7). We also previously reported that differentiated 3T3-L1 adipocytes met ATP demand primarily by oxidative phosphorylation (4). The present study demonstrated that Bcl2l13 knockdown caused a marked reduction in oxidative phosphorylation and a significant increase of ATP generation from glycolysis in fully differentiated 3T3-L1 cells. In addition, glycolysis was also markedly enhanced in the knockdown nondifferentiated cells. This higher glycolytic activity during early and later stages of adipogenic differentiation in 3T3-L1 with Bcl2l13 knockdown implies a significant compensation of ATP production for the reduction in oxidative phosphorylation. These data also reflect the importance of metabolic flexibility during lineage determination. In addition, this shift toward glycolytic energy generation could be partially responsible for impairment in adipocyte differentiation observed with knockdown of Bcl2l13.
To investigate the mechanisms regulating adipogenesis by Bcl2l13, we considered the association of Bcl2l13 with mitophagy and apoptosis. Mitophagy is the specific and selective system via which excess or damaged mitochondria can be eliminated by autophagy (27), and is responsible for basal mitochondrial turnover or removal of damaged mitochondria as a stress-response mechanism. In addition to Bcl2l13, several mitochondrial mitophagy receptors including B-cell lymphoma 2 19-kDa interacting protein 3 (Bnip3) and NIP3-like protein X (Nix) are also known to connect with LC3-II on the autophagosome structure (28). In addition, PTEN-induced putative kinase protein 1 (Pink1) and Parkin are also associated with mitophagy (29). The present investigation showed that Bcl2l13 knockdown significantly increased the mitophagy of eMSCs prior to differentiation, which might imply that Bcl2l13 represses mitochondrial autophagic flux for mitochondrial biogenesis during adipogenesis. Our results are in contrast to the findings of Murakawa et al. (6) using HEK293 expressing mKeima, a fluorescent mitochondrial protein resistant to lysosomal proteases, possibly because of differences in cell types. Although Bcl2l13 knockdown did not show significant changes in the expression of the other genes associated with mitophagy except Prkn2, the increase of Bnip3 during adipogenesis was still maintained with Bcl2l13 knockdown.
Endogenous Bcl2l13 has been reported to be involved in the mitochondrial uncoupler carbonyl cyanide m-chlorophenylhydrazone–induced mitophagy (6). Our results showed that mitophagy was significantly decreased in the iron chelator DFP-treated Bcl2l13-knockdown eMSCs. It was previously reported that loss of iron triggers Pink1/Parkin-independent mitophagy (30). This suggests the involvement of Bcl2l13 in DFP-induced mitophagy. Further studies are needed to better-characterize the association of Bcl2l13 function and mitophagy during adipogenesis.
It has been reported that preadipocytes undergo apoptosis, whereas mature adipocytes are not susceptible to apoptosis during adipogenesis (31), and Bcl2 was associated with the maturation of those preadipose cells (32, 33). BCL-2 family proteins govern mitochondrial outer membrane permeabilization and regulate apoptosis. As a member of the BCL-2 family, BCL2L13 protein has a single transmembrane domain and four conserved BCL2 homology domains. However, there have been conflicting reports about the effects of Bcl2l13 on apoptosis, proapoptotic (5, 34, 35) or antiapoptotic (36). Previously, osteoblasts from C3H mice were shown to be less apoptotic (50% fewer) than those of osteoblasts from B6 mice both in vivo and in vitro (37), which might in fact be due to higher expression of Bcl2l13 in C3H mice.
We demonstrated Blc2l13's antiapoptotic effect on preadipocytes by analyzing the cell population of Bcl2l13 knockdown cells and confirmed it by annexin V and PI staining flow cytometry in adipogenic 3T3-L1 cells. Although these data might also imply the possibility of an effect of siRNA-induced growth arrest on the number of knockdown cells, the results still support the tenet that Bcl2l13 has an important role in regulating apoptosis during adipocyte differentiation.
ROS production is increased during adipogenesis (38). Recently, it has been reported that the ROS generation is not merely a result of differentiation but a causal factor in promoting adipocyte differentiation in MSCs (39). Our analysis of ROS production in Bcl2l13 knockdown cells revealed that ROS production was indeed required in adipogenesis and that Bcl2l13 does not directly impact ROS production.
There are several caveats and limitations to our study. First, analysis of Mitophagy using mito-QC eMSCs was not performed in adipogenic culture due to the low expression of mCherry and GFP in adipocyte-differentiated eMSCs. Second, the effect of Bcl2l13 overexpression on adipogenesis and the regulation of Bcl2l13 expression have not been explored. Third, further investigations will be needed to determine the physiological role of Bcl2l13 in vivo on adipose tissue development; we are currently phenotyping mice with a genetic deletion of Bcl2l13.
In sum, we found that the mitochondrial mitophagy receptor Bcl2l13 is necessary for adipocyte differentiation. Although the precise role and regulation of Bcl2l13 still need to be ascertained, Bcl2l13 is critical for adapting to adipogenesis by regulating mitophagy and apoptosis during the increase in oxidative phosphorylation activity that accompanies differentiation (Fig. 8). These data imply that metabolic programming via mitochondrial respiration may influence lineage cell fate in the marrow.
Figure 8.
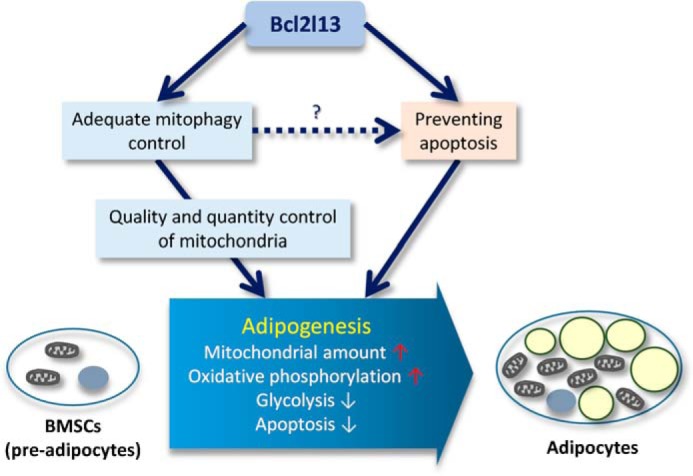
The role of Bcl2l13 on adipogenesis. Mitochondrial mitophagy receptor Bcl2l13 is essential for adapting to adipogenesis, including increase of oxidative phosphorylation activity via regulating apoptosis and mitophagy.
Experimental procedures
Animals
C3H/HeJ and C57BL/6J mice were obtained from the Jackson Laboratory (Bar Harbor, ME). Mito-QC mouse were initially obtained from Dr. Ian Ganley (University of Dundee) and rederived in the Maine Medical Center Research Institute mouse facility. At 8 weeks of age, male mice were euthanized for harvesting primary cells using CO2 followed by cervical dislocation. The Institutional Animal Care and Use Committee at the Maine Medical Center Research Institute approved all experimental procedures.
Primary cell isolation
BMSCs were isolated from dissected femurs and tibiae of mice. The bone marrow contents were spun out from the bones with small cuts at both ends by short centrifuging and resuspended in culture medium consisting of minimum essential medium-α (MEMα) (Gibco), 10% (v/v) fetal bovine serum (FBS), 100 units/ml penicillin, 100 μg/ml streptomycin (Gibco) in a canted neck culture flask. Cultures were maintained at 37 °C with 5% CO2 in a humidified incubator, and 48 h after the isolation, BMSCs were plated in 6- or 12-well plates.
Primary eMSCs were isolated from the outer ears of mice. The samples were finely chopped in PBS containing 2 mg/ml collagenase I (Worthington) and incubated for 1 h at 37 °C on a shaker. After being passed through a 70-μm cell strainer, cells were resuspended in DMEM/nutrient mixture F-12 (DMEM/F-12) (Gibco) and centrifuged. The pellets were resuspended in Red Blood Cell Lysis Buffer (Sigma-Aldrich) and incubated for 1 min, followed by the addition of DMEM/F-12 to quench it. Samples were centrifuged, resuspended in cell culture medium composed of DMEM/F-12 supplemented with 15% (v/v) FBS and 100 μg/ml Primocin (Invivogen), and plated on a 6-well plate. Once they reached 40–50% confluence, cells were plated in 6- or 12-well plates.
Cell culture
Isolated primary cells from mice were cultured in vitro to evaluate adipogenesis and osteogenesis
BMSCs adipogenesis
Adipocyte base medium was composed of DMEM high glucose with 10% (v/v) FBS, 100 units/ml penicillin, 100 μg/ml streptomycin, and 2 μm insulin (Sigma-Aldrich). Once BMSCs were confluent, the medium was switched to the adipocyte differentiation medium consisting of adipocyte base medium, 500 μm isobutylmethylxanthine (IBMX) (Sigma-Aldrich), 1 μm dexamethasone (Sigma-Aldrich), and 20 μm rosiglitazone (Cayman Chemical), and changed after 48 h. Medium was switched to base medium with 20 μm rosiglitazone on day 5 and replaced with base medium on day 7.
eMSC adipogenesis
DMEM/F-12 with 5% (v/v) FBS and 100 μg/ml Primocin was used as adipocyte base medium. When cells reached 100% confluence, they were cultured an extra day and switched to adipocyte base medium with 500 μm IBMX, 1 μm dexamethasone, and 10 μm insulin, and the same medium was changed at day 2. At day 5, medium was changed to the adipocyte base medium containing 5.7 μm rosiglitazone and 0.1 μm insulin.
Osteogenesis of BMSCs and eMSCs
Osteoblast differentiation medium, composed of MEMα containing 8 mm β-glycerol phosphate (Sigma-Aldrich) and 200 μm ascorbic acid (Sigma-Aldrich), was switched when the cells became confluent. The medium was changed every other day.
3T3-L1 cells were purchased from ATCC (Manassas, VA) and grown in culture medium consisting of DMEM high glucose, 10% (v/v) FBS, 100 units/ml penicillin, and 100 μg/ml streptomycin. On day 0 of adipogenesis, the medium was switched to adipocyte differentiation base medium composed of culture medium supplemented with 1 μm insulin, 1 μm rosiglitazone, 500 μm IBMX, and 1 μm dexamethasone. The medium was changed on day 2 and switched to the base medium with 1 μm insulin and 1 μm rosiglitazone on day 4.
Real-time quantitative PCR assay
Total RNA was extracted using TRI Reagent (MRC) according to the manufacturer's instructions. After treatment with recombinant DNase I (Roche), cDNA was constructed with 500 ng of RNA as a template by the High-Capacity cDNA Reverse Transcription Kit (Thermo Fisher Scientific) according to the manufacturer's protocol. To quantify RNA expression, all real-time PCR experiments were performed on a Bio-Rad CFX384 Real-Time System C1000 Thermal Cycler using the iQ SYBR Green Supermix Kit (Bio-Rad) according to the manufacturer's instructions. cDNA samples were analyzed for the expression of both genes of interest and a reference gene, β-actin (Actb). -Fold inductions in gene expression levels were estimated using the ΔΔCt method. Primers for Pparg, Cebpa, Adipoq, Actb, Alpl, Runx2, Sp7, Bglap, Fabp4, and Dlk1 were purchased from Primerdesign Ltd. (Chandler's Ford, UK). Primers for Bcl2l13 were designed using Primer3Plus (http://primer3plus.com/),4 (41) and primers for Bnip3, Bnip31, Pink1, and Prkn2 were obtained through the Harvard Primer Bank, whose sequences and expected sizes of the PCR products are listed in Table S1.
Cell staining
Oil Red O staining was performed as follows. Cells were fixed by using 10% neutral buffered formalin for 1 h, washed with 60% isopropyl alcohol, and stained with a filtered 3.5 mg/ml solution of Oil Red O (Sigma-Aldrich) in 60% isopropyl alcohol for 15 min. After washing twice with water, Oil Red O concentration was quantified by elution with isopropyl alcohol and an optical density measurement at 490 nm. Thereafter, cells were washed with water and stained with 0.4% crystal violet (CV) (Sigma-Aldrich) for 10 min. CV eluted with 10% acetic acid was quantified by an optical density measurement at 650 nm.
An alkaline phosphatase staining kit (Sigma-Aldrich) was used for alkaline phosphatase and von Kossa staining according to the manufacturer's instructions. Briefly, cells were fixed in 4% paraformaldehyde for 12 min at room temperature, washed three times with PBS, and stained with AP solution mixed with 0.5 ml of sodium nitrite solution, 0.5 ml of FRV-alkaline solution, 22.5 ml of H2O, and 0.5 ml of naphthol AS-BI alkaline solution, respectively, for 30 min in a dark place. Thereafter, for von Kossa stain, cells were washed three times with water followed by staining with 5% silver nitrate solution. After exposure to strong light for 1 h, cells were rinsed with deionized water, and residual silver nitrate was neutralized with 5% sodium thiosulfate solution.
Western blotting
Proteins from cell culture were extracted by scraping the culture wells in presence of radioimmune precipitation assay buffer (Cell Signaling Technology). After centrifugation, protein quantity in the supernatant was measured using the Pierce BCA protein assay kit (Thermo Scientific) according to the manufacturer's guidelines. 10 μg of each sample was loaded on 4–15% Mini-PROTEAN TGX precast gels (Bio-Rad), run at 100–200 V for 30–45 min, and transferred to polyvinylidene fluoride membrane using the Trans-blot Turbo Transfer System (Bio-Rad) at 25 V for 7 min. The membrane was blocked in TBS plus 0.1% Tween 20 containing 5% nonfat dry milk for 1 h at room temperature, followed by incubating with primary antibody in blocking medium at 4 °C overnight: BCL2L13 polyclonal antibody (Proteintech, 16612-1-AP, 1:1000), MFN2 (Cell Signaling Technology, USA, catalog no. 9482, 1:1000), DRP1 (D6C7) (Cell Signaling Technology, catalog no. 8570, 1:1000), phospho-DRP1 (Ser-616) (Cell Signaling Technology, catalog no. 3455, 1:500), phospho-DRP1 (Ser-637) (Cell Signaling Technology, catalog no. 4867, 1:1000), β-actin (Santa Cruz Biotechnology, Inc., sc-47778, 1:2000), or cyclophilin A (Cell Signaling Technology, 2175S, 1:1000). The membrane was incubated in blocking media with secondary antibody: anti-rabbit IgG (NA934V) or anti-mouse IgG (NA931V) horseradish peroxidase–conjugated antibodies purchased from GE Healthcare. Western blots were developed using the SuperSignal West Dura Extended Duration Substrate (Thermo Fisher Scientific) for 1 min and exposed with the ChemiDoc Touch imaging system (Bio-Rad). The intensities of the bands were quantified using the ImageJ software (National Institutes of Health).
Mitochondria DNA quantification analysis
Total genomic and mitochondrial DNA was extracted using the QIAamp DNA Mini Kit (Qiagen) according to the manufacturer's instructions. The template concentration of DNA was adjusted to 10 ng/μl. Referring to the report of Malik et al. (40), mitochondrial DNA content was assessed by absolute quantification using real-time PCR as described above. Primers for mouse mitochondrial DNA (mMitoF and mMitoR) and mouse β2-microglobulin (mB2MF and mB2MR) were used to amplify the respective products from mouse genomic DNA (Table S2).
Knockdown of Bcl2l13
Silencer Select Bcl2l13 siRNAs against Bcl2l13 (Life Technologies, Inc., s96920) was transfected into 3T3-L1 cells and eMSCs by using Lipofectamine RNAiMAX reagent (Invitrogen) according to the manufacturer's instructions. Select Negative Control No. 1 siRNA (Life Technologies, catalog no. 4390843) was used as scramble siRNA. Briefly, the day before transfection, cells were plated on a 12-well plate to be 60–80% confluent at transfection (3T3-L1 cells, 3 × 10⁴/well; eMSCs, 2 × 10⁴/well). The next day, transfection reagents containing siRNA (10 or 30 pmol for 3T3-L1 cells or eMSCs, respectively) and 1:3 of Lipofectamine RNAiMAX in a final volume of 100 μl with FBS-free medium were added to each well. The cells were incubated for 24 h prior to the differentiation assay. During the differentiation culture, DFP (Sigma, catalog no. 379409) were used as needed.
Apoptosis analysis
Apoptosis during adipogenesis was analyzed using the FITC annexin V/Dead Cell Apoptosis Kit with FITC annexin V and PI for flow cytometry (Invitrogen) according to the manufacturer's protocol. Briefly, after washed with cold PBS, cells were resuspended to the concentration of 5 × 10⁵ cells/ml with 1× annexin-binding buffer, incubated with FITC annexin V and propidium iodide at room temperature for 15 min, and immediately analyzed by flow cytometry by MACSQuant analyzer (Miltenyi Biotec). Camptothecin (Sigma-Aldrich), a topoisomerase inhibitor, was used for a positive control for apoptosis.
Mitochondrial respiratory function analysis
OCR and ECAR were determined by using the XF Cell Mito Stress Test Kit with a Seahorse XFe96 analyzer (Agilent Technologies). As for adipogenic differentiation, 3T3-L1 cells were seeded in a 96-well Seahorse XF cell culture microplate 1 day after siRNA transfection at a density of 1 × 10³ cells/well and started adipogenesis. Meanwhile, 3T3-L1 cells with nondifferentiation culture were seeded in the plate 5 days after transfection at a density of 5 × 10³ cells/well. On day 6 of transfection, OCR and ECAR were measured on a Seahorse XFe96 analyzer as described by the manufacturer. Briefly, medium was changed to Seahorse XF Base Medium Minimal DMEM without phenol red with 1 mm pyruvate, 2 mm glutamine, and 10 mm glucose, pH 7.4, and the cells were equilibrated for 1 h at 37 °C in a CO2-free incubator. After measurements of the basal rate, the responses were evaluated toward the application of oligomycin (1.25 μm final concentration), FCCP (1 μm), and a combination of antimycin (0.5 μm) and rotenone (0.5 μm). In addition, the Seahorse XFp Glycolytic Rate Assay Kit (Agilent Technologies) was used to assess accurate measurements of glycolytic rates. Cells were changed over to Seahorse XF DMEM, pH 7.4, with no phenol red or sodium bicarbonate containing 5 mm HEPES, 1 mm pyruvate, 2 mm glutamine, and 10 mm glucose for 1 h at 37 °C in a CO2-free incubator. Prior to the start of the assay, medium was changed again according to the manufacturer's instructions. After establishing a baseline, 0.5 μm rotenone and antimycin A and 50 mm 2-deoxyglucose were sequentially added, and the responses were measured. OCR, ECAR, and glycolytic proton efflux rate and ATP production rates were calculated by the Seahorse XFe96 software, Wave version 2.6.
Quantitative analysis of mitophagy
eMSCs from mito-QC mice were cultured in maintenance medium for 5 days, and positive control cells of mitophagy were followed by the addition of 1 mm deferiprone (Sigma, catalog no. 379409) for the last 24 h. Cells were fixed by 4% paraformaldehyde, mounted with VECTASHIELD Mounting Medium with DAPI (Vector Laboratories), and viewed with a Leica SP8 confocal microscope (Leica, Germany) equipped with an oil objective (×63). Images were processed and analyzed using ImageJ software.
ROS analysis
The CellROX Deep Red Flow Cytometry Assay Kit (Life Technologies) was used for analysis of the ROS production. After 6 days of culture in adipogenic or maintain medium, cells (1 × 10⁵ cells/ml) were incubated with 750 nm CellROX Deep Red for 60 min. During the final 15 min of staining, SYTOX Blue Dead Cell stain solution was added to 1 μm concentration. The stained cells were immediately analyzed by flow cytometry, carried out on a MACSQuant analyzer. CellROX-positive and SYTOX-negative cells were recognized as living ROS-positive cells. tert-Butyl hydroperoxide (oxidative stress inducer) and N-acetylcysteine (increasing the antioxidant capability) were used for positive and negative control of ROS production, respectively.
Statistical analysis
Using Prism version 6 statistical software (GraphPad Software, Inc.), samples were tested for normal distribution using the D'Agostino and Pearson omnibus normality test. Statistical significance was calculated with unpaired t test or one-way analysis of variance with the Tukey–Kramer post hoc test for equally distributed samples, and the Mann–Whitney test or Kruskal–Wallis test was performed for nonequally distributed samples. All experiments were carried out in triplicate and repeated at least three times. All data are presented as mean ± S.E. p value < 0.05 was considered as significant.
Author contributions
M. F., C. J. R., and A. R. G. conceptualization; M. F., P. T. L., V. E. D., K. A. B., and A. R. G. formal analysis; M. F., P. T. L., K. A. B., C. J. R., and A. R. G. validation; M. F., L. T., P. T. L., V. E. D., and A. R. G. investigation; M. F., V. E. D., C. J. R., and A. R. G. methodology; M. F. writing-original draft; M. F., C. J. R., and A. R. G. project administration; V. E. D., C. J. R., and A. R. G. supervision; K. A. B. data curation; C. J. R. and A. R. G. funding acquisition; C. J. R. and A. R. G. writing-review and editing; A. R. G. resources.
Supplementary Material
Acknowledgments
We thank Dr. Giselse Pachon for giving advice for the data of flow cytometry analysis. We also acknowledge Dr. Ian Ganley (University of Dundee) for providing mito-QC mice and advice. We also gratefully acknowledge the members of our laboratory and institute for their work.
This work was supported by NIGMS, National Institutes of Health (NIH), Grants U54GM115516-02, 1P20GM121301, and P30GM106391; NIDDK, NIH, Grant R24 DK092759-06; NIAMS, NIH, Grant R03 AR068095; and start-up research funds from the Maine Medical Center Research Institute (to G. A. R.). The authors declare that they have no conflicts of interest with the contents of this article. The content is solely the responsibility of the authors and does not necessarily represent the official views of the National Institutes of Health.
This article contains Tables S1 and S2 and Figs. S1–S4.
S. Bornstein, M. Fujiwara, A.R. Guntur, V.E. DeMambro, and C.J. Rosen, manuscript in preparation.
Please note that the JBC is not responsible for the long-term archiving and maintenance of this site or any other third party hosted site.
- BMSC
- bone marrow stromal cell
- Bcl2l13
- Bcl-2–like protein 13
- PPARγ
- peroxisome proliferator-activated receptor γ
- eMSC
- ear mesenchymal stem cell
- MFN2
- mitofusin-2
- C3H
- C3H/HeJ
- B6
- C57BL/6J
- OCR
- oxygen consumption rate
- ECAR
- extracellular acidification rate
- DFP
- deferiprone
- PI
- propidium iodide
- ROS
- reactive oxygen species
- MEMα
- minimum essential medium-α
- FBS
- fetal bovine serum
- DMEM
- Dulbecco's modified Eagle's medium
- IBMX
- isobutylmethylxanthine
- CV
- crystal violet.
References
- 1. Veldhuis-Vlug A. G., and Rosen C. J. (2018) Clinical implications of bone marrow adiposity. J. Intern. Med. 283, 121–139 10.1111/joim.12718 [DOI] [PMC free article] [PubMed] [Google Scholar]
- 2. Scheller E. L., Doucette C. R., Learman B. S., Cawthorn W. P., Khandaker S., Schell B., Wu B., Ding S. Y., Bredella M. A., Fazeli P. K., Khoury B., Jepsen K. J., Pilch P. F., Klibanski A., Rosen C. J., and MacDougald O. A. (2015) Region-specific variation in the properties of skeletal adipocytes reveals regulated and constitutive marrow adipose tissues. Nat. Commun. 6, 7808 10.1038/ncomms8808 [DOI] [PMC free article] [PubMed] [Google Scholar]
- 3. Guntur A. R., Le P. T., Farber C. R., and Rosen C. J. (2014) Bioenergetics during calvarial osteoblast differentiation reflect strain differences in bone mass. Endocrinology 155, 1589–1595 10.1210/en.2013-1974 [DOI] [PMC free article] [PubMed] [Google Scholar]
- 4. Guntur A. R., Gerencser A. A., Le P. T., DeMambro V. E., Bornstein S. A., Mookerjee S. A., Maridas D. E., Clemmons D. E., Brand M. D., and Rosen C. J. (2018) Osteoblast-like MC3T3-E1 cells prefer glycolysis for ATP production but adipocyte-like 3T3-L1 cells prefer oxidative phosphorylation. J. Bone Miner. Res. 33, 1052–1065 10.1002/jbmr.3390 [DOI] [PMC free article] [PubMed] [Google Scholar]
- 5. Kataoka T., Holler N., Micheau O., Martinon F., Tinel A., Hofmann K., and Tschopp J. (2001) Bcl-rambo, a novel Bcl-2 homologue that induces apoptosis via its unique C-terminal extension. J. Biol. Chem. 276, 19548–19554 10.1074/jbc.M010520200 [DOI] [PubMed] [Google Scholar]
- 6. Murakawa T., Yamaguchi O., Hashimoto A., Hikoso S., Takeda T., Oka T., Yasui H., Ueda H., Akazawa Y., Nakayama H., Taneike M., Misaka T., Omiya S., Shah A. M., Yamamoto A., Nishida K., Ohsumi Y., Okamoto K., Sakata Y., and Otsu K. (2015) Bcl-2-like protein 13 is a mammalian Atg32 homologue that mediates mitophagy and mitochondrial fragmentation. Nat. Commun. 6, 7527 10.1038/ncomms8527 [DOI] [PMC free article] [PubMed] [Google Scholar]
- 7. Zhang Y., Marsboom G., Toth P. T., and Rehman J. (2013) Mitochondrial respiration regulates adipogenic differentiation of human mesenchymal stem cells. PLoS One 8, e77077 10.1371/journal.pone.0077077 [DOI] [PMC free article] [PubMed] [Google Scholar]
- 8. Giroud M., Pisani D. F., Karbiener M., Barquissau V., Ghandour R. A., Tews D., Fischer-Posovszky P., Chambard J. C., Knippschild U., Niemi T., Taittonen M., Nuutila P., Wabitsch M., Herzig S., Virtanen K. A., et al. (2016) miR-125b affects mitochondrial biogenesis and impairs brite adipocyte formation and function. Mol. Metab. 5, 615–625 10.1016/j.molmet.2016.06.005 [DOI] [PMC free article] [PubMed] [Google Scholar]
- 9. Altshuler-Keylin S., and Kajimura S. (2017) Mitochondrial homeostasis in adipose tissue remodeling. Sci. Signal. 10, eaai9248 10.1126/scisignal.aai9248 [DOI] [PMC free article] [PubMed] [Google Scholar]
- 10. Ju L., Chen S., Alimujiang M., Bai N., Yan H., Fang Q., Han J., Ma X., Yang Y., and Jia W. (2018) A novel role for Bcl2l13 in promoting beige adipocyte biogenesis. Biochem. Biophys. Res. Commun. 506, 485–491 10.1016/j.bbrc.2018.10.034 [DOI] [PubMed] [Google Scholar]
- 11. Gawronska-Kozak B., Manuel J. A., and Prpic V. (2007) Ear mesenchymal stem cells (EMSC) can differentiate into spontaneously contracting muscle cells. J. Cell. Biochem. 102, 122–135 10.1002/jcb.21286 [DOI] [PubMed] [Google Scholar]
- 12. Ackert-Bicknell C. L., Salisbury J. L., Horowitz M., DeMambro V. E., Horton L. G., Shultz K. L., Lecka-Czernik B., and Rosen C. J. (2007) A chromosomal inversion within a quantitative trait locus has a major effect on adipogenesis and osteoblastogenesis. Ann. N.Y. Acad. Sci. 1116, 291–305 10.1196/annals.1402.010 [DOI] [PubMed] [Google Scholar]
- 13. McWilliams T. G., Prescott A. R., Allen G. F., Tamjar J., Munson M. J., Thomson C., Muqit M. M., and Ganley I. G. (2016) mito-QC illuminates mitophagy and mitochondrial architecture in vivo. J. Cell Biol. 214, 333–345 10.1083/jcb.201603039 [DOI] [PMC free article] [PubMed] [Google Scholar]
- 14. Akeson E. C., Donahue L. R., Beamer W. G., Shultz K. L., Ackert-Bicknell C., Rosen C. J., Corrigan J., and Davisson M. T. (2006) Chromosomal inversion discovered in C3H/HeJ mice. Genomics 87, 311–313 10.1016/j.ygeno.2005.09.022 [DOI] [PubMed] [Google Scholar]
- 15. Rosen C. J., Ackert-Bicknell C. L., Adamo M. L., Shultz K. L., Rubin J., Donahue L. R., Horton L. G., Delahunty K. M., Beamer W. G., Sipos J., Clemmons D., Nelson T., Bouxsein M. L., and Horowitz M. (2004) Congenic mice with low serum IGF-I have increased body fat, reduced bone mineral density, and an altered osteoblast differentiation program. Bone 35, 1046–1058 10.1016/j.bone.2004.07.008 [DOI] [PubMed] [Google Scholar]
- 16. Bonnet N., Somm E., and Rosen C. J. (2014) Diet and gene interactions influence the skeletal response to polyunsaturated fatty acids. Bone 68, 100–107 10.1016/j.bone.2014.07.024 [DOI] [PMC free article] [PubMed] [Google Scholar]
- 17. Spiegelman B. M., Frank M., and Green H. (1983) Molecular cloning of mRNA from 3T3 adipocytes: regulation of mRNA content for glycerophosphate dehydrogenase and other differentiation-dependent proteins during adipocyte development. J. Biol. Chem. 258, 10083–10089 [PubMed] [Google Scholar]
- 18. Shen W. J., Sridhar K., Bernlohr D. A., and Kraemer F. B. (1999) Interaction of rat hormone-sensitive lipase with adipocyte lipid-binding protein. Proc. Natl. Acad. Sci. U.S.A. 96, 5528–5532 10.1073/pnas.96.10.5528 [DOI] [PMC free article] [PubMed] [Google Scholar]
- 19. Smith A. J., Sanders M. A., Juhlmann B. E., Hertzel A. V., and Bernlohr D. A. (2008) Mapping of the hormone-sensitive lipase binding site on the adipocyte fatty acid-binding protein (AFABP): identification of the charge quartet on the AFABP/aP2 helix-turn-helix domain. J. Biol. Chem. 283, 33536–33543 10.1074/jbc.M806732200 [DOI] [PMC free article] [PubMed] [Google Scholar]
- 20. Smas C. M., and Sul H. S. (1993) Pref-1, a protein containing EGF-like repeats, inhibits adipocyte differentiation. Cell 73, 725–734 10.1016/0092-8674(93)90252-L [DOI] [PubMed] [Google Scholar]
- 21. Mitterberger M. C., Lechner S., Mattesich M., Kaiser A., Probst D., Wenger N., Pierer G., and Zwerschke W. (2012) DLK1(PREF1) is a negative regulator of adipogenesis in CD105(+)/CD90(+)/CD34(+)/CD31(−)/FABP4(−) adipose-derived stromal cells from subcutaneous abdominal fat pats of adult women. Stem Cell Res. 9, 35–48 10.1016/j.scr.2012.04.001 [DOI] [PubMed] [Google Scholar]
- 22. Li Q., Gao Z., Chen Y., and Guan M. X. (2017) The role of mitochondria in osteogenic, adipogenic and chondrogenic differentiation of mesenchymal stem cells. Protein Cell 8, 439–445 10.1007/s13238-017-0385-7 [DOI] [PMC free article] [PubMed] [Google Scholar]
- 23. Rojo M., Legros F., Chateau D., and Lombès A. (2002) Membrane topology and mitochondrial targeting of mitofusins, ubiquitous mammalian homologs of the transmembrane GTPase Fzo. J. Cell Sci. 115, 1663–1674 [DOI] [PubMed] [Google Scholar]
- 24. Griffin E. E., Detmer S. A., and Chan D. C. (2006) Molecular mechanism of mitochondrial membrane fusion. Biochim. Biophys. Acta 1763, 482–489 10.1016/j.bbamcr.2006.02.003 [DOI] [PubMed] [Google Scholar]
- 25. Zhu P. P., Patterson A., Stadler J., Seeburg D. P., Sheng M., and Blackstone C. (2004) Intra- and intermolecular domain interactions of the C-terminal GTPase effector domain of the multimeric dynamin-like GTPase Drp1. J. Biol. Chem. 279, 35967–35974 10.1074/jbc.M404105200 [DOI] [PubMed] [Google Scholar]
- 26. Forni M. F., Peloggia J., Trudeau K., Shirihai O., and Kowaltowski A. J. (2016) Murine mesenchymal stem cell commitment to differentiation is regulated by mitochondrial dynamics. Stem Cells 34, 743–755 10.1002/stem.2248 [DOI] [PMC free article] [PubMed] [Google Scholar]
- 27. Lemasters J. J. (2005) Selective mitochondrial autophagy, or mitophagy, as a targeted defense against oxidative stress, mitochondrial dysfunction, and aging. Rejuvenation Res. 8, 3–5 10.1089/rej.2005.8.3 [DOI] [PubMed] [Google Scholar]
- 28. Zhang J., and Ney P. A. (2009) Role of BNIP3 and NIX in cell death, autophagy, and mitophagy. Cell Death Differ. 16, 939–946 10.1038/cdd.2009.16 [DOI] [PMC free article] [PubMed] [Google Scholar]
- 29. Pickrell A. M., and Youle R. J. (2015) The roles of PINK1, parkin, and mitochondrial fidelity in Parkinson's disease. Neuron 85, 257–273 10.1016/j.neuron.2014.12.007 [DOI] [PMC free article] [PubMed] [Google Scholar]
- 30. Allen G. F., Toth R., James J., and Ganley I. G. (2013) Loss of iron triggers PINK1/Parkin-independent mitophagy. EMBO Rep. 14, 1127–1135 10.1038/embor.2013.168 [DOI] [PMC free article] [PubMed] [Google Scholar]
- 31. Sorisky A., Magun R., and Gagnon A. M. (2000) Adipose cell apoptosis: death in the energy depot. Int. J. Obes. Relat. Metab. Disord. 24, S3–S7 10.1038/sj.ijo.0801491 [DOI] [PubMed] [Google Scholar]
- 32. Magnelli L., Cinelli M., Turchetti A., and Chiarugi V. P. (1994) Bcl-2 overexpression abolishes early calcium waving preceding apoptosis in NIH-3T3 murine fibroblasts. Biochem. Biophys. Res. Commun. 204, 84–90 10.1006/bbrc.1994.2429 [DOI] [PubMed] [Google Scholar]
- 33. Patel R., Apostolatos A., Carter G., Ajmo J., Gali M., Cooper D. R., You M., Bisht K. S., and Patel N. A. (2013) Protein kinase C δ (PKCδ) splice variants modulate apoptosis pathway in 3T3L1 cells during adipogenesis: identification of PKCδII inhibitor. J. Biol. Chem. 288, 26834–26846 10.1074/jbc.M113.482638 [DOI] [PMC free article] [PubMed] [Google Scholar]
- 34. Banga S., Gao P., Shen X., Fiscus V., Zong W. X., Chen L., and Luo Z. Q. (2007) Legionella pneumophila inhibits macrophage apoptosis by targeting pro-death members of the Bcl2 protein family. Proc. Natl. Acad. Sci. U.S.A. 104, 5121–5126 10.1073/pnas.0611030104 [DOI] [PMC free article] [PubMed] [Google Scholar]
- 35. Kim J. Y., So K. J., Lee S., and Park J. H. (2012) Bcl-rambo induces apoptosis via interaction with the adenine nucleotide translocator. FEBS Lett. 586, 3142–3149 10.1016/j.febslet.2012.08.015 [DOI] [PubMed] [Google Scholar]
- 36. Jensen S. A., Calvert A. E., Volpert G., Kouri F. M., Hurley L. A., Luciano J. P., Wu Y., Chalastanis A., Futerman A. H., and Stegh A. H. (2014) Bcl2L13 is a ceramide synthase inhibitor in glioblastoma. Proc. Natl. Acad. Sci. U.S.A. 111, 5682–5687 10.1073/pnas.1316700111 [DOI] [PMC free article] [PubMed] [Google Scholar]
- 37. Sheng M. H., Lau K. H., Mohan S., Baylink D. J., and Wergedal J. E. (2006) High osteoblastic activity in C3H/HeJ mice compared to C57BL/6J mice is associated with low apoptosis in C3H/HeJ osteoblasts. Calcif. Tissue Int. 78, 293–301 10.1007/s00223-005-0303-5 [DOI] [PubMed] [Google Scholar]
- 38. Lee H., Lee Y. J., Choi H., Ko E. H., and Kim J. W. (2009) Reactive oxygen species facilitate adipocyte differentiation by accelerating mitotic clonal expansion. J. Biol. Chem. 284, 10601–10609 10.1074/jbc.M808742200 [DOI] [PMC free article] [PubMed] [Google Scholar]
- 39. Tormos K. V., Anso E., Hamanaka R. B., Eisenbart J., Joseph J., Kalyanaraman B., and Chandel N. S. (2011) Mitochondrial complex III ROS regulate adipocyte differentiation. Cell Metab. 14, 537–544 10.1016/j.cmet.2011.08.007 [DOI] [PMC free article] [PubMed] [Google Scholar]
- 40. Malik A. N., Czajka A., and Cunningham P. (2016) Accurate quantification of mouse mitochondrial DNA without co-amplification of nuclear mitochondrial insertion sequences. Mitochondrion 29, 59–64 10.1016/j.mito.2016.05.003 [DOI] [PubMed] [Google Scholar]
- 41. Untergasser A., Cutcutache I., Koressaar T., Ye J., Faircloth B. C., Remm M., and Rozen S. G. (2012) Primer3–new capabilities and interfaces. Nucleic Acids Res. 40, e115 10.1093/nar/gks596 [DOI] [PMC free article] [PubMed] [Google Scholar]
Associated Data
This section collects any data citations, data availability statements, or supplementary materials included in this article.