

Abstract
The concept of a new ultra-high resolution positron emission tomography (PET) brain scanner featuring truly pixelated detectors based on the LabPET II technology is presented. The aim of this study is to predict the performance of the scanner using GATE simulations. The NEMA procedures for human and small animal PET scanners were used, whenever appropriate, to simulate spatial resolution, scatter fraction, count rate performance and the sensitivity of the proposed system compared to state-of-the-art PET scanners that would currently be the preferred choices for brain imaging, namely the HRRT dedicated brain PET scanner and the Biograph Vision wholebody clinical PET scanner. The imaging performance was also assessed using the NEMA-NU4 image quality phantom, a mini hot spot phantom and a 3-D voxelized brain phantom. A reconstructed nearly isotropic spatial resolution of 1.3 mm FWHM is obtained at 10 mm from the center of the field of view. With an energy window of 250–650 keV, the system absolute sensitivity is estimated at 3.4% and its maximum NECR reaches 16.4 kcps at 12 kBq/cc. The simulation results provide evidence of the promising capabilities of the proposed scanner for ultra-high resolution brain imaging.
Keywords: Brain imaging, positron emission tomography, pixel detectors, avalanche photodiode, high resolution
I. Introduction
THE design of positron emission tomography (PET) scanners involves several trade-offs, especially between spatial resolution, sensitivity and count rate capabilities. Spatial resolution remains one major limitation for brain PET imaging to enable the investigation of the underlying metabolic and molecular processes in anatomical structures that can otherwise be clearly delineated only by other imaging modalities, such as X-ray computed tomography (CT) or magnetic resonance imaging (MRI).
Several designs were recently proposed for dedicated brain PET imaging. The NeuroPET/CT, the first dedicated human brain PET/CT scanner developed by Photo Diagnostic Systems [1], was designed to be mobile and flexible. It achieved 3.2 mm spatial resolution, 19.5 kcps NECR and a sensitivity of 7.5 kcps/MBq. The BrainPET prototypes developed by Siemens were designed as inserts into standard clinical MRI scanners for PET/MR simultaneous brain imaging. An image resolution of 3 mm was reported at the center of the field-of-view [2]. Another interesting concept is the Helmet PET [3]–[5], which was designed to improve the sensitivity for human brain imaging using a compact hemisphere and detectors add-on. The Helmet PET has a spatial resolution of 3 mm and can achieve 2.6 times higher sensitivity for the brain region with less than the number of detectors compared to standard whole-body scanners. Several innovative designs were also introduced at a recent workshop [6]. Whereas these recent developments provide several promising capabilities for brain imaging, their spatial resolution remains far from the theoretically achievable limit and even falls short of equalling the resolution of the HRRT scanner, developed some twenty years ago, which achieved 2.5 mm resolution, 230 kcps NECR and 4.3% absolute sensitivity. [7], [8].
In this study, we introduce a dedicated brain PET scanner designed to achieve ultra-high spatial resolution using fully pixelated detectors. The scanner is based on the established LabPET II technology that was previously implemented and validated in a preclinical scanner [9]–[11]. The most salient features of the LabPET II detector technology are its millimetric intrinsic spatial resolution made possible by the high granularity and parallel processing of the avalanche photodiode (APD)-based pixel detectors [12]–[14], and its fully customizable configuration thanks to the modular front-end detectors and electronics [15], [16]. While the proposed ultrahigh resolution (UHR) scanner is designed for imaging the human brain, it will also be suitable for imaging mid-size animals and non-human primates with unprecedented spatial resolution. The aim of this work is to assess the physical and imaging performance of the proposed APD-based UHR scanner using simulations and standardized procedures, which can then be compared to the performance of state-of-the-art brain and whole-body PET scanners currently being used for brain imaging.
II. Materials and methods
A. System description
The basic detection unit of the proposed UHR scanner consists of a 4×8 array of 1.12×1.12×12 mm3 Lu1.9Y0.1SiO5:Ce (LYSO) scintillators coupled one-to-one to a 4×8 monolithic APD array with a 1.2 mm pitch (Fig. 1a). Four of these detectors are assembled on a daughter board in a 2×2 configuration to form a 128-channel front-end detector module (Fig. 1b) [15]. The scanner is based on 1008 of these frontend detector modules arranged in a 56×18 cylindrical configuration, forming 144 rings of 896 pixel detectors per ring, with a diameter of 39 cm and an axial length of 23.5 cm. The highly integrated electronic front-end, based on a dualthreshold time-over-threshold method, enables the signal from every individual pixel detectors to be processed and recorded independently [13]–[16].
Fig. 1.

(a) Exploded view of a single 32-pixel LabPET II detector. (b) Frontend module consisting of 4 detectors in a 2×2 configuration supported by a daugther board.
The simulated performance of the UHR scanner were compared to that of the High-Resolution Research Tomograph (HRRT, CPS Innovations, Knoxville, TN) dedicated to brain PET imaging and to the recent SiPM-based Biograph Vision whole-body PET scanner (Siemens Medical Solutions USA, Inc.). Briefly, the HRRT is made of 8 planar detector heads, consisting each of 72×104 dual-layer 2.1×2.1×(10 + 10) mm3 LSO-LYSO scintillators read out by 140 photomultiplier tubes (PMTs) arranged in a quadrant sharing design [17]. The scanner has an octagonal configuration with an opposing scintillator-to-scintillator distance of 46.9 cm, a transaxial field of view (FOV) of 31.2 cm and an axial length of 25 cm [8], [18]. The Biograph Vision relies on 10×20 arrays of 3.2×3.2×20 mm3 LSO scintillators read out by 128 silicon photomultipliers (SiPM). Eight rings of 38 of those blocks form a 82-cm diameter by 26.3-cm axial length cylindrical scanner with a 70-cm diameter transaxial FOV [19]. Table I summarizes the design characteristics of all three PET scanners considered in this study.
TABLE I.
Design characteristics of PET scanners used for comparison.
| Parameters | UHR | HRRT [17] | Biograph Vision [19] |
|---|---|---|---|
| Scintillator materials | LYSO | LSO/LYSO | LSO |
| Number of scintillators | 129,024 | 119,808 | 60,800 |
| Scintillator size (mm3) | 1.12 × 1.12 × 12 | 2.1 × 2.1 × (10 + 10) | 3.2 × 3.2 × 20 |
| Scintillator array dimension | 4 × 8 | 72 × 104 (× 2 layers) | 10 × 20 |
| Photodetector | APD | PMT | SiPM |
| Scintillator-to-photodetector ratio | 1 : 1 | 7488 : 140 | 200 : 128 |
| Scintillators per ring | 896 | 576 (× 2 layers) | 760 |
| Number of rings | 144 | 104 | 80 |
| Axial length (mm) | 235 | 252 | 263 |
| Ring diameter (mm) | 390 | 469 | 820 |
| Transaxial FOV (mm) | 271 | 312 | 700 |
| Packing fraction (%) | 56 | 71 | 91 |
| Coincidence time window (ns) | 6 | 6 | 4.73 |
| Energy window (keV) | 250–650 | 350–650 | 435–650 |
| Dead time (ns) | 490 | 320 | 320 |
B. Simulation configuration
Simulations were performed using the open-source Geant4 Application for Tomographic Emission (GATE) package v.7.0 [20]. The simulation models of the UHR, the HRRT and the Biograph Vision scanners are shown in Fig. 2. Whenever appropriate, the performance comparison was carried out following the NEMA procedures for human [21] and small animal PET scanners [22]. Simulations were performed using a fluorine-18 (18F) positron source where the radioactive decay, the positron range and the acollinearity were modelled. Contrary to the UHR, where each scintillator is read out by an individual APD, the HRRT and the Biograph Vision are based on block-PMT and block-SiPM geometries, respectively. However, the light sharing model was not readily available in the GATE version used in this study, and thus, was not simulated. The dead time was simulated at the block level using a paralysable model for the HRRT and the Vision, while it was simulated at the pixel level using a non-paralysable model for the UHR. A paralysable dead time of 320 ns, similar to the HRRT [13], was assumed for the Biograph Vision, while an electronic non-paralysable dead time of 490 ns imposed by the analog front-end signal shaping time was modelled for the UHR scanner [8]. The coincidence sorter was set to reject all multiple coincidences in the selected energy window. The noise module from GATE was used to simulate the background detection count rate introduced by the L(Y)SO crystal natural radioactivity, where the energy and the interevent time interval were simulated using a Gaussian law and a Poisson process, respectively, for each event. The coincidence time window, the energy window and the dead time values used in the simulations are also displayed in Table I. The characteristics of each scanner were chosen according to the manufacturer specifications. Moreover, when appropriate, the UHR was also simulated using a narrower energy window to evaluate the contribution of degrading effects, such as scatter and random coincidences, and how it affects image quality. Due to reconstruction software limitations, the HRRT was simulated without depth of interaction (DOI) measurement, with a unique 20 mm long LSO scintillator.
Fig. 2.

GATE models of the UHR (top left), the HRRT (top right) and the Biograph Vision (bottom) scanners, approximately scaled to their relative size.
C. Image reconstruction
Images were reconstructed using the open-source Customizable and Advanced Software for Tomographic Reconstruction (CASToR) platform [23] using the ROOT output [24] provided by GATE. Unless otherwise mentioned, reconstructions were performed using 30 MLEM iterations with 0.4×0.4×1.0 mm3 voxels for the UHR, 0.8×0.8×1.0 mm3 voxels for the HRRT and 1.0×1.0×1.0 mm3 voxels for the Biograph Vision. Multiple ray-tracing with the Siddon projector [25] was used to estimate the solid angle contribution of each event. Unless otherwise stated, no post-smoothing or interpolation were used in the image reconstruction and display.
D. NEMA performance assessment
1). Spatial resolution:
The spatial resolution of a PET camera can be given by
| (1) |
where α is the reconstruction factor, d is the scintillator width, b is the scintillator decoding error factor, s is the positron range and D is the scanner diameter [26]. The d term in Eq. 1 describing the detector geometric resolution can be determined from an analytical model of the detector response [27]. The NEMA-NU4 procedure [22] was adapted to evaluate the spatial resolution by simulating a 5 MBq 18F spherical source of 0.3 mm diameter inserted in a plastic cube of 10 mm extent on all sides. The source was placed at the center of the FOV and then moved radially every 10 mm. A uniform background was added to the data before reconstruction, so that the point source contrast would be lower than 0.1. This was done in order to minimize the bias in the resolution measurement induced by the iterative reconstruction [28]. The full width at half-maximum (FWHM) and full width at tenth-maximum (FWTM) were measured in the radial and tangential directions for each source position after reconstruction. Since the light sharing was not simulated, the crystal decoding error was not considered, and thus, the reconstructed spatial resolution for both HRRT and Biograph Vision will be underestimated. A comparison of the results obtained by our simulations with the manufacturer documentation was performed to observe the impact of the crystal decoding error factor. While the resolutions were comparable for the HRRT, a significant difference was observed for the Biograph Vision. Therefore, reconstructed images of the Biograph Vision were post-smoothed with a Gaussian kernel of 2.44 mm FWHM to match the published resolution of 3.4 mm found at 1 mm from the center of the scanner FOV [19].
2). Count rate performance:
The count rate performance was estimated based on the NEMA-NU2 procedure [21] using a 700-mm long by 200-mm diameter cylindrical phantom with a 3.2-mm diameter line source located at 45 mm from the center of the FOV. Simulations were performed using a 18F positron source having a total activity concentration ranging from 20 MBq to 440 MBq in 60 MBq steps. A minimum of 500,000 counts were recorded for each simulation point. Pixels located further than 8 mm from the edges of the phantom in the sinogram were set to zero for the analysis. The noise equivalent count rate (NECR) was computed for each activity from the true (Rtrue), scatter (Rscatter) and random (Rrandom) coincidence count rates as
| (2) |
The scatter fraction (SF) evaluation was performed using the phantom described above with the line source filled with a 18F source of 0.1 MBq to make the random event rate negligible. The scatter counts were evaluated as the sum of all pixels located 20 mm away from the source and the fractional values of the linear interpolation obtained between the edges of a central 40 mm wide strip. The SF was then computed from the ratio
| (3) |
3). Sensitivity:
The absolute sensitivity and axial sensitivity profile of the scanners were estimated based on the NEMA-NU4 procedure [22], using a 5 MBq 8F positron spherical source of 0.3 mm diameter centered in the FOV and then moved in the axial direction with a 10-mm step. The sensitivity was calculated as
| (4) |
where RB is the background rate for positron decay, A the activity and β the branching ratio. Since a 18F positron source was used in this simulation, the branching ratio value used in Eq. 4 was 0.967.
E. Imaging performance
1). NEMA-NU4 image quality phantom:
The NEMA-NU4 image quality phantom [22] was used to evaluate the imaging performance of the three scanners. The phantom is a 30-mm diameter cylinder consisting of three parts. The first part of the phantom, used to evaluate the partial volume effect (PVE), is a 20-mm long solid cylinder, with five fillable rods, placed at 7 mm from the center, having internal diameters of 1, 2, 3, 4 and 5 mm. The second part of the phantom is a 15-mm long fillable cylinder to evaluate the image uniformity. The third part of the phantom, used to evaluate the spillover ratios, is a 15-mm long fillable cylinder with two cold cylindrical chambers, each 8-mm in diameter and 15-mm in length, filled with water and air, respectively. Simulations were performed using a 18F positron source with a uniform activity concentration of 0.18 MBq/cc as recommended by the procedure, and the images were reconstructed using 30 iterations. The uniformity was measured from a 22.5-mm diameter by 10-mm long cylindrical volume of interest (VOI) drawn at the center of the uniform region. The PVE was measured using cylindrical VOIs around each cylinder with a diameter twice as large as the physical rod diameter for a 10-mm slice. The maximum values in each of these VOIs were measured and divided by the mean value obtained in the uniform region to obtain the recovery coefficient for each rod size. The spill-over ratio in the two cold regions was evaluated using the ratio of the mean value, found using VOIs of 4 mm diameter by 8 mm length, to the mean of the uniform region.
2). Hot Spot phantom:
A Hot Spot phantom was simulated to illustrate the reconstructed spatial resolution of the scanners. The phantom consisted of six sectors with rods of different diameters (1.0, 1.2, 1.6, 2.4, 3.2 and 4.0 mm). The phantom was simulated using a 18F positron source with a uniform activity concentration of 20 kBq/cc in all rods and the same acquisition time for each scanner. After reconstruction, the smallest resolved region was found and documented for each images. In order to quantify the impact of the energy window size on the UHR image quality, the contrast of the smallest resolved region was calculated as
| (5) |
where Io is the object intensity and IB is the background intensity measured using a profile through the points in the resolved region.
3). 3-D Brain phantom:
A voxelized 3-D brain phantom was simulated using the MRI-based Zubal phantom on a 256×256×128 matrix with isotropic voxel dimensions of 1.5 mm [29]. Simulations were performed using 18F activity. Image-based 3D convolution filtering was used during reconstruction to reduce statistical noise: first on the current estimate, prior to the forward projection, and second on the correction terms, prior to the image update [30]. A Gaussian kernel having an isotropic FWHM of 1.0 mm was used for the convolution.
III. Results
A. NEMA performance evaluation
1). Spatial resolution:
Fig. 3 shows the reconstructed image and radial profiles through point sources with an added background for the UHR scanner. Fig. 4 displays the reconstructed radial spatial resolution as a function of the number of iterations for a point source placed at 1 cm from the FOV center of the UHR, the HRRT and the Biograph Vision. Results are found to converge towards stable values for the three scanners above 350 iterations. Therefore, the spatial resolution is reported at 500 iterations. The Biograph Vision reconstructed resolution with and without the post-smoothing accounting for the decoding error factor were also shown in Fig. 4. A difference of 30% is obtained when the crystal decoding error factor is not included compared to the reported resolution [19]. Further results with the Biograph Vision will then be reported with post-smoothing to account for the decoding error factor, as previously stated. Reconstructed spatial resolution results at 1 cm and 10 cm from the center of the FOV are reported in Table II for the three scanners. For a source placed at 1 cm from the center of the FOV, values of 1.32 mm, 2.4 mm and 3.37 mm FWHM are obtained for the UHR, the HRRT and the Biograph Vision, respectively.
Fig. 3.
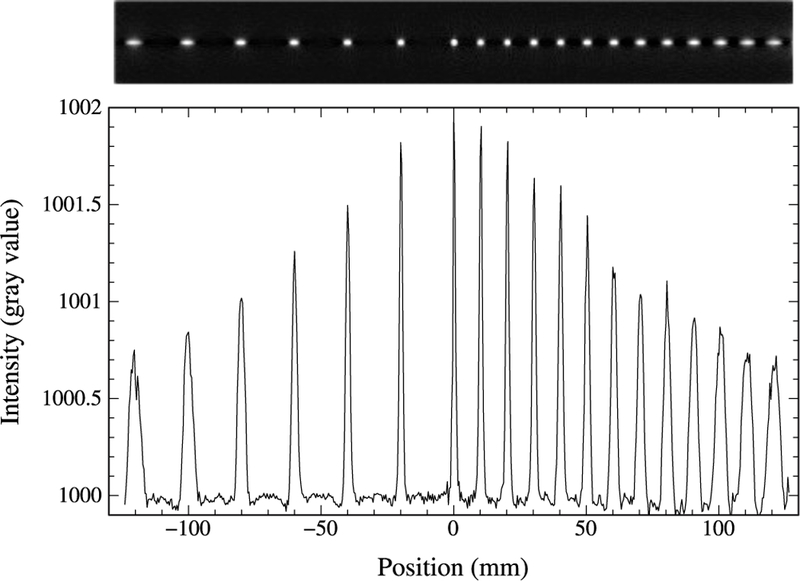
Reconstructed image of point sources with 500 iterations (top) and line profile through the point sources (bottom) at different radial position in the FOV of the UHR scanner.
Fig. 4.

Reconstructed radial spatial resolution as a function of the number of iterations for a source placed at 1 cm from the FOV center. Biograph Vision results are shown with (full line) and without (dashed line) post-smoothing accounting for the decoding error factor.
TABLE II.
Reconstructed spatial resolution in (mm) at 1 cm and 10 cm from the center of the FOV for the UHR, the HRRT and the Biograph Vision.
| 1cm | 10cm | |||
|---|---|---|---|---|
| FWHM | FWTM | FWHM | FWTM | |
| UHR | ||||
| Radial | 1.32 | 2.41 | 3.96 | 7.22 |
| Tangential | 1.43 | 2.62 | 1.76 | 3.21 |
| HRRT1 | ||||
| Radial | 2.40 | 4.38 | 6.84 | 12.47 |
| Tangential | 2.46 | 4.49 | 2.69 | 4.90 |
| Biograph Vision | ||||
| Radial | 3.37 | 6.15 | 3.95 | 7.20 |
| Tangential | 3.83 | 5.96 | 3.91 | 6.12 |
Simulations were performed without considering DOI.
2). Count rate performance:
The count rate capabilities of the UHR scanner is demonstrated in Fig. 5a. A maximum NECR of 16.4 kcps is reached at 12 kBq/cc (260 MBq). The scatter fraction was estimated to 67% for an energy window of [250–650 keV] and 34% for an energy window of [450–650 keV]. The random coincidence rate becomes higher than the true coincidence rate at 1.2 kBq/cc (26 MBq) with the [250–650 keV] window, and at 0.9 kBq/cc (20 MBq) with the narrower [450–650 keV] energy window. Fig. 5b shows the NECR results of the UHR along with the HRRT and the Biograph Vision scanners obtained using the standard energy window (Table I). The maximum NECR of the UHR with the narrower energy window is 3 kcps at 9.1 kBq/cc (200 MBq).
Fig. 5.

(a) Count rates as a function of activity for the UHR scanner [250–650 keV]. (b) Comparison of noise equivalent count rates for the UHR, the HRRT and the Biograph Vision scanners.
3). Sensitivity:
The sensitivity profiles across the axial FOV were simulated for the UHR, the HRRT and the Biograph Vision scanners. Results are compared in Fig. 6. An absolute sensitivity of 3.4% is obtained at the axial center for the UHR scanner with an energy window of [250–650 keV], dropping to 1.0% with the narrower [450–650 keV] window. Its lower sensitivity compared to the HRRT and the Biograph Vision can be explained by the lower packing fraction and the smaller detector size, as shown in Table I.
Fig. 6.

Axial sensitivity profiles for the UHR with energy windows of [250–650 keV] and [450–650 keV] compared to the HRRT and the Biograph Vision scanners with their standard energy windows.
B. Imaging performance
1). NEMA-NU4 image quality phantom:
Table III reports the recovery coefficients, uniformity and spill-over ratios results for the three scanners. The recovery coefficients are also illustrated in Fig. 7.
TABLE III.
Report for uniformity, recovery coefficients and spill-over ratios using the NEMA-NU4 2008 image quality phantom for the UHR, HRRT and Biograph Vision scanners.
| Scanner | UHR | HRRT | Vision | ||
|---|---|---|---|---|---|
| Uniformity | STD (%) | 4.5 | 4.4 | 1.5 | |
| Recovery coefficients | Object (mm) | 1 | 0.21 | 0.06 | 0.04 |
| 2 | 0.56 | 0.42 | 0.18 | ||
| 3 | 0.79 | 0.75 | 0.36 | ||
| 4 | 0.90 | 0.91 | 0.55 | ||
| 5 | 0.94 | 0.97 | 0.66 | ||
| Spill-over | Water | 0.14 | 0.16 | 0.19 | |
| Air | 0.25 | 0.25 | 0.28 | ||
Fig. 7.

Recovery coefficients of the UHR [250–650 keV], the HRRT and The Biograph Vision scanners obtained from image reconstruction of the NEMA-NU4 phantom.
2). Hot Spot phantom:
Fig. 8 shows the Hot Spot resolution phantom simulated for each scanner. The contrast was measured from line profiles, also shown in Fig. 8, on the smallest resolved region for each images using Eq. 5. The 2.4-mm spots can be resolved for the HRRT and Biograph Vision with a contrast of 3.37 and 0.28, respectively, and a contrast of 7.06 and 15.34 for the UHR with energy windows of [250–650 keV] and [450–650 keV], respectively. The 1-mm spots can only be resolved with the UHR, with contrast values of 0.47 and 0.58 for energy windows of [250–650 keV] and [450–650 keV], respectively.
Fig. 8.

Reconstructed images of the Hot Spot resolution phantom, with rod diameters of 1.0, 1.2 mm, 1.6 mm, 2.4 mm, 3.2 mm and 4.0 mm, obtained after 30 iterations and a fixed data acquisition time, for (a) the UHR scanner with the [250–650 keV] energy window (23.5×10⁶ events), (b) the UHR with a narrower energy window [450–650 keV] (6.6×10⁶ events), (c) the HRRT (52.9×10⁶ events) and (d) the Biograph Vision (54.6×10⁶ events). In red, the line profiles used to measured the contrast for each phantom.
3). 3-D Brain phantom:
Fig. 9 shows selected transverse, coronal and sagittal views of the reconstructed human brain phantom. Note that the phantom was digitized using an isotropic voxel dimension of 1.5 mm. No scatter or attenuation corrections were performed. Acquisitions of 420×106, 477×106 and 538×106 events were simulated with the UHR, the HRRT and the Biograph Vision scanners, respectively.
Fig. 9.

Transverse (left), sagittal (middle) and coronal (right) slices through a simulated human brain acquired using the UHR (top), HRRT (middle) and Biograph Vision (bottom) scanners. The maximum of the viewing window was scaled to 4× the mean value of the grey matter.
IV. Discussion
In this paper, we present the concept of a new dedicated brain PET scanner designed to achieve ultra-high spatial resolution, close to the limit imposed by the physical processes of positron emission and annihilation radiation detection. What distinguishes the proposed UHR scanner among all clinical PET devices is its unique detector design using fully pixelated sensors interfaced to highly integrated parallel electronics, which enables independent processing of the signals from each individual scintillator pixel. This uncommon detection front-end, based on the LabPET II detector technology, avoids the inherent inaccuracy of coded system where the scintillator-to-photodetector ratio is larger than 1:1. Simulation results show that the reconstructed spatial resolution achieved at 1 cm from the center of the FOV is a factor of two better than that of the state-of-the-art HRRT brain scanner and a factor of at least 2.5-fold better than the most recent whole-body PET scanners.
The reconstructed image of an ultra-high-resolution Hot Spot phantom illustrates the expected imaging capabilities of the proposed scanner for small structures. While 1 mm rods appear to be resolvable with the UHR scanner, the HRRT and Biograph Vision resolving capability is limited to the 2.4 mm rods.
The reconstructed image of a 3-D human brain phantom shows that structures of the medial temporal lobe known to be involved in the onset of Alzheimer’s disease, such as the entorhinal and trans-entorhinal cortex - never seen as separate entities in PET - can potentially be differentiated. The UHR scanner will be particularly useful to investigate the small deep structures of the brain owing to its millimetric spatial resolution in the center of the FOV. Its performance will likely open new windows into clinical neuroimaging by, for instance, allowing segmentation of the basal ganglia (thalamus, putamen, caudate nucleus, pallidum), which could be helpful in the diagnosis of concussion and many neurodegenerative diseases, using PET radiotracers like [18F]-Florbetapir (β-amyloid deposition), [18F]-AV1451 (tau protein accumulation) or [18F]-DOPA and [11C]-raclopride (dopamine receptors).
Due to the uneven tangential and axial spacing between pixels of the UHR scanner (as well as the HRRT and the Biograph Vision), filtered backprojection (FBP) reconstruction would be affected by significant streak artefacts. Even using gap filling methods and interpolation, FBP reconstruction clearly remains suboptimal. Therefore, only iterative reconstruction was used in this investigation. The CASToR software package was used for MLEM reconstruction, it offers a fast and universal method of reconstruction with GATE data. The projector uses a simple system matrix where the probability is computed from the path length of multiple lines-of-response through voxels, which is appropriate for performance assessment, but may result in some minor artefacts that were occasionally noticed in reconstructed images. The use of a more accurate system matrix accounting for the physical detector responses would avoid these artefacts and would likely improve image quality [31], [32].
With a sensitivity of 3.5% and a maximum NECR of 16.4 kcps, the UHR scanner performance is somewhat lower than the HRRT and whole-body PET systems. The low sensitivity of the UHR scanner results mainly from the lower packing fraction (56%) and from the weak detection efficiency of the tiny individual pixel detectors, which essentially reduces to the photoelectric interaction probability of 511 keV photons in LYSO (∼34%). To compensate for this poor detection efficiency, the lower level of the energy window was reduced to 250 keV in order to capture a larger fraction of the 511 keV photons undergoing a first Compton interaction in the detectors. However, by doing so, the scatter fraction increases and the rate of multiple interactions leading to triple or higher order events increases significantly, also exacerbating the rate of randoms. These detrimental effects can be avoided by raising the lower energy threshold to keep only 511 keV photoelectric events. The outcome can be better contrast, as demonstrated by the comparison of the Hot Spot phantom images obtained with the [250–650 keV] and [450–650 keV] energy windows, if the loss of sensitivity can be tolerated. Multiple events were all rejected in the present investigation, although many such events could, in principle, be recovered in a fully pixelated system using some more sophisticated heuristics [33]–[35]. Thus, simulations of the UHR using a different coincidence sorter to accept multiple coincidences - where the coincidence with the highest energy was considered - demonstrated a potential gain of 12% in absolute sensitivity and an increase by a factor of 2.6 in maximum NECR, from 16 kcps to 42 kcps. It should be pointed out that most multiple interaction events get unnoticed in detector arrays with light-sharing readout, increasing detection efficiency at the expense of positioning accuracy, and there is no means either to uncover the true first interaction position or to reject those events. On the other hand, the massively parallel front-end processing of the UHR scanner provides a significant advantage with respect to dead time, since only the pixel of interaction becomes disabled in a non-paralysable fashion for about 490 ns. In comparison, the entire block (or at least a large part of it) will be disabled every time an interaction occurs in the detector array with all other light- or charge-sharing systems.
Simulations were conducted for the UHR scanner in parallel with two state-of-the-art scanners, the HRRT and the Biograph Vision that can currently be used for brain imaging, to compare the expected performance of the proposed new brain PET scanner. Briefly, for the HRRT, a good agreement was found between our simulated results and reported data from multiple sources for the spatial resolution (2.42–2.53 mm vs 2.4 mm at 1 cm from the center of the FOV [8], [17]) and for the absolute sensitivity (7.4% vs 5.5% to 6.5% [36]). It is worth noting that the absolute sensitivity was simulated with a point source at the center of the axial FOV, while the reported sensitivity was measured with a line source in a cylindrical phantom, where more events would be lost. A NECR of 51 kcps at 7.8 kBq/cc and a SF of 56% was reported in Eriksson et al. [18], while we report a maximum NEC of 56 kcps at 9.1 kBq/cc and a SF of 57%. Reconstructed resolution results obtained with the Biograph Vision scanner were significantly better than the one reported [19]. We believe this difference is due to the lack of decoding error in our simulation. A post-smoothing of the reconstructed images was used to artificially include this factor. This correction was not required for the HRRT since the resolution obtained from our simulations matched those of De Jong et. al [17].
Overall, the fairly good agreement between our simulations and reported experimental HRRT data make us confident that our simulations were close to the reality and that a real UHR system should share properties similar to those predicted by simulation. However, several real world phenomena, such as the dead time at every stage of the data acquisition process, the light sharing or crosstalk in the detector and the limited data throughput to the computer, which were not thoroughly modelled here, may impact the expected performance, of all simulated systems to various extent.
V. Conclusion
A new ultra-high resolution (UHR) PET scanner design featuring small truly pixelated detectors is proposed to reach spatial resolution in the millimeter range for imaging the human brain and mid-size animals with unmatched definition. Based on extensive GATE simulations, the proposed UHR scanner is expected to improve spatial resolution by a factor 2 or more relative to the current state-of-the-art in clinical brain PET imaging. Despite the lower sensitivity and count rate performance, simulations show that significantly better resolved and higher contrast images than currently feasible will be obtained with the UHR scanner in similar scanning times. With these promising resolving capabilities, the UHR brain PET scanner will pave the way to more accurate imaging of potential cerebral biomarkers of neurodegenerative diseases, such as β-amyloid deposition, tau protein accumulation and neuroreceptor distribution.
VI. Acknowledgments
The authors would like to thank Thibaut Merlin for his help with the voxelized source and phantom used in the brain phantom study, Etienne Croteau for usefull discussion and Catherine Pepin for proof-reading of the manuscript.
This work was supported by grants from the Natural Sciences and Engineering Research Council of Canada (NSERC), Mitacs and the MEDTEQ Consortium of the Ministère de l’ économie, dé la science et de l’innovation (MÉSI) of the Government of Québec. The Sherbrooke Molecular Imaging Center is a member of the FRQS-funded Centre de Recherche du CHUS (CRCHUS).
Contributor Information
Émilie Gaudin, Sherbrooke Molecular Imaging Center of CRCHUS and Department of Nuclear Medicine and Radiobiology, Université de Sherbrooke, Sherbrooke, QC, Canada..
Maxime Toussaint, Department of Computer Science, Université de Sherbrooke, Sherbrooke, QC, Canada..
Christian Thibaudeau, IR&T Inc., QC, Canada..
Maxime Paillé, Sherbrooke Molecular Imaging Center of CRCHUS and Department of Nuclear Medicine and Radiobiology, Université de Sherbrooke, Sherbrooke, QC, Canada..
Réjean Fontaine, Interdisciplinary Institute for Technological Innovation - 3IT and Department of Electrical and Computer Engineering, Université de Sherbrooke, Sherbrooke, QC, Canada..
Roger Lecomte, Sherbrooke Molecular Imaging Center of CRCHUS and Department of Nuclear Medicine and Radiobiology, Université de Sherbrooke, Sherbrooke, QC, Canada., IR&T Inc., QC, Canada..
References
- [1].Grogg KS, Toole T, Ouyang J et al. , “National electrical manufacturers association and clinical evaluation of a novel brain PET/CT scanner,” Journal of Nuclear Medicine, vol. 57, no. 4, pp. 646–652, December 2015. [Online]. Available: 10.2967/jnumed.115.159723 [DOI] [PMC free article] [PubMed] [Google Scholar]
- [2].Schlemmer H, Pichler B, and Schmand M, “Simultaneous MR/PET imaging of the human brain: feasibility study,” Radiology, vol. 248, pp. 1028–1035, 2008. [DOI] [PubMed] [Google Scholar]
- [3].Tashima H, Yoshida E, Nishikido F et al. , “Development of the helmetchin PET prototype,” in 2015 IEEE Nuclear Science Symposium and Medical Imaging Conference (NSS/MIC), October 2015, pp. 1–3. [Google Scholar]
- [4].Tashima H and Yamaya T, “Proposed helmet PET geometries with addon detectors for high sensitivity brain imaging,” Physics in Medicine & Biology, vol. 61, no. 19, p. 7205, 2016. [DOI] [PubMed] [Google Scholar]
- [5].Ahmed AM, Tashima H, and Yamaya T, “Investigation of spatial resolution improvement by use of a mouth-insert detector in the helmet PET scanner,” Radiological Physics and Technology, October 2017. [DOI] [PubMed]
- [6].“Workshop on Dedicated Brain Imaging Systems,” IEEE NSS/MIC 2017.
- [7].Schmand M, “Performance results of a new DOI detector block for a high resolution PET - LSO research tomograph HRRT,” IEEE Transactions on Nuclear Science, vol. 45, pp. 3000–3006, 1998. [Google Scholar]
- [8].Wienhard K, Schmand M, Casey ME et al. , “The ECAT HRRT: performance and first clinical application of the new high resolution research tomograph,” IEEE Trans. Nucl. Sci, vol. 49, no. 1, p. 104, 2002. [Google Scholar]
- [9].Gaudin E, Thibaudeau C, Arpin L, Fontaine R, and Lecomte R, “Imaging performance of a submillimetric spatial resolution APD-based preclinical PET scanner dedicated to mouse imaging,” 2017 IEEE NSS/MIC, M08–028, Atlanta, GA, Oct. 21–28 2017. [Google Scholar]
- [10].Gaudin E, Thibaudeau C, Arpin L et al. , “Initial results of a truly pixelated APD-based PET scanner for high-resolution preclinical imaging,” SNMMI 2017 Annual Meeting, Denver, CO, June 10–14, 2017. [Google Scholar]
- [11].Gaudin E, Arpin L, Thibaudeau C et al. , “LabPET II: Initial results of a time-over-threshold APD-based PET scanner,” 2016 IEEE NSS/MIC, M12–1, Strasbourg, France, Oct. 29-Nov. 6, 2016. [Google Scholar]
- [12].Bergeron M, Thibaudeau C, Cadorette J et al. , “LabPET II, an APD-based Detector Module with PET and Counting CT imaging capabilities,” IEEE Transactions on Nuclear Science, vol. 62, no. 3, pp. 756–765, June 2015. [Google Scholar]
- [13].Arpin L, Koua K, Panier S et al. , “Embedded real time digital signal processing unit for a 64-channel PET detector module,” in IEEE NSS/MIC Conference Record, Oct 2011, pp. 1545–1550. [Google Scholar]
- [14].Gaudin E, Arpin L, Bouchard J et al. , “Performance characterization of a dual-threshold time-over-threshold APD-based detector front-end module for PET imaging,” in 2015 IEEE Nuclear Science Symposium and Medical Imaging Conference (NSS/MIC), Oct 2015, pp. 1–3. [Google Scholar]
- [15].Fontaine R, Arpin L, Bouchard J et al. , “The hardware architecture of the LabPET II-mouse, a highly integrated APD-based PET scanner,” 2016 IEEE NSS/MIC, M06–2, Strasbourg, France, Oct. 29-Nov. 6, 2016. [Google Scholar]
- [16].Njejimana L, Arpin L, Thibaudeau C et al. , “Firmware architecture of the data acquisition system for the LabPET II mouse scanner,” in 2016 IEEE Nuclear Science Symposium, Medical Imaging Conference and Room-Temperature Semiconductor Detector Workshop (NSS/MIC/RTSD), Oct 2016, pp. 1–3. [Google Scholar]
- [17].de Jong HWAM, van Velden FHP, Kloet RW et al. , “Performance evaluation of the ECAT HRRT: an LSO-LYSO double layer high resolution, high sensitivity scanner,” Physics in Medicine & Biology, vol. 52, no. 5, p. 1505, 2007. [DOI] [PubMed] [Google Scholar]
- [18].Eriksson L, Wienhard K, Eriksson M et al. , “The ECAT HRRT: NEMA NEC evaluation of the HRRT system, the new high-resolution research tomograph,” IEEE Transactions on Nuclear Science, vol. 49, no. 5, pp. 2085–2088, October 2002. [Google Scholar]
- [19].Biograph Vision System Specifications, MI-3658.KBK.JV, Siemens Healthcare GmbH, 2016. [Google Scholar]
- [20].Jan S, Santin G, Strul D et al. , “GATE: a simulation toolkit for PET and SPECT,” Physics in Medicine and Biology, vol. 49, no. 19, p. 4543, 2004. [DOI] [PMC free article] [PubMed] [Google Scholar]
- [21].“Performance measurements of positron emission tomographs.” NEMA Standards Publication NU2–2001, 2001, Rosslyn, VA. [Google Scholar]
- [22].“Performance measurements of small animal positron emission tomographs.” NEMA Standards Publication NU4–2008, 2008, Rosslyn, VA. [Google Scholar]
- [23].Merlin T, Stute S, Benoit D et al. , “CASToR: a generic data organization and processing code framework for multi-modal and multidimensional tomographic reconstruction,” Physics in Medicine & Biology, vol. 63, no. 18, p. 185005, September 2018. [DOI] [PubMed] [Google Scholar]
- [24].Brun R and Rademakers F, “ROOT — an object oriented data analysis framework,” Nuclear Instruments and Methods in Physics Research Section A: Accelerators, Spectrometers, Detectors and Associated Equipment, vol. 389, no. 1, pp. 81–86, 1997. [Google Scholar]
- [25].Siddon RL, “Fast calculation of the exact radiological path for a threedimensional CT array,” Medical Physics, vol. 12, no. 2, pp. 252–255, March 1985. [DOI] [PubMed] [Google Scholar]
- [26].Moses WW, “Fundamental limits of spatial resolution in PET,” Nuclear Instruments and Methods in Physics Research Section A: Accelerators, Spectrometers, Detectors and Associated Equipment, vol. 648, pp. S236–S240, 2011. [DOI] [PMC free article] [PubMed] [Google Scholar]
- [27].Lecomte R, “Technology challenges in small animal PET imaging,” Nuclear Instruments and Methods in Physics Research Section A: Accelerators, Spectrometers, Detectors and Associated Equipment, vol. 527, no. 1, pp. 157–165, 2004, proceedings of the 2nd International Conference on Imaging Technologies in Biomedical Sciences. [Google Scholar]
- [28].Gong K, Cherry SR, and Qi J, “On the assessment of spatial resolution of PET systems with iterative image reconstruction,” Physics in Medicine and Biology, vol. 61, no. 5, p. N193, 2016. [DOI] [PMC free article] [PubMed] [Google Scholar]
- [29].Zubal IG, Harrell CR, Smith EO et al. , “Computerized three-dimensional segmented human anatomy,” Medical Physics, vol. 21, no. 2, pp. 299–302, February 1994. [Online]. Available: 10.1118/1.597290 [DOI] [PubMed] [Google Scholar]
- [30].Reader AJ, Julyan PJ, Williams H, Hastings DL, and Zweit J, “EM algorithm system modeling by image-space techniques for PET reconstruction,” IEEE Transactions on Nuclear Science, vol. 50, no. 5, pp. 1392–1397, October 2003. [Google Scholar]
- [31].Selivanov VV, Picard Y, Cadorette J, Rodrigue S, and Lecomte R, “Detector response models for statistical iterative image reconstruction in high resolution PET,” IEEE Transactions on Nuclear Science, vol. 47, no. 3, pp. 1168–1175, June 2000. [Google Scholar]
- [32].Leroux JD, Thibaudeau C, Lecomte R, and Fontaine R, “Fast, accurate and versatile Monte Carlo method for computing system matrix,” in 2007 IEEE Nuclear Science Symposium Conference Record, vol. 5, October 2007, pp. 3644–3648. [Google Scholar]
- [33].Rafecas M, Boning G, Pichler BJ¨ et al. , “Inter-crystal scatter in a dual layer, high resolution LSO-APD positron emission tomograph,” Physics in Medicine & Biology, vol. 48, no. 7, p. 821, 2003. [DOI] [PubMed] [Google Scholar]
- [34].Clerk-Lamalice J, Bergeron M, Thibaudeau C, Fontaine R, and Lecomte R, “Evaluation of easily implementable inter-crystal scatter recovery schemes in high-resolution PET imaging,” in 2012 IEEE Nuclear Science Symposium and Medical Imaging Conference Record (NSS/MIC). IEEE, oct 2012. [Google Scholar]
- [35].Michaud JB, Tetrault MA, Beaudoin JF´ et al. , “Sensitivity increase through a neural network method for LOR recovery of ICS triple coincidences in high-resolution pixelated- detectors PET scanners,” IEEE Transactions on Nuclear Science, vol. 62, no. 1, pp. 82–94, February 2015. [Google Scholar]
- [36].Sossi V, de Jong HWAM, Barker WC et al. , “The second generation HRRT - a multi-centre scanner performance investigation,” in IEEE Nuclear Science Symposium Conference Record, 2005, vol. 4, October 2005, pp. 2195–2199. [Google Scholar]