

Abstract
Background/aims
To systematically compare the intermodality and inter-reader agreement for two blue-light confocal fundus autofluorescence (FAF) systems.
Methods
Thirty eyes (21 patients) with a diagnosis of geographic atrophy (GA) were enrolled. Eyes were imaged using two confocal blue-light FAF devices: (1) Spectralis device with a 488 nm excitation wavelength (488-FAF); (2) EIDON device with 450 nm excitation wavelength and the capability for ‘colour’ FAF imaging including both the individual red and green components of the emission spectrum. Furthermore, a third imaging modality (450-RF image) isolating and highlighting the red emission fluorescence component (REFC) was obtained and graded. Each image was graded by two readers to assess inter-reader variability and a single image for each modality was used to assess the intermodality variability.
Results
The 95% coefficient of repeatability (1.35 mm2 for the 488-FAF-based grading, 8.13 mm2 for the 450-FAF-based grading and 1.08 mm2 for the 450-RF-based grading), the coefficient of variation (1.11 for 488-FAF, 2.05 for 450-FAF, 0.92 for 450-RF) and the intraclass correlation coefficient (0.994 for 488-FAF, 0.711 for 450-FAF, 0.997 for 450-RF) indicated that 450-FAF-based and 450-RF-based grading have the lowest and highest inter-reader agreements, respectively. The GA area was larger for 488-FAF images (median (IQR) 2.1 mm2 (0.8–6.4 mm2)) than for 450-FAF images (median (IQR) 1.0 mm2 (0.3–4.3 mm2); p<0.0001). There was no significant difference in lesion area measurement between 488-FAF-based and 450-RF-based grading (median (IQR) 2.6 mm2 (0.8–6.8 mm2); p=1.0).
Conclusion
The isolation of the REFC from the 450-FAF images allowed for a reproducible quantification of GA. This assessment had good comparability with that obtained with 488-FAF images.
Keywords: Autofluorescence, Geographic atrophy, Age-related macular degeneration, Green fluorophores, Optical coherence tomography.
Introduction
Geographic atrophy (GA) is the non-neovascular form of late age-related macular degeneration (AMD).1 GA has an estimated prevalence of 0.8% in the US population 40 years of age and older and is still considered a serious complication of AMD since no approved therapy is currently available.2
In most studies and ongoing clinical trials, the quantification of the GA size has been performed using a confocal scanning laser ophthalmoscope (cSLO) with 488 nm blue-light fundus autofluorescence (488-FAF).3–7 This 488 nm wavelength is thought to primarily excite lipofuscin, which dominates the corresponding long-wave emission range between 560 and 700 nm (red spectrum).8 As loss of the RPE and photoreceptors in GA is associated with loss of lipofuscin, 488-FAF allows areas of GA to be defined as regions of well-demarcated decreased autofluorescence.9–11
The autofluorescence of the retina and RPE, however, can be excited across a broad range of wavelengths. Depending on the wavelength used, the quantity of fluorescence and contributions to the whole autofluorescence signal from different fluorophores might vary.8 12 Recently, a new confocal 450 nm blue-light FAF device (450-FAF) (Eidon; CenterVue, Padua, Italy) has been introduced.13 A different range of fluorophores are thought to be excited at 450 nm compared with 488 nm.8 In addition to the lipofuscin, the 450 nm wavelength may further excite other minor fluorophores, which contribute to the fluorescence intensity in the short-wavelength emission range (510–560 nm, green spectrum).8 Although this additional excitation may allow better characterisation of these minor fluorophores,13 this may have consequences on the reliability of 450-FAF to detect and quantify GA.
In addition, this new confocal light-emitting diode (LED) 450 nm blue-light FAF system offers an important potential advantage in that the full-emission spectrum is detected on a colour sensor, providing so-called ‘colour FAF’ imaging. Therefore, the emission spectrum can be divided into long-wave and short-wave emission components (‘red’ and ‘green’ emission fluorescence component, REFC and GEFC, respectively). As they presumably reflect different fluorophores, the REFC and GEFC may offer different capabilities for evaluating GA lesions.
The aim of this study was to systematically compare the intermodality and inter-reader agreement for 488-FAF and 450-FAF images, as well as 450-red filtered (RF) images, in which the REFC component was enhanced from the 450-FAF images.
Methods
Study participants
This study is a prospective, observational, cross-sectional case series. Patients with a clinical diagnosis of GA1 were enrolled from the medical retina clinics at the Doheny–UCLA Eye Centers. The study was approved by the UCLA Institutional Review Board and adhered to the tenets of the Declaration of Helsinki and Health Insurance Portability and Accountability Act. Written informed consent was obtained from all subjects prior to enrolment in the study.
All patients were enrolled between September 2016 and August 2017 and received a complete ophthalmological examination, which included the measurement of best-corrected visual acuity (BCVA), intraocular pressure and dilated ophthalmoscopy. BCVA measurements were made using a Snellen chart and were converted to the logarithm of the minimum angle of resolution (logMAR), as previously described.14
To be included, patients were required to have evidence of GA due to AMD as determined by the managing physician (SRS) and defined as well-demarcated areas of depigmentation with increased visibility of underlying choroidal vessels on funduscopic examination. Moreover, in patients considered for enrolment, presence of GA was further confirmed by spectral-domain optical coherence tomography (SD-OCT) examination, which revealed the concomitant appearance of RPE atrophy. Exclusion criteria were (1) insufficiently clear media to allow retinal imaging, (2) history of any other macular or retinal disease aside from age-related macular degeneration, (3) extension of the area of atrophy beyond the field of the image and (4) evidence or history of neovascularisation.
Imaging
All imaging was performed following pupillary dilation. The 488 nm FAF imaging was performed using a Spectralis (Heidelberg Engineering, Heidelberg, Germany) device which uses a 488 nm illumination wavelength and emission detection between 500 and 700 nm. The field of view was set to 30×30° (resolution of 768×768 pixels). Several single FAF were automatically aligned and averaged to maximise the signal-to-noise ratio using the manufacturer’s software.
The 450 nm FAF images were obtained with a confocal fundus imaging system (Eidon; CenterVue), which has an emission spectrum detection of 500 to 750 nm. The device automatically aligns the patient such that the optics and light path are centred in the pupil and an autofocus procedure is then performed to compensate for the eye’s spherical defect. A greyscale FAF image with a frame size of 60(h)×55(w) degrees and a resolution of 3680×3288 pixels was acquired with a single exposure. The device also generates a ‘colour’ image (colour FAF) based on the detected autofluorescence wavelength. This colour FAF image consists of only the ‘red’ and ‘green’ channels.
SD-OCT imaging was performed using a Cirrus OCT (Carl Zeiss Meditec, Dublin, California, USA) with a macular cube 512×128 scan protocol covering a 6×6 mm area centred onto the fovea. To be included in the analysis, a signal strength of at least 6 was required (as recommended by the manufacturer manual). Only the infrared reflectance image acquired concomitantly with the OCT was used for this analysis.
Image processing—red filtered image
As the commercial Eidon FAF system does not currently automatically provide an image isolating the autofluorescence predominantly due to the presence of REFC, additional image processing was performed, as illustrated in figure 1.
Figure 1.

Representation of the algorithm used to process the images. In order to isolate the red emission fluorescence component (REFC) and obtain the 450-red filtered (RF) images, the colour fundus autofluorescence (FAF) image was duplicated and the two resulted images underwent the following process: (1) one image was first transformed in a 32-bit image and thus converted in an 8-bit greyscale image; (2) the other (duplicate) image subject to the ‘split channels’ function, which splits the image into the respective red and green image channels (note: no blue channel is present in a colour FAF image). Finally, in order to optimise the visualisation of those regions where the REFC is absent or the autofluorescence is mainly due to the presence of green emission fluorescence component, a ‘subtraction’ function was performed, subtracting the ‘green channel’ of the colour FAF image from the obtained greyscale FAF image, to yield the 450-RF FAF image.
For each eye, the 450 nm colour FAF image was exported and then imported into image analysis ImageJ software V.1.50 (National Institutes of Health, Bethesda, Maryland, USA; available at http://rsb.info.nih.gov/ij/index.html). The colour FAF image was duplicated and the two resultant images underwent two different processes.
One image was processed with the ‘split channels’ function, which splits the image into the respective red (R) and green (G) image channels (no blue channel (B) was present in the colour FAF image).
The second image was first transformed in a 32-bit greyscale image and then converted to an 8-bit greyscale image. This transformation reduces information loss since after this conversion, the 8-bit image uses the current minimum and maximum as the white and black reference points, stretching or compressing everything in between.
Finally, in order to optimise the visualisation of those regions where autofluorescence is mainly due to the presence of REFC, a ‘subtraction’ function was performed, subtracting the ‘green channel’ of the colour FAF image from the obtained greyscale FAF image, to yield the 450-RF image.
By using this approach rather than simply using the red channel of the colour FAF image, all those regions where the intensity of the REFC is 0 and/or the autofluorescence is mainly due to the presence of GEFC are thus masked (please see ‘Methodology—online supplementary material 1’ for further details).
bjophthalmol-2018-311849supp003.pdf (31.6KB, pdf)
Image processing—green emission fluorescence component isolation
The image-processing algorithm to isolate and evaluate the GEFC within the GA has been previously described.13 In brief, the ‘subtraction’ function is applied, subtracting the ‘red channel’ of the colour FAF image from the greyscale FAF image, to yield the image highlighting the GEFC from the 450 color-FAF image. By using this approach rather than simply using the green channel of the colour FAF image, all those regions where the GEFC is at least equivalent to the REFC are thus masked. Finally, the processed images were ‘binarised’ to identify areas exhibiting regions of strong GEFC signal following the subtraction feature. The GEFC area within the GA, which corresponded to the area occupied by pixels over the applied threshold, was thus automatically calculated in millimetres.2 This value was used in order to determine whether the increased activation of short-wave fluorophores with the 450 nm wavelength influenced the inter-reader and intermodality variability (online supplementary figure 1).
bjophthalmol-2018-311849supp001.png (1.9MB, png)
Grading protocol
The grading protocol is illustrated in figure 2.
Figure 2.

Schematic of the grading protocol. For each eye, all the three images for grading (488-FAF, 450-FAF and 450-RF) were registered to the same size and location. Then, two certified graders independently delineated the border of the geographic atrophy lesions. After grading of all the cases was completed, graders later met to compare level of agreement and, for each case, a single graded image was chosen after further discussion and open adjudication.
First, all three images (488-FAF, 450-FAF and 450-RF) were opened in the image analysis software, ImageJ, and registered to the same size and location. Then, two certified Doheny Image Reading Center (DIRC) graders (MGN and NSA) independently delineated the border of the GA lesions. Only areas of definite decreased autofluorescence were graded, as previously described.15 16 Graders were masked for the image modality and all the images were mixed and randomly graded. Since both 450 nm and 488 nm excitation wavelengths are known to be limited in the assessment of the fovea by macular pigment absorption,17 infrared images from OCT scans were masked throughout the grading process and were unmasked only when foveal involvement was deemed questionable after grading of FAF images. To facilitate the masking, the grading tasks were also carried out on separate days. Grading results were exported as a binary mask and automatically calculated in millimetres2.
After grading of all the cases was completed, graders later met to compare level of agreement and, for each case, a single graded image was chosen after further discussion and open adjudication. In those cases in which the two graders did not agree on a single consensus result, the final decision was made by the emeritus medical director of the DIRC (SRS). This image obtained after adjudication was used to assess the intermodality variability. Furthermore, in the 488-FAF images in which the GA lesion measured smaller compared with the 450-RF images, a third grader (EB) correlated regions of discordance with the OCT B-scans.
Statistical analysis
Statistical calculations were performed using Statistical Package for Social Sciences (V.20.0; SPSS).
For each imaging modality (488-FAF, 450-FAF and 450-RF), the intraclass correlation coefficient (ICC; two-way random, absolute agreement), the 95% coefficient of repeatability (CR) and the coefficient of variation (CV) were determined. For visualisation of the level of agreement, Bland-Altman graphs were plotted. For each imaging modality, Spearman’s rank correlation coefficient (ρ) was calculated between the absolute intergrader differences and the GEFC area values in order to determine whether measurement variability increases with the activation of short-wave fluorophores.
Friedman's two-way analysis of variance non-parametric test was conducted to compare the graded GA area among the three imaging modalities, in order to assess the intermodality variability. Spearman’s rank correlation coefficient was calculated between the GEFC area values and the absolute differences between 450-FAF-based and 488-FAF-based grading.
The chosen level of statistical significance was p <0.05.
The sample size of the study was tested to be proper for a mean difference between groups of almost 10%, a power of 80% and type I error rate (α) of 5%.
Results
Thirty eyes (21 patients, 6 men) with GA were enrolled. Mean±SD age of the patients enrolled was 83.0±6.5 years (range 70–93 years). BCVA was 0.47±0.32 logMAR. Twenty-one eyes were characterised by foveal sparing.
Inter-reader agreement
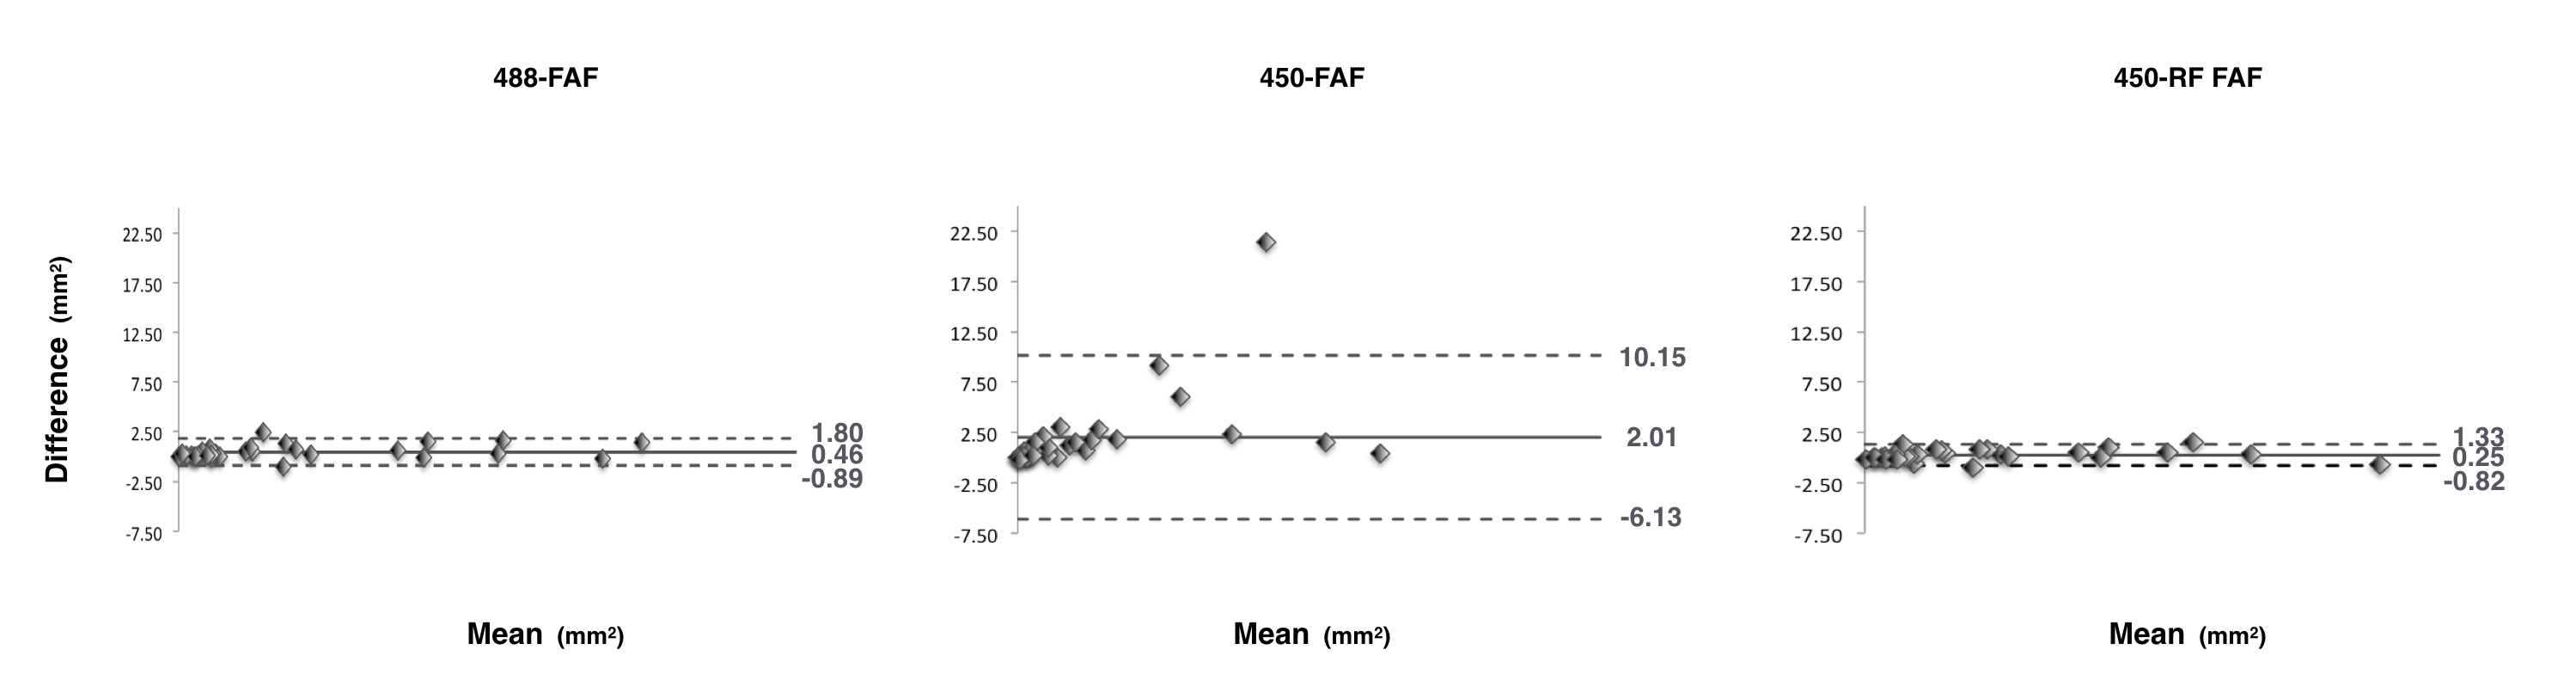
The level of agreement between graders is illustrated in the Bland-Altman plots (online supplementary figure 2) and in table 1. The mean absolute inter-reader difference between measured GA areas was 0.46, 2.01 and 0.25 mm2 for 488-FAF, 450-FAF and 450-RF images, respectively. The CR (the value below which the difference between two measurements will lie in 95% of cases) was 1.35 mm2 for the 488-FAF-based grading, 8.13 mm2 for the 450-FAF-based grading and 1.08 mm2 for the 450-RF-based grading. Likewise, the CV (1.11 for 488-FAF, 2.05 for 450-FAF, 0.92 for 450-RF) and ICC (0.994 for 488-FAF, 0.711 for 450-FAF, 0.997 for 450-RF) indicated that 450-FAF-based and 450-RF-based grading have the lowest and highest inter-reader agreements, respectively.
Table 1.
Comparison of measurement from three imaging modalities
| 488-FAF | 450-FAF | 450-RF | |
| Mean absolute inter-reader difference (mm2) | 0.46 | 2.01 | 0.25 |
| CR (mm2) | 1.35 | 8.13 | 1.08 |
| CV | 1.11 | 2.05 | 0.92 |
| ICC | 0.994 | 0.711 | 0.997 |
| GA area (mm2), median (IQR) | 2.1 (0.8–6.4) | 1.0 (0.3–4.3) | 2.6 (0.8–6.8) |
CR, 95% coefficient of repeatability; CV, coefficient of variation; FAF, fundus autofluorescence; GA, geographic atrophy; ICC, intraclass correlation coefficient; 450-FAF, FAF with the 450 nm wavelength excitation light; 450-RF, image obtained from the elaboration of the ‘colour’ 450-FAF; 488-FAF, FAF with the 488 nm wavelength excitation light.
bjophthalmol-2018-311849supp002.png (183.6KB, png)
The GEFC area within the GA (median 0.2 mm2; IQR 0.0–1.1 mm2) was significantly correlated with the absolute inter-reader difference for 450-FAF images (ρ=0.550 and p=0.002), but not for 488-FAF and 450-RF images (ρ=0.198 and p=0.295, ρ=−0.049 p=0.798, respectively).
Intermodality comparison
Median (IQR) GA graded areas were 2.1 mm2 (0.8–6.4 mm2), 1.0 mm2 (0.3–4.3 mm2) and 2.6 mm2 (0.8–6.8 mm2) for the 488-FAF, 450-FAF and 450-RF images, respectively (table 1, figure 3).
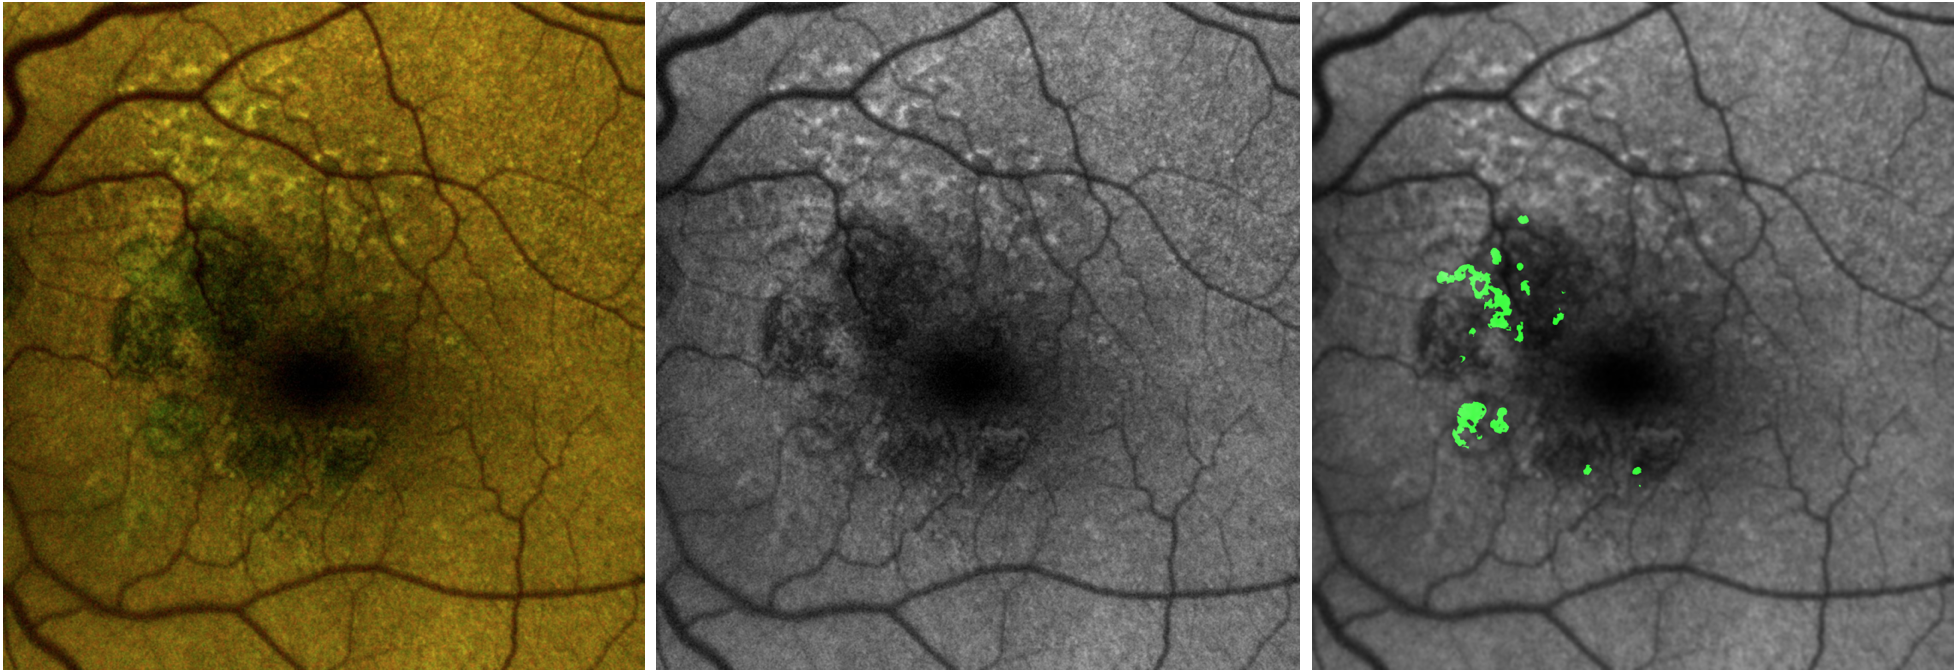
Figure 3.

Fundus autofluorescence images from three eyes (one for each line) affected by geographic atrophy. The 488 nm fundus autofluorescence (FAF) image (left) shows well-demarcated areas of definite decreased autofluorescence. These areas are not visible in the 450-FAF image (left-middle). The colour FAF image (right-middle) shows that in those areas of disagreement between the 488-FAF and 450-FAF, despite a reduced red emission autofluorescence component (REFC), the green emission autofluorescence component is still present. The image that highlights the REFC (right, 450-RF FAF) improves the 450-FAF’s capability to detect areas of definite decreased autofluorescence due to lipofuscin reduction/absence. In the second line, white arrows highlight the principal region of disagreement between the two FAF modalities.
The GA area measurement was larger for 488-FAF images than for 450-FAF images (p<0.0001). Similarly, 450-RF-based measurements were significantly larger than 450-FAF-based measurements (p<0.0001). There was no significant difference in lesion area measurement between 488-FAF-based and 450-RF-based grading (p=1.0).
The GEFC area values within the GA were significantly correlated with the absolute differences between 450-FAF-based and 488-FAF-based GA area grading (ρ=0.727 and p<0.0001). The disagreement in 450-FAF-based and 488-FAF-based GA size grading was not influenced by foveal involvement (p=0.306 in the comparison between foveal involvement and foveal sparing eyes).
Discussion
In this prospective, cross-sectional study, we compared two blue-light confocal FAF systems, which differ in light source and wavelength for excitation (488 nm SLO and 450 nm LED). Overall, we observed that the increased excitation of short-wavelength GEFC-emitting fluorophores may negatively impact the reliability of 450-FAF for detection and measurement of GA. However, the isolation of the REFC from the 450-FAF images allowed for an accurate and reproducible quantification of GA lesions.
Numerous studies have evaluated eyes with GA using 488-FAF.18 19 Using an excitation wavelength of 488 nm and an emission bandwidth of 500–700 nm, GA areas exhibit very low to extinguished autofluorescence signal as RPE and photoreceptor cell death is accompanied by loss of lipofuscin.10 20–22 The latter aspect leads to a high contrast between the atrophic and perilesional retina with an accurate measurement of the GA area allowing the enlargement of these lesions to be precisely monitored.
Our group has recently studied the AMD-associated macular atrophy using a 450 nm wavelength FAF device.13 While at 488 nm the retinal fluorescence intensity is dominated by the fluorescence from lipofuscin fluorophores, other minor fluorophores contribute to the fluorescence when the retina is excited with the 450 nm wavelength.8 Given that these minor fluorophores contribute to the fluorescence intensity in the short-wavelength emission range (510–560 nm, green spectrum), we demonstrated that the bed of atrophy appears to be characterised by residual green-component autofluorescence emission signal. Moreover, complementary OCT imaging allowed us to define the morphological associations of these areas of GEFC. Specifically, we observed that high GEFC signal corresponded to subretinal hyper-reflective material. Comparison with previous histological studies23 allowed us to speculate that this material, which appears to be residual drusenoid material, may be composed in part of advanced glycation end products). Therefore, using a 450 nm wavelength allows us to investigate minor fluorophores, which might have a prognostic role in AMD progression.
In the present study, we observed that 450-FAF-based lesion measurements were significantly smaller than 488-FAF-based measurements. Furthermore, we found an association between the intermodality disagreement and the quantity of GEFC within the GA area. These results thus confirmed our hypothesis that the increased activation of minor fluorophores may reduce the 450 nm wavelength FAF device’s capability to detect and assess the GA.
Since the presence of short-wave fluorophores may influence the GA evaluation in the 450-FAF grading, we created an image-processing algorithm to highlight and isolate the REFC signal, which is thought to originate from lipofuscin fluorophores. This processing approach, which was facilitated by separation of the colour FAF image into red and green channels, allowed us to generate this third type of FAF image, which we termed the 450-RF image. Our analysis demonstrated a high level of intermodality agreement between 488-FAF and 450-RF measurements, which appears to validate our hypothesis that isolation of the REFC improves the capability of 450-FAF imaging to assess the area of GA. In other words, we speculate that the presence of minor fluorophores constituting hyperreflective ‘debris’ within the bed area of the GA may impact GA assessment by 450-FAF images, and that image processing to highlight the REFC from the 450-FAF images facilitates a more accurate identification of regions without lipofuscin. An alternative hypothesis is that the RPE atrophy may unmask and thus increase the short-wavelength fluorescence from collagen in Bruch’s membrane and the choroid, which may confound the 450-FAF assessment and may also be addressed by our image processing approach.
Of note, though not statistically significant, we observed a trend for a slightly larger GA area measurement from 450-RF images compared with 488-FAF images. This aspect may be partially due to the fact that even though short-wave fluorophores have very weak fluorescence when excited with the 488 nm wavelength, they still contribute (although minimally) to the total fluorescence in 488-FAF images. In a post hoc review of the 488-FAF images in which the GA lesion measured smaller compared with the 450-RF images, we observed that in regions of the macula where the grading was discordant, the putative atrophy did not appear as hypofluorescent (eg, ‘grey’ appearance rather than ‘black’), and thus the grader presumably was not certain as to whether such regions should be included as atrophy (figure 4). Previous studies have shown that this may be due to subretinal hyper-reflective material located within the bed of atrophy,24 and more recently we have shown that this material is composed of green-emitting fluorophores.13 Even for 488-FAF imaging, these green-emitting fluorophores may interfere with assessment of GA-related hypoautofluorescence. Further studies comparing 488-FAF and 450-RF imaging with other image modalities (eg, OCT) should be performed to determine whether the isolation of the REFC from the 450-FAF images may provide an increased specificity and sensibility in quantifying GA.
Figure 4.

Fundus autofluorescence images from the left eye of a 75-year-old patient affected by geographic atrophy. Either 488 nm fundus autofluorescence (FAF) image (left) and 450-red filtered (RF) FAF image shows well-demarcated areas of definite decreased autofluorescence. In a post hoc review of this case, we found an area of disagreement between the two modalities (highlighted and magnified in the two FAF images), which was included only in the 450-RF-based grading. We observed that in the region of the macula where the grading was discordant, the putative atrophy did not appear as hypofluorescent on the 488-FAF image (eg, ‘grey’ appearance rather than ‘black’), and thus the grader presumably was not certain as to whether such regions should be included as atrophy. In this case, the area of disagreement correlated with the presence of hyper-reflective material located within the bed of atrophy (white stars), as demonstrated in the spectral-domain optical coherence tomography scans.
The recently published ‘Classification of Atrophy Meeting’ consensus has recommended the use of colour fundus photography, 488-FAF, near-infrared and OCT in clinical trials with GA quantification.25 26 Several studies have assessed the inter-reader agreement of these modalities, which was reported to be highest for 488-FAF and OCT imaging modalities.22 Our results similarly showed an excellent inter-reader agreement in the 488-FAF-based grading. In contrast, the ICC and CV values were worse in the 450-FAF images. Furthermore, even the CR, which is known to be independent of the average lesion size, was worse in the 450-FAF-based measurements. The reduced inter-reader agreement for the 450-FAF images was hypothesised to be secondary to the increased activation of the short-wave fluorophores. Since they have a very weak fluorescence signal compared with lipofuscin, their excitation may make the GA border challenging to delineate. Strong evidence corroborating this hypothesis is furnished by our results, which showed a positive correlation between GEFC area within the GA and the absolute inter-reader difference for 450-FAF images.
Of note, the highest inter-reader agreement was observed for 450-RF-based grading. This is most likely attributable to the sharper contrast at lesion boundaries in these images, as the GA lesion appeared to be more uniformly hypoautofluorescent in these 450-RF images.
Our study has some limitations that should be considered when assessing our findings. First, the sample size of the cohort is relatively small, which reduces the power of our analysis. In particular, we were not powered to evaluate for small differences between the 488-FAF and 450-RF assessments. Second, we did not enrol patients with significant media opacities. Since opacities may affect more the transmission of shorter wavelength light, our conclusions are thus limited to those eyes with relatively clear ocular media, which permit good-quality imaging. Moreover, the image processing we adopted to highlight the REFC is novel and may have limitations. Importantly, a basic problem with any image subtraction procedure is that the noise level in the resulting image is higher and can confound the analysis.27 Thus, we are not able to quantify how this increased noise may have influenced our results. In addition, colour FAF imaging is still a technology in evolution, and the optimal processing approaches have yet to be established. A final limitation is that we included eyes affected by GA with and without foveal involvement. However, the presence of foveal involvement was demonstrated to not affect the intermodality comparison. Finally, the foveal mean fluorescence intensity as a function of the excitation wavelength is almost constant in the range of 450–500 nm.17
In summary, using 450 nm short blue-light excitation wavelength and separate detection of both the green and red components of the autofluorescence signal allowed an accurate and reproducible quantification of GA in patients with AMD. The images obtained by isolating the red-component autofluorescence emission have the highest inter-reader agreement, along with good comparability with 488-FAF images. Further studies comparing 450-RF imaging with other image modalities such as OCT would be of benefit. Regardless, the potential of 450-RF imaging to evaluate GA lesions warrants further study and may be of particular relevance given the many ongoing trials of potential therapeutics for GA.
Footnotes
Contributors: Study concept and design: EB and SRS. Acquisition, analysis or interpretation of data: all authors. Drafting of the manuscript: EB and SRS. Critical revision of the manuscript for important intellectual content: all authors. Statistical analysis: EB, MGN, SRS. Study supervision: EB and SRS.
Funding: Financial support—Bayer, CenterVue, Genentech, Novartis, Roche. GS: financial support—Novartis, Alcon, Bayer, Allergan, Boehringer Ingelheim, Genentech, Roche, Zeiss Meditec, Heidelberg Engineering, Optos, CenterVue. SRS: financial support—Allergan, CenterVue, Carl Zeiss Meditec, Genentech, Iconic, Novartis, Optos, Optovue, Regeneron, Thrombogenics.
Competing interests: None declared.
Patient consent: Parental/guardian consent obtained.
Ethics approval: UCLA IRB.
Provenance and peer review: Not commissioned; externally peer reviewed.
References
- 1. Ferris FL, Wilkinson CP, Bird A, et al. Clinical classification of age-related macular degeneration. Ophthalmology 2013;120:844–51. 10.1016/j.ophtha.2012.10.036 [DOI] [PMC free article] [PubMed] [Google Scholar]
- 2. Klein R, Chou C-F, Klein BEK. Prevalence of age-related macular degeneration in the US population. Arch Ophthal 2011;129:75–80. 10.1001/archophthalmol.2010.318 [DOI] [PubMed] [Google Scholar]
- 3. Bindewald A, et al. Classification of abnormal fundus autofluorescence patterns in the junctional zone of geographic atrophy in patients with age related macular degeneration. Br J Ophthalmol 2005;89:874–8. 10.1136/bjo.2004.057794 [DOI] [PMC free article] [PubMed] [Google Scholar]
- 4. Schmitz-Valckenberg S, Bindewald-Wittich A, Dolar-Szczasny J, et al. Correlation between the area of increased autofluorescence surrounding geographic atrophy and disease progression in patients with AMD. Investigative Opthalmology & Visual Science 2006;47:2648–54. 10.1167/iovs.05-0892 [DOI] [PubMed] [Google Scholar]
- 5. Holz FG, Bindewald-Wittich A, Fleckenstein M, et al. Progression of geographic atrophy and impact of fundus autofluorescence patterns in age-related macular degeneration. Am J Ophthalmol 2007;143:463–472. 10.1016/j.ajo.2006.11.041 [DOI] [PubMed] [Google Scholar]
- 6. Bellmann C, Jorzik J, Spital G, et al. Symmetry of bilateral lesions in geographic atrophy in patients with age-related macular degeneration. Arch Ophthalmol 2002;120:579–84. 10.1001/archopht.120.5.579 [DOI] [PubMed] [Google Scholar]
- 7. Schmitz-Valckenberg S, Jorzik J, Unnebrink K, et al. Analysis of digital scanning laser ophthalmoscopy fundus autofluorescence images of geographic atrophy in advanced age-related macular degeneration. Graefes Arch Clin Exp Ophthalmol 2002;240:73–8. 10.1007/s00417-001-0413-3 [DOI] [PubMed] [Google Scholar]
- 8. Schweitzer D, Schenke S, Hammer M, et al. Towards metabolic mapping of the human retina. Microsc Res Tech 2007;70:410–9. 10.1002/jemt.20427 [DOI] [PubMed] [Google Scholar]
- 9. Keane PA, Sadda SR, Spijker R. Retinal imaging in the twenty-first century: state of the art and future directions. Ophthalmology 2014;121:2489–500. 10.1016/j.ophtha.2014.07.054 [DOI] [PubMed] [Google Scholar]
- 10. Domalpally A, Danis R, Agrón E, et al. Evaluation of geographic atrophy from color photographs and fundus autofluorescence images. Ophthalmology 2016;123:2401–7. 10.1016/j.ophtha.2016.06.025 [DOI] [PMC free article] [PubMed] [Google Scholar]
- 11. Schmitz-Valckenberg S, Sahel J-A, Danis R, et al. Natural history of geographic atrophy progression secondary to age-related macular degeneration (Geographic Atrophy Progression Study). Ophthalmology 2016;123:361–8. 10.1016/j.ophtha.2015.09.036 [DOI] [PubMed] [Google Scholar]
- 12. Marmorstein AD, Marmorstein LY, Sakaguchi H, et al. Spectral profiling of autofluorescence associated with lipofuscin, Bruch's Membrane, and sub-RPE deposits in normal and AMD eyes. Invest Ophthalmol Vis Sci 2002;43:2435–41. [PubMed] [Google Scholar]
- 13. Borrelli E, Lei J, Balasubramanian S, et al. Green emission fluorophores in eyes with atrophic age-related macular degeneration: a colour fundus autofluorescence pilot study. Br J Ophthalmol 2019;102:827–32. 10.1136/bjophthalmol-2017-310881 [DOI] [PubMed] [Google Scholar]
- 14. Holladay JT. Proper method for calculating average visual acuity. J Refract Surg 1997;13:388–91. [DOI] [PubMed] [Google Scholar]
- 15. Kuehlewein L, Hariri AH, Ho A, et al. Comparison of manual and semiautomated fundus autofluorescence analysis OF macular atrophy in Stargardt disease phenotype. Retina 2016;36:1216–21. 10.1097/IAE.0000000000000870 [DOI] [PubMed] [Google Scholar]
- 16. Hariri AH, Nittala MG, Sadda SR. Quantitative characteristics of spectral-domain optical coherence tomography in corresponding areas of increased autofluorescence at the margin of geographic atrophy in patients with age-related macular degeneration. Ophthalmic Surgery, Lasers and Imaging Retina 2016;47:523–7. 10.3928/23258160-20160601-03 [DOI] [PubMed] [Google Scholar]
- 17. Delori FC. Autofluorescence method to measure macular pigment optical densities fluorometry and autofluorescence imaging. Arch Biochem Biophys 2004;430:156–62. 10.1016/j.abb.2004.05.016 [DOI] [PubMed] [Google Scholar]
- 18. Holz FG, Bellman C, Staudt S, et al. Fundus autofluorescence and development of geographic atrophy in age-related macular degeneration. Invest Ophthalmol Vis Sci 2001;42:1051–6. [PubMed] [Google Scholar]
- 19. Schmitz-Valckenberg S, Fleckenstein M, Scholl HPN, et al. Fundus autofluorescence and progression of age-related macular degeneration. Surv Ophthalmol 2009;54:96–117. 10.1016/j.survophthal.2008.10.004 [DOI] [PubMed] [Google Scholar]
- 20. Hariri AH, Tepelus TC, Akil H, et al. Retinal sensitivity at the junctional zone of eyes with geographic atrophy due to age-related macular degeneration. Am J Ophthalmol 2016;168:122–8. 10.1016/j.ajo.2016.05.007 [DOI] [PubMed] [Google Scholar]
- 21. Lindner M, Nadal J, Mauschitz MM, et al. Combined fundus autofluorescence and near infrared reflectance as prognostic biomarkers for visual acuity in foveal-sparing geographic atrophy. Invest Ophthalmol Vis Sci 2017;58:BIO61 10.1167/iovs.16-21210 [DOI] [PubMed] [Google Scholar]
- 22. Pfau M, Goerdt L, Schmitz-Valckenberg S, et al. Green-light autofluorescence versus combined blue-light autofluorescence and near-infrared reflectance imaging in geographic atrophy secondary to age-related macular degeneration. Investigative Opthalmology & Visual Science 2017;58:BIO121 10.1167/iovs.17-21764 [DOI] [PubMed] [Google Scholar]
- 23. Ishibashi T, et al. Advanced glycation end products in age-related macular degeneration. Arch Ophthal 1998;116:1629–32. 10.1001/archopht.116.12.1629 [DOI] [PubMed] [Google Scholar]
- 24. Oishi M, Oishi A, Lindner M, et al. Structural changes in optical coherence tomography underlying spots of increased autofluorescence in the perilesional zone of geographic atrophy. Investigative Opthalmology & Visual Science 2017;58:3303–10. 10.1167/iovs.17-21498 [DOI] [PubMed] [Google Scholar]
- 25. Holz FG, Sadda SR, Staurenghi G, et al. Imaging Protocols in clinical studies in advanced age-related macular degeneration: recommendations from classification of atrophy consensus meetings. Ophthalmology 2017;124:464–78. 10.1016/j.ophtha.2016.12.002 [DOI] [PubMed] [Google Scholar]
- 26. Sadda SR, Guymer R, Holz FG, et al. Consensus definition for atrophy associated with age-related macular degeneration on OCT: Classification of Atrophy Report 3. Ophthalmology 2018;125:537–48. 10.1016/j.ophtha.2017.09.028 [DOI] [PMC free article] [PubMed] [Google Scholar]
- 27. Alter A. Physical principles of medical imaging by Perry Sprawls, Jr. Vol 15. American Association of Physicists in Medicine 1988. 10.1118/1.596262 [DOI] [Google Scholar]
Associated Data
This section collects any data citations, data availability statements, or supplementary materials included in this article.
Supplementary Materials
bjophthalmol-2018-311849supp003.pdf (31.6KB, pdf)
bjophthalmol-2018-311849supp001.png (1.9MB, png)
bjophthalmol-2018-311849supp002.png (183.6KB, png)