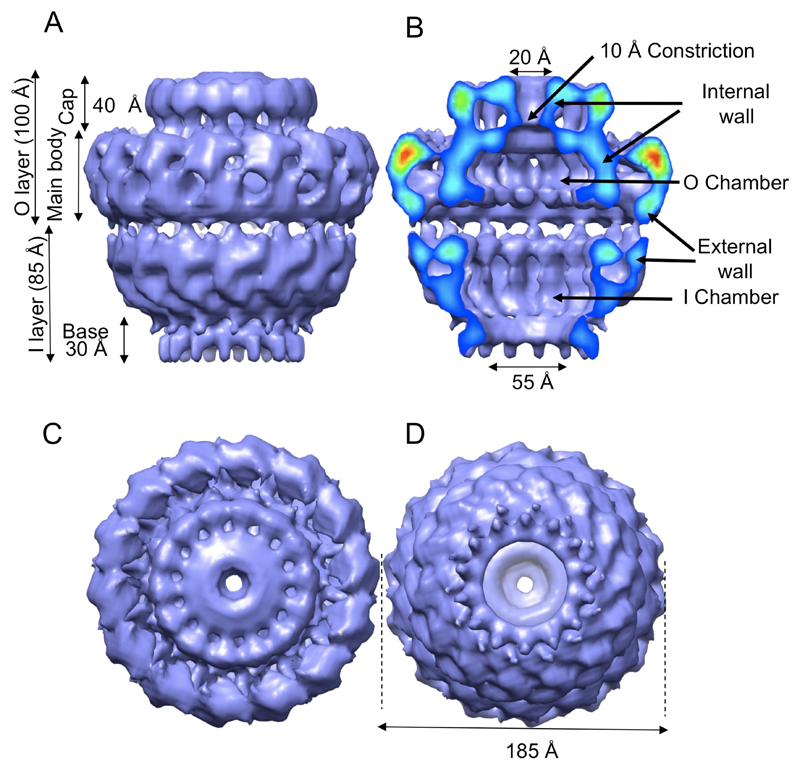
Fig.2.
Cryo-EM structure of the TraN/VirB7, TraO/VirB9, and TraF/VirB10C-ST core complex. A. Side-view. B. Cut-away side view. Electron density is color-coded from red to blue to indicate regions of strong to weaker density, respectively. C. Top view (view from outside the cell). D. Bottom view (view from the cytoplasm). All features and dimensions mentioned in the text are indicated.

