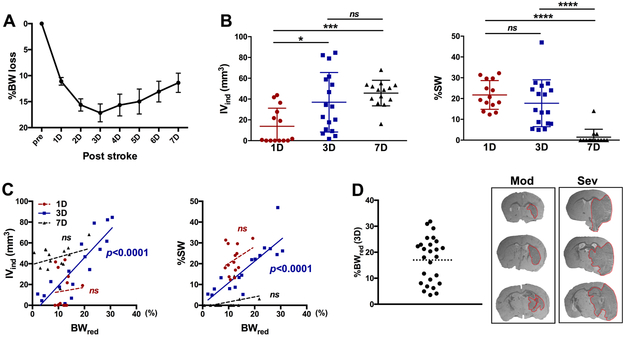
Figure 1. Association between stroke-induced body weight loss and injury severity.
A, Acute post-stroke body weight reduction at 1-7 days(D). n=26. B, Assessment of IVind and %SW after stroke, n=14-17/group. C, Correlation between %BWred and infarct volume or brain swelling. n=14-17/group. D, Distribution of BW loss at 3D post-stroke. The dotted line indicates 18% of BW loss (left). Cross-sections (+0.4 mm, −0.8 mm and −2.0 mm from bregma) from a representative mouse with moderate (Mod) weight reduction (%BWred 10.4 at 3D, IVind 17.7, %SW 8.0) and mouse with severe (Sev) reduction (%BWred 25.5 at 3D, IVind 61.9, %SW 41.5). n=26. Pre, pre-stroke baseline; IVind, indirect infarct volume; %SW, Percent hemispheric swelling; BWred (3D), body weight reduction at 3D; *, ***, ****p<0.01, 0.001, 0.0001. ns, not significant.

