Abstract
Imaging the perivascular spaces (PVS), also known as Virchow-Robin space, has significant clinical value, but there remains a need for neuroimaging techniques to improve mapping and quantification of the PVS. Current technique for PVS evaluation is a scoring system based on visual reading of visible PVS in regions of interest, and often limited to large caliber PVS. Enhancing the visibility of the PVS could support medical diagnosis and enable novel neuroscientific investigations. Increasing the MRI resolution is one approach to enhance the visibility of PVS but is limited by acquisition time and physical constraints. Alternatively, image processing approaches can be utilized to improve the contrast ratio between PVS and surrounding tissue. Here we combine T1- and T2-weighted images to enhance PVS contrast, intensifying the visibility of PVS. The Enhanced PVS Contrast (EPC) was achieved by combining T1- and T2-weighted images that were adaptively filtered to remove non-structured high-frequency spatial noise. EPC was evaluated on healthy young adults by presenting them to two expert readers and also through automated quantification. We found that EPC improves the conspicuity of the PVS and aid resolving a larger number of PVS. We also present a highly reliable automated PVS quantification approach, which was optimized using expert readings.
Subject terms: Diagnostic markers, Neurology, Cerebrovascular disorders
Introduction
Imaging the perivascular spaces (PVS), also known as Virchow-Robin space, has significant clinical value. Many recent studies have shown pathological alteration of PVS in a range of neurological disorders1–9. It is also believed that PVS plays a major role in the clearance system, accommodating the influx of CSF to brain parenchyma through peri-arterial space, and the efflux of interstitial fluid to the lymphatic system through peri-venous space6,10–13. MRI is a powerful tool that enables in vivo, non-invasive imaging of this less-known glia-lymphatic pathway.
In the clinical practice, PVS is quantified based on the number of visible PVS on the axial slice of a T2-weighted (T2w) image that has the highest number of PVS in the region of interest14. This process can be laborious and error-prone, so efforts to improve efficiency and accuracy have been made by using a wide range of automatic or semi-automatic segmentation techniques, from classical image processing approaches to deep neural network modelling15–25. Park et al. used auto-context orientational information of the PVS for automatic segmentation25. Recently, Ballerini et al. showed that Frangi filtering26 could robustly segment PVS by extracting the vesselness map based on the PVS tubular morphology20. More recently, Dubost et al. used convolutional neural network with a 3D kernel to automate the quantification of enlarged PVS27,28.
While these methods have improved the automated segmentation of PVS, less effort has been made to enhance the visibility of PVS through postprocessing means. A typical MRI session includes a variety of different sequences and utilizing different intensity profiles of these sequences can potentially improve PVS detection rate for both visual reading and automated segmentation. Combining MRI signal intensities has been used for other applications to achieve tissue-specific sensitivity. Van de Moortele et al. combined T1w and proton density images by dividing the latter by the former to improve signal non-uniformity at ultra-high field and optimize vessels visualization29. MRI multi-modal ratio was also used to map cortical myelin content30–32 (for a systematic evaluation of the contrast enhancement via the combination of T1w and T2w see33). Additionally, Wiggermann et al. combined T2w and FLAIR to improve the detection of multiple sclerosis lesions34.
Here we describe a multi-modal approach for enhancing the PVS visibility, which was achieved by combining T1w and T2w images that were adaptively filtered to remove non-structural high frequency spatial noise. Furthermore, we present an automated PVS quantification technique, which can be applied to T1w, T2w or the enhanced contrast. The efficacy of the Enhanced PVS Contrast (EPC) on both visual and automated detection is assessed and the reliability of the automated technique is examined.
Method
Four folds of evaluations were performed. First, the visibility of PVS in EPC was qualitatively and quantitively examined. Second, the visibility of PVS to expert readers was evaluated by comparing the number of PVS counted in EPC and T2w images. Third, PVS automatic counting was introduced and evaluated. Fourth, the reliability of the PVS automated quantification was assessed using scan-rescan MRI data.
MRI data
T1w and T2w images of the human connectome project (HCP)35 were used in the analysis. Structural images were acquired at 0.7 mm3 resolution images. We used data from “S900 release”, which includes 900 healthy participants (age, 22–37 years). The preprocessed T1w and T2w images36–38 were used. In brief: the structural images were corrected for gradient nonlinearity, readout, and bias field; aligned to AC-PC subject space and averaged when multiple runs were available; then registered to MNI 152 space using FSL39’s FNIRT. Individual white and pial surfaces were then generated using the FreeSurfer software40 and the HCP pipelines36,37. Among HCP subjects, 45 were scanned twice with scan-rescan interval of 139 ± 69 days; these scans were used to assess the reliability of the automated PVS quantification.
Enhanced PVS Contrast (EPC)
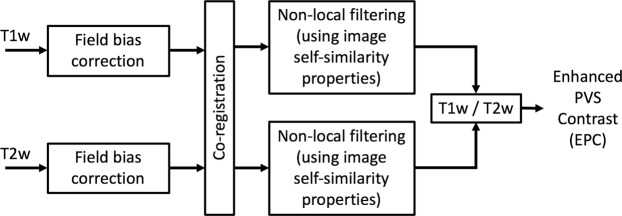
Figure 1 summarizes the steps required to obtain EPC. After preprocessing the data, T1w and T2w images were filtered using adaptive non-local mean filtering technique41. Non-local mean technique measures the image intensity similarities by taking into account the neighboring voxels in a blockwise fashion, where filtered image is . For each voxel (xj) the weight (ω) is measured using the Euclidean distance between 3D patches. The adaptive non-local mean filtering technique adds a regularization term to the above formulation to remove bias intensity of the Rician noise observed in MRI. Therefore the expected Euclidian distances between two noisy patches Ni and Nj is defined as:
| 1 |
where if . The Rician noise of the MRI images, calculated using robust noise estimation technique presented by Wiest-Daessle et al.42, was used as the noise level for non-local filtering41. To preserve PVS voxels while removing the noise, filtering was applied only on high frequency spatial noises. This was achieved by using a filtering patch with a radius of 1 voxel, which removes the noise at a single-voxel level and preserves signal intensities that are spatially repeated41. Finally, EPC was obtained by dividing filtered images (i.e. T1w/T2w).
Figure 1.
Flowchart of the Enhanced Perivascular space Contrast (EPC) technique.
PVS visibility was qualitatively compared across T1w, T2w, and EPC images in white matter and basal ganglia. PVS conspicuity was also assessed by comparing the PVS-to-white matter ratio in EPC images with that in T2, which was shown to provide a higher PVS contrast compared to T1w24. A number of PVS and non-PVS white matter voxels were randomly selected across 10 subjects (more than 50 voxels per subject) and the average PVS-to-white matter ratio was measured.
Expert reading and clinical scoring
PVS were independently rated in 100 randomly selected subjects of HCP by two expert readers (GB and NSB) on axial T2w and EPC images using a validated 5-point visual rating scale43 in basal ganglia and centrum semi-ovale (0: no PVS, 1: 1–10, 2: 11–20, 3: 21–40, and 4: >40 PVS). GB is a medical doctor with more than 5 years of neuroimaging research experience, and NSB is a neuroradiologist with 11 years of experience in radiology. Readers were blind to the rating results of each other. For validating the automated technique, the readers reached a consensus in few cases with different scores. One subject in which the PVS number was scored as “>100” by one of the readers was excluded from the statistical analysis. The total PVS score for each subject was calculated as the sum of the basal ganglia and centrum semi-ovale scores. The correlation between the number of PVS counted in T2w and EPC was calculated using Pearson correlation coefficient. PVS total counts were also compared using paired t-test. Lin’s concordance correlation44 was used to determine the concordance between the two raters. In addition, inter-class correlation (ICC) estimates and their 95% confident intervals were calculated based on a mean-rating (k = 2), absolute-agreement, two-way mixed-effects model, as recommended in45. The statistical analysis was performed using SciPy library (version 1.2.0) on Python 3 and MATLAB statistics and machine learning toolbox. P-values smaller than 1e-25 were reported as p = 0.
Automatic PVS quantification
We constructed a framework for PVS quantification and mapping using MRI, which can be applied to T1w, T2w, and EPC. Preprocessed data of HCP36 was used, which includes motion correction, non-uniform intensity normalization, Talairach transform computation, intensity normalization and skull stripping46–59. Then non-local mean filtering was applied and MRI images were parcellated to extract masks of white matter and basal ganglia, using n-tissue parcellation technique of the Advanced Normalization Tools (ANTs) software package60. Parcellated brain (including white matter and basal ganglia) was used as a mask for PVS quantification analysis.
Subsequently, we applied Frangi filter26 to T1w, T2w, and EPC images using Quantitative Imaging Toolkit61, which was implemented similar to20. Frangi filter estimates a vesselness measure for each voxel from eigenvectors λ of the Hessian matrix of the image:
| 2 |
Where,
| 3 |
Default parameters of α = 0.5, β = 0.5 and c were used, as recommended in26. The parameter c was set to half the value of the maximum Hessian norm. Frangi filter estimated vesselness measures at different scales and provided the maximum likeliness. The scale was set to a large range of 0.1 to 5 voxels in order to maximize the vessel inclusion. The output of this step is a quantitative map of vesselness in regions of interest, is taken to be the maximum across scales, as suggested in the original paper26. The range corresponds the specific levels in scale space that are searched for tubular structure feature detector. Thus, the outputs across voxels comprise vesselness measured across a range of filter scales.
In order to obtain a binary mask of PVS regions, the vesselness map should be thresholded. The binary mask enables automated PVS counting, volumetric, and spatial distribution analysis. Given that the vesselness value could vary across modalities, the threshold was optimized for each input image separately. We used the number of PVS counted by the experts for threshold optimization because of the absence of a ground truth. Vesselness values were standardized using robust scaling, in which values were scaled according to the inter-quartile range (IQR) to avoid the influence of large outliers:
| 4 |
Then, the binary image of PVS mask was obtained by thresholding .
| 5 |
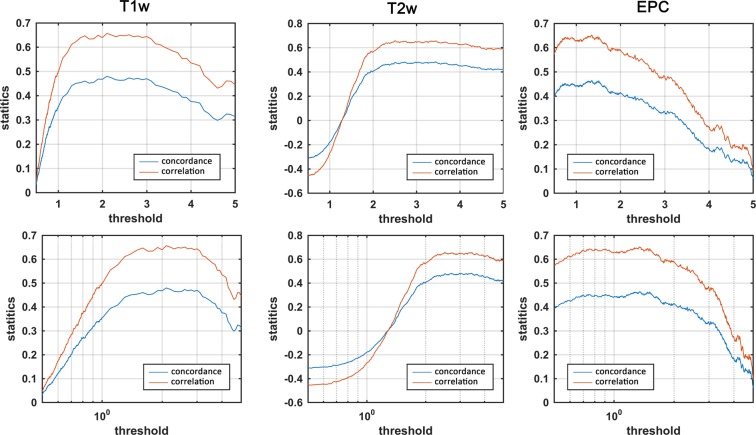
Then, the automated estimate of the total number of PVS was obtained by counting the number of connected components of the masked image P(s). Optimum thresholds were found by maximizing the concordance with the expert visual reading (concordance was used instead of absolute difference to optimize for global threshold and avoid biasing the threshold toward raters counting):
| 6 |
where a and e are one-dimensional arrays of PVS counts across all subjects (n = 100), obtained from the automated (a) and expert (e) readings, respectively. Kandall’s tau (τ) and Spearman’s Rho (ρ) were used to measure concordance and correlation, respectively. Average of expert readings from EPC images were used for optimization. Throughout the manuscript, the optimum thresholds of 2.3, 2.7 and 1.5 were used for T1w, T2w, and EPC, respectively.
After visual inspection, we noted that the imperfection of the white matter parcellation in periventricular and superficial white matter areas led to incorrected or missed PVS segmentation in white matter boundaries (an example is shown in Supplementary Fig. 1). Therefore, the subtraction of a dilated mask of ventricles from the PVS mask was applied to exclude the periventricular voxels and remove the incorrectly segmented PVS at the lateral ventricles-white matter boundary. After obtaining the final PVS mask, the number of PVS was obtained by counting the number of connected components of the PVS mask. Small components (<5 voxels) were excluded from automated counting to minimize noise contribution. The automated technique was applied on all subjects. Finally, one-way ANOVA was conducted to compare the effect of input image (T1w, T2w, and EPC) on the estimated number of PVS.
Test-retest reliability
We also evaluated the test-retest reliability of the PVS quantification with MRI. Forty MRI data from HCP35 that included scan-rescan were used for reliability analysis. EPC was derived, and the automated quantification pipeline was applied on the scan-rescan images (T1w, T2w and EPC images): identical parameters and threshold were applied on scan-rescan data. Then scan-rescan reliability was assed using ICC, Lin’s concordance44 and Pearson correlation analysis. ICC estimates and their 95% confident intervals were calculated based on a mean-rating (k = 2), absolute-agreement, two-way mixed-effects model.
Results
Evaluation 1: comparing the EPC with T1w and T2w
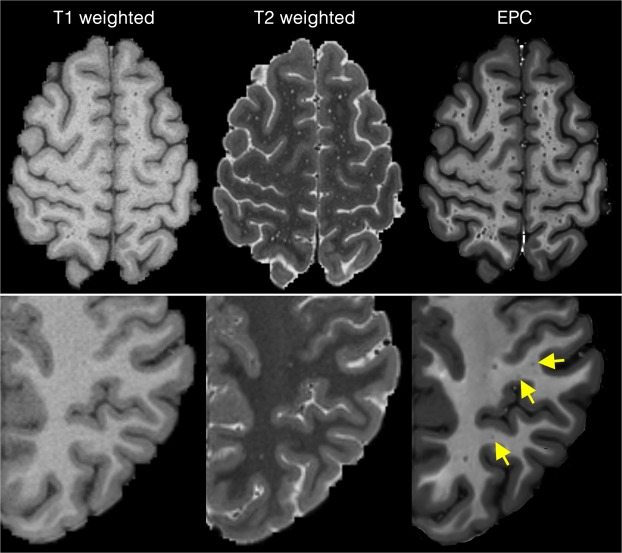
The PVS were more visible in EPC compared to T1w and T2w images (Figs 2 and 3, and Supplementary Fig. 2). The superiority of the EPC was evident in both white matter (Fig. 2) and basal ganglia (Fig. 3). EPC allowed the detection of PVS that were hardly identifiable in T1w and T2w (see yellow arrows in Fig. 2: PVS that could barely be spotted in T1w and T2w were evident in EPC). PVS were more conspicuous in EPC compared to T1w and T2w. Moreover, PVS-to-white matter contrast was significantly higher in EPC compared to that in T2w (Supplementary Fig. 3: ~2 times higher).
Figure 2.
Comparing Enhanced PVS Contrast (EPC) with T1w and T2w images across two subjects with high perivascular spaces (PVS) presence (first row) and low PVS presence (second row).
Figure 3.
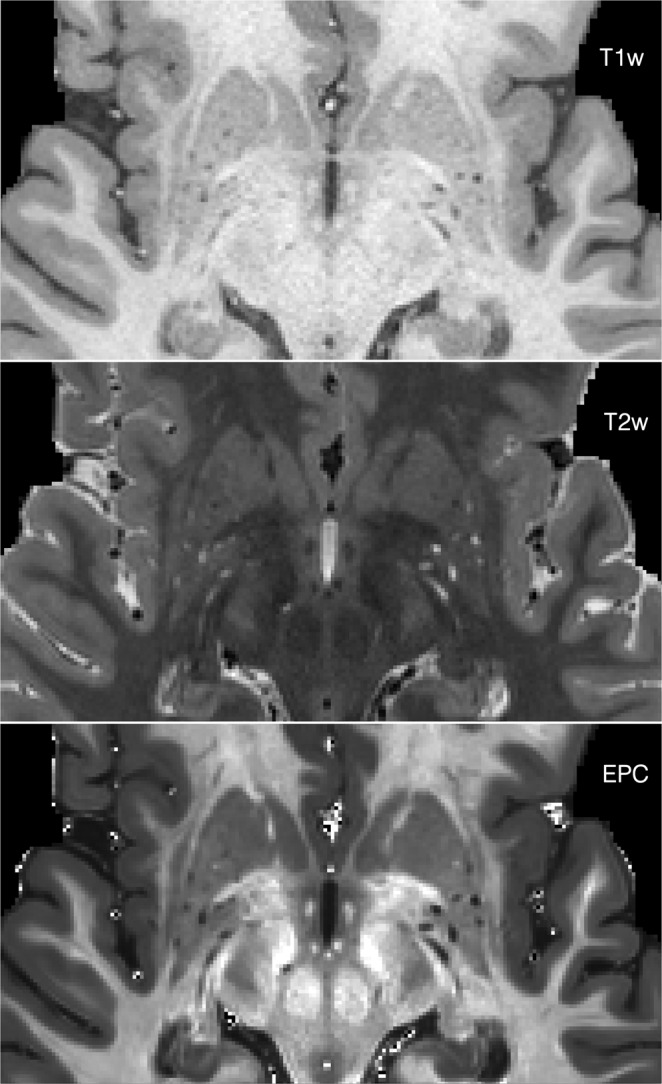
T1w, T2w, and the Enhanced PVS Contrast (EPC) images of the basal ganglia.
Evaluation 2: Expert reads of PVS from EPC and T2w
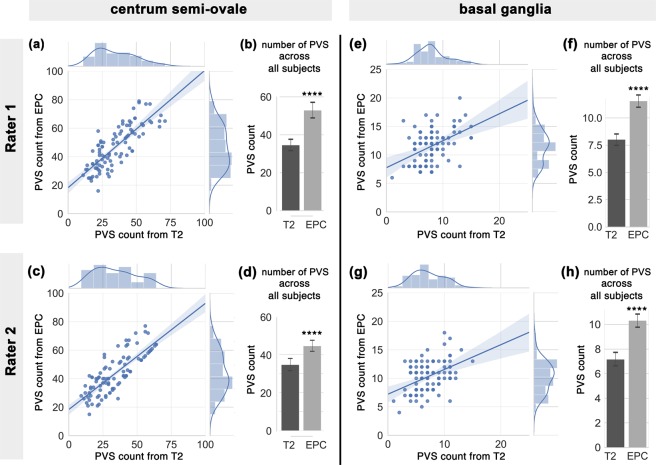
A significantly higher number of PVS was counted in centrum semi-ovale by the readers when EPC was used compared with T2w (Fig. 4a,b: t(198) = 5.8; p = 2.5e-08 and Fig. 4d,e: t(198) = 4.6; p = 7.6e-06). PVS numbers measured in EPC and T2w were significantly correlated (r = 0.81, p = 1.8e-23 and r = 0.8, p = 4.1e-23 for the first and second expert, respectively). However, PVS individual categories were different: when EPC was used, the majority of the subjects were rated 4 (i.e. more than 40 PVS counted) and the rest were rated 3 (i.e. 21–40 PVS counted), whereas in T2w the majority of the subjects were rated 3. In fact, when T2w images were used, readers counted 34.4 ± 14.4 and 34.2 ± 15.2 PVS on average; in EPC, the average PVS counted by the experts increased to 46.5 ± 14.7 and 43.8 ± 14.1. High inter-rater reliability and concordance were observed, with a slight increase when EPC was used. The average ICCs of T2w and EPC were 0.96 and 0.98, with 95% confident intervals of 0.938–0.972 (F(99) = 24.07, p = 0) and 0.966–0.985 (F(99) = 43.69, p = 0), respectively. Lin’s concordance coefficients for T2w and EPC were 0.92 and 0.94, respectively.
Figure 4.
PVS number (counted by experts readers) in centrum semi-ovale and basal ganglia across the analyzed subjects (N = 99), counted in T2-weighted (T2w) and enhanced PVS contrast (EPC) images. First row refers to the first expert reader, and second row relates to the second expert reader. (a,c) plots show the correlation between the number of PVS counted on T2w and EPC images, and their distribution. (b,d) bars compare the mean and standard deviation of PVS across all subjects as derived from T2w and EPC images. (e–h) plots are similar to (a–d) but related to basal ganglia scores. Note that expert readers counted significantly higher number of PVS when EPC was used (see results section for statistics).
A similar trend was observed in the basal ganglia (Fig. 4e–h), where a significantly higher number of PVS were counted with EPC (t(198) = 8.8; p = 8.2e-16 and t(198) = 8.14; p = 4.6e-14, for the first and second reader, respectively). Compared to centrum semi-ovale results, a lower correlation between PVS number obtained from T2w and EPC was observed in basal ganglia (r = 0.45, p = 2.6e-06 and r = 0.43, p = 5.9e-06, for the first and second readers, respectively). When T2w images were used, readers counted 8.0 ± 2.8 and 7.2 ± 2.7 PVS on average; while the average PVS counts increased to 11.6 ± 2.9 and 10.3 ± 2.7 in EPC images. Furthermore, inter-rater reliability and concordance was slightly higher when EPC was used. The average ICCs of T2w and EPC were 0.87 and 0.92, with 95% confident intervals of 0.81–0.91 (F(99) = 7.84, p = 0) and 0.87–0.94 (F(99) = 11.86, p = 0), respectively. Lin’s concordance coefficients for T2w and EPC were 0.74 and 0.77, respectively.
There are a few cases, concordantly found by both readers, where PVS count is higher in T2w than EPC: in most of those cases, the difference was minimal (1–2 PVS) and did not change the PVS class. Only 4 cases had 6–10 more PVS in T2w than EPC. Upon revisit we noted that these are related to cases in which the detection of the PVS from noise by the visual reader was challenging (due to the small size of the PVS and given that those cases had particularly noisy T2 images). Readers confirmed that the EPC results for these cases are more reliable.
Evaluation 3: PVS automated quantification
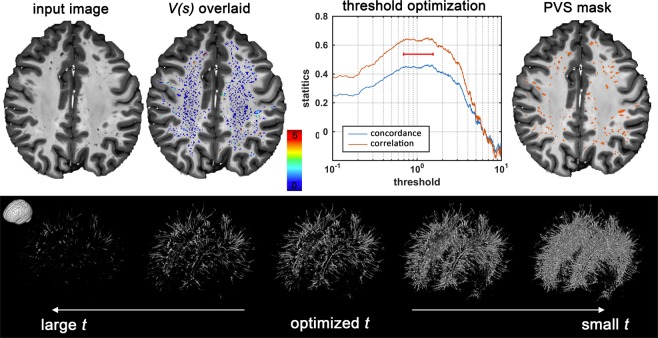
A map of vessel likeliness overlaid on EPC is shown in Fig. 5. PVS segmentation of the automated technique is dependent on the threshold applied. For EPC, provided the optimum threshold which led to the highest concordance and Spearman’s correlation with expert readings. Qualitative inspection of the PVS masks obtained with different threshold highlights the superiority of the derived threshold in comparison to smaller or larger thresholds. Optimum threshold was different for different inputs: and (Fig. 6).
Figure 5.
Automated quantification of PVS likeliness and PVS segmentation. First row shows an enhanced PVS contrast (EPC) image and the vesselness map, V(s), obtained from Frangi filtering (see method section and Eq. (2) for details). The optimization results to find an optimum global threshold for EPC is shown, in which t = 1.5 resulted to the highest concordance and correlation between automated PVS counting across the whole white matter and expert counting (number of PVS in the axial slice with the highest PVS presence). Second row highlights the influence of threshold selection on the PVS mask. A too small or too high threshold results in a large number of false positives or false negatives, respectively.
Figure 6.
Threshold optimization for segmenting PVS for different modalities. Concordance and correlation of automated PVS quantification with expert readings are presented for different threshold values. Second row shows the logscale plots. Given that threshold appeared to be optimum within a relatively wide range, a visual inspection of the threshold is recommended.
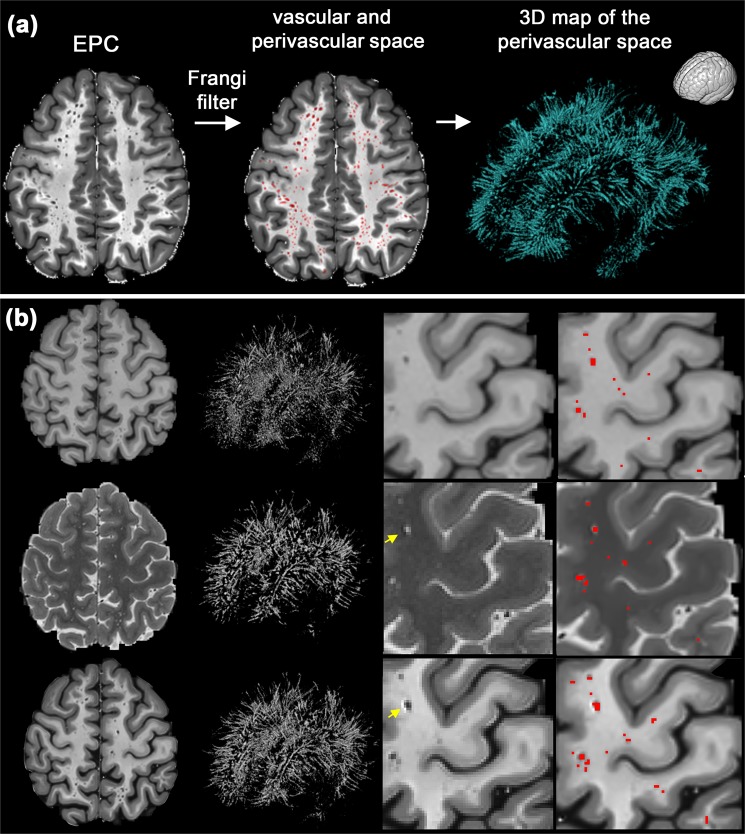
Visual inspection showed that, as expected, the Frangi filter was able to detect the tubular structures of the PVS (Fig. 7). No statistical evidence was found to suggest the automated quantification of PVS using EPC is superior to those derived from T1w and T2w. PVS quantification (number of PVS) were significantly correlated across T1w, T2w, and EPC results (all at p < 0.0001) and all the automatic measurements reported a similar concordance level with the expert scores. Lin’s concordance coefficient between automated PVS counts and expert scores was 0.81, the bias correction value (a measure of accuracy) was 0.88, and the Pearson correlation coefficient was 0.61 (p = 1.5e-11). The analysis of variance showed that the effect of input image (T1w, T2w, and EPC) on the number of PVS measured was significant F(2,294) = 48.56, p = 6.3e-19 which suggests that the automated technique for PVS quantification needs to be applied on the same image modality across study data.
Figure 7.
Mapping perivascular space (PVS). (a) an example of PVS segmentation using the Frangi filter with the optimum threshold. (b) Comparison of automated segmentation when T1w, T2w, and EPC were used as the input. Supplementary Video 1 shows a 3D view of the PVS mask obtained from EPC. Yellow arrows show voxels with an artifact (which could be Gibbs ringing and/or internal gradient artifact). Given the inverse signature of this artifact in relation to PVS in both T2w and EPC, the PVS identification was unaffected.
Evaluation 4: test-retest reliability of automated quantification
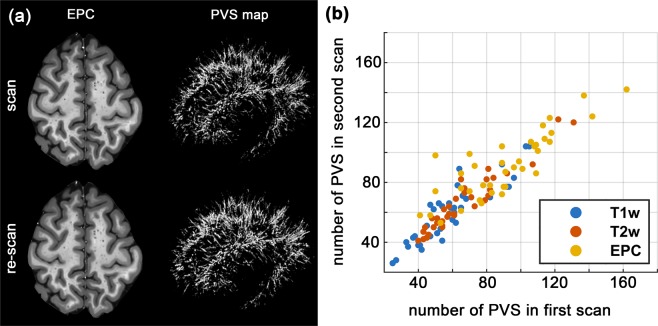
Excellent test-retest reliability was observed in PVS automated quantification regardless of the input image used (Fig. 8 and Table 1). Same thresholds, optimized on different subjects, were used for scan-rescan data. Lin’ concordance coefficient between scan-rescan PVS measurements were 0.89, 0.94 and 0.83 for T1w, T2w and EPC, respectively. T2w images showed the highest concordance compared to other inputs. PVS measures were significantly correlated between scan-rescan images (r = 0.90, p = 2.8e-14, r = 0.95, p = 1.4e-20, and r = 0.85, p = 2.8e-11 for T1w, T2w and EPC, respectively). For all three inputs, no difference between the number of PVS in scan and rescan was observed.
Figure 8.
Automated PVS quantification reliability assessment using scan-rescan data. (a) An example of the scan-rescan maps of the enhanced PVS contrast (EPC) and the PVS mask obtained from the same subject. (b) The graph shows the total number of automatically counted PVS across subjects on the scan-rescan data, obtained from different inputs.
Table 1.
Inter-class correlation (ICC) statistics of scan-rescan experiment for automated quantification of perivascular space (PVS), from T1w, T2w and enhanced PVS contrast (EPC) images.
| Input image | ICC | 95% CI | 95% CI | F score | p-value |
|---|---|---|---|---|---|
| lower bound | upper bound | ||||
| T1w | 0.94 | 0.89 | 0.97 | 18.04 | 7.8e-15 |
| T2w | 0.97 | 0.95 | 0.99 | 38.49 | 0 |
| EPC | 0.90 | 0.81 | 0.95 | 10.31 | 6.3e-11 |
Discussion
In this article, we presented a combined T1w-T2w approach to enhance the visibility of the PVS. EPC was utilized for both expert and computer-aided readings and was evaluated qualitatively and quantitatively. The proposed map (EPC) enhances the contrast and improves the conspicuity of the PVS, resulting in detection of a significantly larger number of PVS identified by expert readers. EPC benefits from the inverse signal profile of fluid on T1w and T2w images: when these images are combined together, a magnified PVS-tissue contrast can be obtained. EPC also uses a spatial non-local mean filtering technique, which has shown to be effective for mapping PVS19. We noted that even in the high-resolution T2w images of the human connectome project (0.7 mm3 resolution), it is difficult to detect small PVS (Supplementary Fig. 2), while they could be identified with this new technique.
According to the current standard visual rating scale for PVS43, most of the subjects in this cohort belonged to the class with the highest amount of PVS (category 4: >40 PVS). We noted that >80% of subjects on T2 are categorized as having a PVS class 3 (>50%) or 4 (>30%) according to the rating scale. Moreover, the inter-subject variability of PVS was large (standard deviation of ~15), despite the fact that subjects are all young healthy adults. This highlights the fact that the current rating approach has inherent limitations, because (1) a counting approach is highly dependent on the image resolution and quality and is difficult to generalize, (2) dichotomizing the PVS count reduces the statistical power and could underestimate the extent of variation, because considerable variability may be absorbed within each group62, (3) it does not consider the morphometric and spatial information of the PVS. In order to detect the intra- and inter-subject PVS alteration and ultimately to determine the role of PVS in different pathologies, there is a need to improve the current imaging and rating techniques.
With the advancement of the MRI technology, structural imaging in submillimeter resolution is achievable in a plausible time frame; for example, T1w MRI with 0.7 mm3 resolution can be obtained in 8 minutes at 3T63. Such imaging resolution enables to visualize PVS that were otherwise not apparent due to partial volume effect. With the added visibility of PVS comes the challenge of counting and mapping, as the visual rating becomes extremely laborious. Here we presented a pipeline that can be used to automatically map PVS.
The scan-rescan experiment showed that EPC is highly reliable, with no observed statistical difference across scan-rescan results. A trivial difference between scan-rescan PVS maps was observed, which are most likely due to (1) segmentation imperfection and image intensity differences of scan-rescan signal (e.g. due to subject motion)64,65, (2) normal physiological changes of PVS in the same subject, such as potential effects of time-of-day, sleep, and hydration on morphometric estimates of PVS66–69. It should also be noted that the preprocessing could affect the presence of the PVS (e.g. transformation of the MRI to a common space). Here we analyzed the data in the subject space, in which the MRI were AC-PC aligned using spline interpolation during the preprocessing and artifact correction steps36. In addition, T1w and T2w were co-registered, which also involves interpolation. These interpolations could affect PVS quantification. We noted that the automated PVS count was slightly higher in raw T2w images compared to the AC-PC aligned T2w images if the same threshold is used (the number of PVS was on average 1.1 higher in raw images compare to the aligned images, but not statistically significant p > 0.05). The optimum threshold, which depends on the quality of the data, therefore should be optimized based on the study data.
Whether PVS quantification is done by a neuroradiologist or automatically, an image with high PVS-tissue contrast is ideal. Currently, the modality of choice for PVS analysis is T2w, because it offers a higher contrast of PVS-tissue compared to T1w24. Yet, small PVS (<image resolution) are difficult to detect or separate from noise. Hence, PVS quantification is often limited only to enlarged PVS, despite the fact that physiological or pathological changes are expected to initiate in submillimeter scale70,71. In order to improve the mapping of the PVS, the MRI contrast of the PVS and the neighboring parenchyma should be increased. Besides the image processing approaches, PVS contrast can be enhanced through MRI technological improvement such as optimizing imaging sequence24 and employing ultra-high field technology19,24,25,72.
Our quantitative PVS mapping and previous works showed that PVS can be mapped from an individual MRI contrast15–25. However, it should be noted that in the presence of pathology, additional image sequences (e.g. FLAIR) can be useful to discern PVS from pathological changes, such as white matter hyperintensities (WMH). Another advantage of a multi-modal approach for PVS quantification is the improvement of misclassification. For instance, vessels not surrounded by PVS are not easily distinguishable from vessels with PVS if only T1w is used, because both appear hypointense in this modality. T2w and EPC are able to solve this issue: in fact, in the absence of PVS, vessels appear hypointense in T2w and hyperintense in EPC, unlike vessels with PVS, which appear hyperintense in T2w and hypointense in EPC (see Supplementary Fig. 4). In addition, the correct identification of PVS can be achieved via the analysis of its morphometric characteristics, including size, shape, and anatomical location. Ballerini et al., for example, argued that Frangi filter ensures specificity in PVS segmentation given the tubular structure of the PVS.
It should also be noted that many current projects (e.g. human connectome project35) already acquire both T1w and T2w modalities. Therefore, a technique that could benefit from the existing data could be valuable. We showed that in the presence of T1w and T2w, the combined contrast proved to enhance PVS visibility, which is of high clinical reading value. We did not aim to convey the message that one has to acquire both modalities to be able to resolve PVS. In fact, we noted that the automated segmentation was slightly less stable when EPC was used compared to T1w or T2w automated segmentation.
Two recent studies have also used multi-modal techniques for PVS segmentation and showed that it outperformed segmentation derived from a single modality15,20. Ballerini et al. applied segmentation on each modality and combined segmentations outputs using an AND operation. Boespflug et al. applied multivariate clustering, followed by morphometric filtering, to extract PVS from T1w, T2w, FLAIR and proton density images. It should be noted that the aim of these techniques was to improve the accuracy of the automated segmentation, but our study primarily aimed to propose a map that improves the visibility and detectability of the PVS, which can also make the visual scoring more accurate. Enhancement of PVS was also proposed using Haar transformation19 and more recently using conventional neural network73, both on T2w images acquired using 7T MRI. Our approach focuses on enhancing the contrast of the PVS by combining T1w and T2w images and was optimized for 3T MRI, which is more accessible in comparison with 7T MRI. Regardless of the differences, we anticipate that EPC could be used as an input to aforementioned techniques. Here we also performed test-retest comparison to analyze the reliability of PVS automated quantification.
In addition to its potential clinical relevance, mapping PVS can be useful to improve the accuracy of other quantitative MRI techniques as well, because these could be affected by the partial presence of PVS in image voxels. Recently, ignoring PVS could systematically affect how quantitative MRI measures such as diffusion tensor imaging (DTI) and spin echo dynamic susceptibility contrast (DSC) measures can be interpreted74,75. Such contribution and its potential confounding effect may be ameliorated if PVS is mapped and/or included in the analysis.
A limitation of multi-modal combination techniques is that it requires additional scan time and therefore is more prone to subject motion, which could negatively affect the co-registration. An interleaved acquisition was shown to be highly effective to ameliorate the co-registration issue29. Another limitation of EPC is that it requires the same image resolution for T1w and T2w. These sequences are often acquired in different resolutions, particularly in clinical practices (T2w are often acquired with thicker axial slices). Future investigations could focus on determining the extent to which the resolution difference between T1w and T2w affects the EPC quality and whether an intra-subject co-registration could amend this limitation.
A limitation of the automated quantification approach is that its performance depends on the parcellation accuracy. Imperfection of the brain parcellation could affect the automated quantification (see an example in Supplementary Fig. 1). While false positive PVS in periventricular area could be removed by applying a dilated mask of the ventricles, the false negative PVS in the superficial area of the white matter are more challenging to remove. While superficial white matter missed PVS is not expected to affect the count, it could affect the volumetric estimates. Further efforts are required to explore the effect of brain parcellation on PVS mapping or to build computational tools that minimize the parcellation dependency.
Conclusions
Our combined T1w-T2w approach (EPC) has demonstrated to enhance the visibility of the PVS, resulting in improvement of PVS mapping. EPC allowed both the expert readers and the computer-aided algorithm to achieve a more accurate and precise quantification of PVS. This novel method, which can be easily applied to a number of MRI datasets, aims to overcome the limitations of current MRI sequences in PVS detection and quantitative analysis. This is relevant not only to better characterize the role of PVS when they are enlarged in pathological conditions, but especially to perform quantitative research on PVS when they are small, such as in physiological and prodromal states.
Supplementary information
Acknowledgements
This work was supported by NIH grants: 2P41EB015922-21, 1P01AG052350-01 and USC ADRC 5P50AG005142. The content is solely the responsibility of the authors and does not necessarily represent the official views of the NIH. HCP: Data were provided by the Human Connectome Project, WU-Minn Consortium (Principal Investigators: David Van Essen and Kamil Ugurbil; 1U54MH091657) funded by the 16 NIH Institutes and Centers that support the NIH Blueprint for Neuroscience Research; and by the McDonnell Center for Systems Neuroscience at Washington University.
Author Contributions
All co-authors carefully read the final text of this manuscript and made edits. F.S. performed the analysis and wrote the manuscript. G.B. and N.S. performed the visual clinical reading, provided critical feedback and aided interpretation. R.P.C. implemented the Frangi filter and provided analytical feedback. J.C. assisted with statistical analysis and optimization. M.L. provided feedback on clinical evaluation. A.W.T. provided feedback on data handling and informatics and to make sure reproducibility and reproduction.
Data Availability
We have used human connectome project (HCP) dataset, which is already available to researchers.
Competing Interests
The authors declare no competing interests.
Footnotes
Publisher’s note: Springer Nature remains neutral with regard to jurisdictional claims in published maps and institutional affiliations.
Supplementary information
Supplementary information accompanies this paper at 10.1038/s41598-019-48910-x.
References
- 1.Cavallari M, et al. Evaluating the Association between Enlarged Perivascular Spaces and Disease Worsening in Multiple Sclerosis. J. Neuroimaging. 2018;28:273–277. doi: 10.1111/jon.12490. [DOI] [PubMed] [Google Scholar]
- 2.Brown Rosalind, Benveniste Helene, Black Sandra E, Charpak Serge, Dichgans Martin, Joutel Anne, Nedergaard Maiken, Smith Kenneth J, Zlokovic Berislav V, Wardlaw Joanna M. Understanding the role of the perivascular space in cerebral small vessel disease. Cardiovascular Research. 2018;114(11):1462–1473. doi: 10.1093/cvr/cvy113. [DOI] [PMC free article] [PubMed] [Google Scholar]
- 3.Laveskog, A., Wang, R., Bronge, L., Wahlund, L.-O. & Qiu, C. Perivascular Spaces in Old Age: Assessment, Distribution, and Correlation with White Matter Hyperintensities. Am. J. Neuroradiol. 39, 70 LP–76 (2018). [DOI] [PMC free article] [PubMed]
- 4.Park L, et al. Brain Perivascular Macrophages Initiate the Neurovascular Dysfunction of Alzheimer Abeta Peptides. Circ. Res. 2017;121:258–269. doi: 10.1161/CIRCRESAHA.117.311054. [DOI] [PMC free article] [PubMed] [Google Scholar]
- 5.Kalaria RN. The pathology and pathophysiology of vascular dementia. Neuropharmacology. 2018;134:226–239. doi: 10.1016/j.neuropharm.2017.12.030. [DOI] [PubMed] [Google Scholar]
- 6.Bacyinski A, Xu M, Wang W, Hu J. The Paravascular Pathway for Brain Waste Clearance: Current Understanding, Significance and Controversy. Front. Neuroanat. 2017;11:101. doi: 10.3389/fnana.2017.00101. [DOI] [PMC free article] [PubMed] [Google Scholar]
- 7.Feldman RE, et al. Quantification of perivascular spaces at 7T: A potential MRI biomarker for epilepsy. Seizure. 2018;54:11–18. doi: 10.1016/j.seizure.2017.11.004. [DOI] [PMC free article] [PubMed] [Google Scholar]
- 8.Banerjee G, et al. MRI-visible perivascular space location is associated with Alzheimer’s disease independently of amyloid burden. Brain. 2017;140:1107–1116. doi: 10.1093/brain/awx003. [DOI] [PubMed] [Google Scholar]
- 9.Krueger M, Bechmann I. CNS pericytes: concepts, misconceptions, and a way out. Glia. 2010;58:1–10. doi: 10.1002/glia.20898. [DOI] [PubMed] [Google Scholar]
- 10.Rasmussen MK, Mestre H, Nedergaard M. The glymphatic pathway in neurological disorders. Lancet Neurol. 2018;17:1016–1024. doi: 10.1016/S1474-4422(18)30318-1. [DOI] [PMC free article] [PubMed] [Google Scholar]
- 11.Tarasoff-Conway JM, et al. Clearance systems in the brain—implications for Alzheimer disease. Nat. Rev. Neurol. 2015;11:457. doi: 10.1038/nrneurol.2015.119. [DOI] [PMC free article] [PubMed] [Google Scholar]
- 12.Iliff JJ, et al. Cerebral arterial pulsation drives paravascular CSF–interstitial fluid exchange in the murine brain. J. Neurosci. 2013;33:18190–18199. doi: 10.1523/JNEUROSCI.1592-13.2013. [DOI] [PMC free article] [PubMed] [Google Scholar]
- 13.Iliff JJ, et al. A paravascular pathway facilitates CSF flow through the brain parenchyma and the clearance of interstitial solutes, including amyloid β. Sci. Transl. Med. 2012;4:1–11. doi: 10.1126/scitranslmed.3003748. [DOI] [PMC free article] [PubMed] [Google Scholar]
- 14.Wardlaw JM, et al. Neuroimaging standards for research into small vessel disease and its contribution to ageing and neurodegeneration. Lancet Neurol. 2013;12:822–838. doi: 10.1016/S1474-4422(13)70124-8. [DOI] [PMC free article] [PubMed] [Google Scholar]
- 15.Boespflug EL, et al. MR Imaging–based Multimodal Autoidentification of Perivascular Spaces (mMAPS): Automated Morphologic Segmentation of Enlarged Perivascular Spaces at Clinical Field Strength. Radiology. 2018;286:632–642. doi: 10.1148/radiol.2017170205. [DOI] [PMC free article] [PubMed] [Google Scholar]
- 16.Jung, E., Zong, X., Lin, W., Shen, D. & Park, S. H. PRedictive Intelligence in MEdicine. In International Workshop on PRedictive Intelligence In MEdicine11121, 18–25 (Springer, 201o8).
- 17.Ramirez J, et al. Visible Virchow-Robin spaces on magnetic resonance imaging of Alzheimer’s disease patients and normal elderly from the Sunnybrook dementia study. J. Alzheimer’s Dis. 2015;43:415–424. doi: 10.3233/JAD-132528. [DOI] [PubMed] [Google Scholar]
- 18.Wang X, et al. Development and initial evaluation of a semi-automatic approach to assess perivascular spaces on conventional magnetic resonance images. J. Neurosci. Methods. 2016;257:34–44. doi: 10.1016/j.jneumeth.2015.09.010. [DOI] [PMC free article] [PubMed] [Google Scholar]
- 19.Hou Y, et al. Enhancement of Perivascular Spaces in 7 T MR Image using Haar Transform of Non-local Cubes and Block-matching Filtering. Sci. Rep. 2017;7:1–12. doi: 10.1038/s41598-016-0028-x. [DOI] [PMC free article] [PubMed] [Google Scholar]
- 20.Ballerini L, et al. Perivascular Spaces Segmentation in. Brain MRI Using Optimal 3D Filtering. Sci. Rep. 2018;8:1–11. doi: 10.1038/s41598-018-19781-5. [DOI] [PMC free article] [PubMed] [Google Scholar]
- 21.Comulada WS. Model specification and bootstrapping for multiply imputed data: An application to count models for the frequency of alcohol use. Stata J. 2015;15:833–844. doi: 10.1177/1536867X1501500315. [DOI] [PMC free article] [PubMed] [Google Scholar]
- 22.Valdes Hernandez DC, et al. Towards the automatic computational assessment of enlarged perivascular spaces on brain magnetic resonance images: A systematic review. J. Magn. Reson. Imaging. 2013;38:774–785. doi: 10.1002/jmri.24047. [DOI] [PubMed] [Google Scholar]
- 23.Descombes X, Kruggel F, Wollny G, Gertz HJ. An Object-Based Approach for Detecting Small Brain Lesions: Application to Virchow-Robin Spaces. IEEE Trans. Med. Imaging. 2004;23:246–255. doi: 10.1109/TMI.2003.823061. [DOI] [PubMed] [Google Scholar]
- 24.Zong X, Park SH, Shen D, Lin W. Visualization of perivascular spaces in the human brain at 7T: Sequence optimization and morphology characterization. Neuroimage. 2016;125:895–902. doi: 10.1016/j.neuroimage.2015.10.078. [DOI] [PubMed] [Google Scholar]
- 25.Park SH, Zong X, Gao Y, Lin W, Shen D. Segmentation of perivascular spaces in 7 T MR image using auto-context model with orientation-normalized features. Neuroimage. 2016;134:223–235. doi: 10.1016/j.neuroimage.2016.03.076. [DOI] [PMC free article] [PubMed] [Google Scholar]
- 26.Frangi Alejandro F., Niessen Wiro J., Vincken Koen L., Viergever Max A. Medical Image Computing and Computer-Assisted Intervention — MICCAI’98. Berlin, Heidelberg: Springer Berlin Heidelberg; 1998. Multiscale vessel enhancement filtering; pp. 130–137. [Google Scholar]
- 27.Dubost F, et al. Enlarged perivascular spaces in brain MRI: Automated quantification in four regions. Neuroimage. 2018;185:534–544. doi: 10.1016/j.neuroimage.2018.10.026. [DOI] [PubMed] [Google Scholar]
- 28.Dubost F, et al. 3D regression neural network for the quantification of enlarged perivascular spaces in brain MRI. Med. Image Anal. 2019;51:89–100. doi: 10.1016/j.media.2018.10.008. [DOI] [PubMed] [Google Scholar]
- 29.Van de Moortele P-F, et al. T1 weighted brain images at 7 Tesla unbiased for Proton Density, T2⁎ contrast and RF coil receive B1 sensitivity with simultaneous vessel visualization. Neuroimage. 2009;46:432–446. doi: 10.1016/j.neuroimage.2009.02.009. [DOI] [PMC free article] [PubMed] [Google Scholar]
- 30.Glasser MF, Van Essen DC. Mapping Human Cortical Areas In Vivo Based on Myelin Content as Revealed by T1- and T2-Weighted MRI. J. Neurosci. 2011;31:11597–11616. doi: 10.1523/JNEUROSCI.2180-11.2011. [DOI] [PMC free article] [PubMed] [Google Scholar]
- 31.Rowley, C. D. et al. Assessing intracortical myelin in the living human brain using myelinated cortical thickness. Front. Neurosci. 9 (2015). [DOI] [PMC free article] [PubMed]
- 32.Viviani R, Stöcker T, Stingl JC. Multimodal FLAIR/MPRAGE segmentation of cerebral cortex and cortical myelin. Neuroimage. 2017;152:130–141. doi: 10.1016/j.neuroimage.2017.02.054. [DOI] [PubMed] [Google Scholar]
- 33.Misaki M, et al. Contrast enhancement by combining T1- and T2-weighted structural brain MR Images. Magn. Reson. Med. 2014;74:1609–1620. doi: 10.1002/mrm.25560. [DOI] [PMC free article] [PubMed] [Google Scholar]
- 34.Wiggermann, V., Hernández-Torres, E., Traboulsee, A., Li, D. K. B. & Rauscher, A. FLAIR<sup>2</sup>: A Combination of FLAIR and T2 for Improved MS Lesion Detection. Am. J. Neuroradiol. 37, 259 LP–265 (2016). [DOI] [PMC free article] [PubMed]
- 35.Essen DCV, et al. NeuroImage The WU-Minn Human Connectome Project: An overview. Neuroimage. 2013;80:62–79. doi: 10.1016/j.neuroimage.2013.05.041. [DOI] [PMC free article] [PubMed] [Google Scholar]
- 36.Glasser MF, et al. The minimal preprocessing pipelines for the Human Connectome Project. Neuroimage. 2013;80:105–124. doi: 10.1016/j.neuroimage.2013.04.127. [DOI] [PMC free article] [PubMed] [Google Scholar]
- 37.Sotiropoulos SN, et al. Advances in diffusion MRI acquisition and processing in the Human Connectome Project. Neuroimage. 2013;80:125–143. doi: 10.1016/j.neuroimage.2013.05.057. [DOI] [PMC free article] [PubMed] [Google Scholar]
- 38.Milchenko M, Marcus D. Obscuring surface anatomy in volumetric imaging data. Neuroinformatics. 2013;11:65–75. doi: 10.1007/s12021-012-9160-3. [DOI] [PMC free article] [PubMed] [Google Scholar]
- 39.Jenkinson M, Beckmann CF, Behrens TEJ, Woolrich MW, Smith SM. FSL. Neuroimage. 2012;62:782–790. doi: 10.1016/j.neuroimage.2011.09.015. [DOI] [PubMed] [Google Scholar]
- 40.Fischl B. FreeSurfer. Neuroimage. 2012;62:774–781. doi: 10.1016/j.neuroimage.2012.01.021. [DOI] [PMC free article] [PubMed] [Google Scholar]
- 41.Manjón JV, Coupé P, Martí‐Bonmatí L, Collins DL, Robles M. Adaptive non‐local means denoising of MR images with spatially varying noise levels. J. Magn. Reson. Imaging. 2010;31:192–203. doi: 10.1002/jmri.22003. [DOI] [PubMed] [Google Scholar]
- 42.Wiest-Daesslé, N., Prima, S., Coupé, P., Morrissey, S. P. & Barillot, C. Rician noise removal by non-local means filtering for low signal-to-noise ratio MRI: Applications to DT-MRI. In Lecture Notes in Computer Science (including subseries Lecture Notes in Artificial Intelligence and Lecture Notes in Bioinformatics), 10.1007/978-3-540-85990-1-21 (2008). [DOI] [PMC free article] [PubMed]
- 43.Potter GM, Chappell FM, Morris Z, Wardlaw JM. Cerebral perivascular spaces visible on magnetic resonance imaging: development of a qualitative rating scale and its observer reliability. Cerebrovasc. Dis. 2015;39:224–31. doi: 10.1159/000375153. [DOI] [PMC free article] [PubMed] [Google Scholar]
- 44.Lin LI. A concordance correlation coefficient to evaluate reproducibility. Intelligent Signal Processing and Communication Systems, 2007. ISPACS 2007. International Symposium on. 1989;45:2255. [PubMed] [Google Scholar]
- 45.Koo TK, Li MY. A Guideline of Selecting and Reporting Intraclass Correlation Coefficients for Reliability Research. J. Chiropr. Med. 2016;15:155–163. doi: 10.1016/j.jcm.2016.02.012. [DOI] [PMC free article] [PubMed] [Google Scholar]
- 46.Fischl B, et al. Automatically Parcellating the Human Cerebral Cortex. Cereb. Cortex. 2004;14:11–22. doi: 10.1093/cercor/bhg087. [DOI] [PubMed] [Google Scholar]
- 47.Fischl B, et al. Sequence-independent segmentation of magnetic resonance images. Neuroimage. 2004;23:S69–S84. doi: 10.1016/j.neuroimage.2004.07.016. [DOI] [PubMed] [Google Scholar]
- 48.Desikan RS, et al. An automated labeling system for subdividing the human cerebral cortex on MRI scans into gyral based regions of interest. Neuroimage. 2006;31:968–980. doi: 10.1016/j.neuroimage.2006.01.021. [DOI] [PubMed] [Google Scholar]
- 49.Fischl, B. & Dale, A. M. Measuring the thickness of the human cerebral cortex from magnetic resonance images. Proc. Natl. Acad. Sci. 97, 11050 LP–11055 (2000). [DOI] [PMC free article] [PubMed]
- 50.Sled JG, Zijdenbos AP, Evans AC. A nonparametric method for automatic correction of intensity nonuniformity in MRI data. IEEE Trans. Med. Imaging. 1998;17:87–97. doi: 10.1109/42.668698. [DOI] [PubMed] [Google Scholar]
- 51.Waters, A. B., Mace, R. A. & Sawyer, K. S. Identifying errors in Freesurfer automated skull stripping and the incremental utility of manual intervention (2018). [DOI] [PubMed]
- 52.Segonne F, et al. A hybrid approach to the skull stripping problem in MRI. Neuroimage. 2004;22:1060–1075. doi: 10.1016/j.neuroimage.2004.03.032. [DOI] [PubMed] [Google Scholar]
- 53.Dale AM, Fischl B, Sereno MI. Cortical surface-based analysis: I. Segmentation and surface reconstruction. Neuroimage. 1999;9:179–194. doi: 10.1006/nimg.1998.0395. [DOI] [PubMed] [Google Scholar]
- 54.Fischl B, Sereno MI, Dale A. Cortical Surface-Based Analysis: II: Inflation, Flattening, and a Surface-Based Coordinate System. Neuroimage. 1999;9:195–207. doi: 10.1006/nimg.1998.0396. [DOI] [PubMed] [Google Scholar]
- 55.Segonne F, Pacheco J, Fischl B. Geometrically accurate topology-correction of cortical surfaces using nonseparating loops. IEEE Trans Med Imaging. 2007;26:518–529. doi: 10.1109/TMI.2006.887364. [DOI] [PubMed] [Google Scholar]
- 56.Reuter M, Rosas HD, Fischl B. Highly Accurate Inverse Consistent Registration: A Robust Approach. Neuroimage. 2010;53:1181–1196. doi: 10.1016/j.neuroimage.2010.07.020. [DOI] [PMC free article] [PubMed] [Google Scholar]
- 57.Reuter M, Fischl B. Avoiding Asymmetry-Induced Bias in Longitudinal Image Processing. Neuroimage. 2011;57:19–21. doi: 10.1016/j.neuroimage.2011.02.076. [DOI] [PMC free article] [PubMed] [Google Scholar]
- 58.Reuter M, Schmansky NJ, Rosas HD, Fischl B. Within-Subject Template Estimation for Unbiased Longitudinal Image Analysis. Neuroimage. 2012;61:1402–1418. doi: 10.1016/j.neuroimage.2012.02.084. [DOI] [PMC free article] [PubMed] [Google Scholar]
- 59.Fischl B, et al. Whole brain segmentation: automated labeling of neuroanatomical structures in the human brain. Neuron. 2002;33:341–355. doi: 10.1016/S0896-6273(02)00569-X. [DOI] [PubMed] [Google Scholar]
- 60.Avants BB, Tustison NJ, Wu J, Cook PA, Gee JC. An open source multivariate framework for n-tissue segmentation with evaluation on public data. Neuroinformatics. 2011;9:381–400. doi: 10.1007/s12021-011-9109-y. [DOI] [PMC free article] [PubMed] [Google Scholar]
- 61.Cabeen, R. P., Laidlaw, D. H. & Toga, A. W. Quantitative Imaging Toolkit: Software for Interactive 3D Visualization, Data Exploration, and Computational Analysis of Neuroimaging Datasets. In ISMRM-ESMRMB Abstracts 12–14 (2018).
- 62.Altman DG, Royston P. The cost of dichotomising continuous variables. BMJ. 2006;332:1080. doi: 10.1136/bmj.332.7549.1080. [DOI] [PMC free article] [PubMed] [Google Scholar]
- 63.Van Essen DC, et al. The Human Connectome Project: a data acquisition perspective. Neuroimage. 2012;62:2222–2231. doi: 10.1016/j.neuroimage.2012.02.018. [DOI] [PMC free article] [PubMed] [Google Scholar]
- 64.Madan CR, Kensinger EA. Test–retest reliability of brain morphology estimates. Brain informatics. 2017;4:107–121. doi: 10.1007/s40708-016-0060-4. [DOI] [PMC free article] [PubMed] [Google Scholar]
- 65.Reuter M, et al. Head motion during MRI acquisition reduces gray matter volume and thickness estimates. Neuroimage. 2015;107:107–115. doi: 10.1016/j.neuroimage.2014.12.006. [DOI] [PMC free article] [PubMed] [Google Scholar]
- 66.Trefler A, et al. Impact of time-of-day on brain morphometric measures derived from T 1-weighted magnetic resonance imaging. Neuroimage. 2016;133:41–52. doi: 10.1016/j.neuroimage.2016.02.034. [DOI] [PMC free article] [PubMed] [Google Scholar]
- 67.Dickson JM, et al. The effects of dehydration on brain volume-preliminary results. Int. J. Sports Med. 2005;26:481–485. doi: 10.1055/s-2004-821318. [DOI] [PubMed] [Google Scholar]
- 68.Kempton MJ, et al. Effects of acute dehydration on brain morphology in healthy humans. Hum. Brain Mapp. 2009;30:291–298. doi: 10.1002/hbm.20500. [DOI] [PMC free article] [PubMed] [Google Scholar]
- 69.Berezuk C, et al. Virchow-Robin spaces: correlations with polysomnography-derived sleep parameters. Sleep. 2015;38:853–858. doi: 10.5665/sleep.4726. [DOI] [PMC free article] [PubMed] [Google Scholar]
- 70.Shi Yulu, Wardlaw Joanna M. Update on cerebral small vessel disease: a dynamic whole-brain disease. BMJ. 2016;1(3):83–92. doi: 10.1136/svn-2016-000035. [DOI] [PMC free article] [PubMed] [Google Scholar]
- 71.Horsburgh, K. et al. Small vessels, dementia and chronic diseases – molecular mechanisms and pathophysiology. 851–868 (2018). [DOI] [PMC free article] [PubMed]
- 72.Barisano G, et al. Clinical 7 T MRI: Are we there yet? A review about magnetic resonance imaging at ultra-high field. Br. J. Radiol. 2018;91:20180492. doi: 10.1259/bjr.20180492. [DOI] [PMC free article] [PubMed] [Google Scholar]
- 73.Jung E, et al. Enhancement of perivascular spaces using densely connected deep convolutional neural network. IEEE Access. 2019;7:18382–18391. doi: 10.1109/ACCESS.2019.2896911. [DOI] [PMC free article] [PubMed] [Google Scholar]
- 74.Sepehrband F, et al. Perivascular space fluid contributes to diffusion tensor imaging changes in white matter. Neuroimage. 2019;197:243–254. doi: 10.1016/j.neuroimage.2019.04.070. [DOI] [PMC free article] [PubMed] [Google Scholar]
- 75.Doucette Jonathan, Wei Luxi, Hernández-Torres Enedino, Kames Christian, Forkert Nils D., Aamand Rasmus, Lund Torben E., Hansen Brian, Rauscher Alexander. Rapid solution of the Bloch-Torrey equation in anisotropic tissue: Application to dynamic susceptibility contrast MRI of cerebral white matter. NeuroImage. 2019;185:198–207. doi: 10.1016/j.neuroimage.2018.10.035. [DOI] [PubMed] [Google Scholar]
Associated Data
This section collects any data citations, data availability statements, or supplementary materials included in this article.
Supplementary Materials
Data Availability Statement
We have used human connectome project (HCP) dataset, which is already available to researchers.


