Abstract
Identifying the modal parameters of structures located in ice-infested waters may be challenging due to the interaction between the ice and structure. In this study, both simulated data from a state-of-the-art ice–structure interaction model and measured data of ice–structure interaction were both used in conjunction with a covariance-driven stochastic subspace identification method to identify the modal parameters and their corresponding variances. The variances can be used to assign confidence to the identified eigenfrequencies, and effectively eliminate the eigenfrequencies with large variances. This enables a comparison between the identified eigenfrequencies for different ice conditions. Simulated data were used to assess the accuracy of the identified modal parameters during ice–structure interactions, and they were further used to guide the choice of parameters for the subspace identification when applied to measured data. The measured data consisted of 150 recordings of ice actions against the Norströmsgrund lighthouse in the Northern Baltic Sea. The results were sorted into groups defined by the observed ice conditions and governing ice failure mechanisms during the ice–structure interaction. The identified eigenfrequencies varied within each individual group and between the groups. Based on identified modal parameters, we suggested which eigenmodes play an active role in the interaction processes at the ice–structure interface and discussed the possible sources of errors.
This article is part of the theme issue ‘Environmental loading of heritage structures’.
Keywords: ice–structure interaction, system identification, subspace methods, uncertainty quantification
1. Introduction
The understanding of ice–structure interaction originates from observations and measurements of various ice features interacting with structures such as lighthouses, bridge piers and offshore structures. The monitoring of structural responses on platforms in Cook Inlet, Alaska, began more than 50 years ago [1]. It was soon discovered that ice forces varied depending on the ice conditions, and, therefore, the measurements of the structural response were often supplemented with measurements of physical and mechanical properties of the ice [2]. Despite the measurement complexity and cost, several full-scale monitoring campaigns in (sub-)Arctic areas were conducted in the past, many of which involved lighthouse structures [3,4]. Drifting ice against a structure may result in various modes of ice–structure interaction. Some of these are violent with ice forces and structural responses that represent a threat against the structural integrity, whereas other modes pose no concern at all. These modes depend on both the structure and the ice. Structures with sloped walls at the ice–structure interface typically promote a flexural type of ice failure, while vertically sided structures typically promote crushing failure. Thus, sloped-walled structures are subject to significantly lower ice forces than vertically sided structures, but they often incur a higher construction expense [5].
Ice forces on offshore structures have been debated for decades. Design engineers still find it challenging to determine consistent load estimates pertaining to the expected ice conditions. A study by Timco & Croasdale [6] demonstrated the difficulties in the year 2006 when they invited international experts to calculate the ice forces under some selected scenarios of a structure interacting with first-year level ice, first-year ridge and multi-year ice floes. Considerable scatter was presented for the different cases, up to a factor of 11 between the lowest and highest load estimates for a conical structure subject to level ice. Lighthouses are no exception in terms of the challenges faced in the design of offshore structures in ice-infested waters. After revisiting 69 lighthouses in the St Lawrence Waterway, Danys [7] found that many old lighthouses with design pressures in the range of 0.55–0.76 MPa were damaged, whereas structures with design pressures in the range 2.0–2.8 MPa were undamaged. A few lighthouses in the Baltic Sea, which had design loads in the latter range, were also damaged due to ice actions [5]. Many of the lighthouses were built with vertical walls at the ice–structure interface, allowing a greater risk for structural damage. In particular, narrow structures with a low aspect ratio (diameter of the structure at the waterline divided by the ice thickness) were noted to be vulnerable to damage, due to excessively low design pressures suggested by the standards [5,8]. Consequently, recent guidelines for the design of Arctic offshore structures were modified to account for the high ice pressures at low aspect ratios.
To this end, sensors and measurement techniques were developed to handle the harsh Arctic environment as lighthouses and oil platforms were instrumented. The aim was to mitigate ice forces on offshore structures. It was soon discovered that the structural integrity was threatened not only by the high ice forces, but also the severe ice-induced vibrations (IIVs) that followed from the dynamic ice actions [1]. IIV represents a threat in the form of low-cycle fatigue and illness of people exposed to the vibrations, and in a few cases, it was the primary cause of structural damage [1,4,9]. Although phenomenological models exist to predict IIV, i.e. as reported in [10,11], the origin of the vibrations is still under debate [12], and the ice conditions in which IIV occurs are still not entirely known. Single events of IIV can also pose a threat to the structural integrity. The most critical and famous IIV episode occurred in the Beaufort sea in 1986, when the 90 × 90 m wide oil platform Molikpaq encountered a multi-year ice floe [13], resulting in liquefaction of the soil foundation. As platforms have been deployed in ice-choked waters in regions such as Cook Inlet, Alaska, USA, and Bohai Sea, China, for decades, their remaining lifetimes decrease, making structural health monitoring (SHM) increasingly relevant.
On the massive Confederation Bridge, monitoring programmes were employed for assessing ice loads and SHM [14–16]. Simulated damage in conjunction with response measurements under different ambient loadings that included ice loads were used to evaluate the possibility for damage detection. On that particular structure, ice actions were considered as part of the environmental variability of modal parameters. The Confederation Bridge is a massive structure, and smaller structures may experience a higher influence of ice actions on the modal parameters. A limited number of studies have addressed the changes in modal parameters caused by different types of ice conditions and ice failure mechanisms; however, some experimental [17,18] and simulation studies [19] have indicated that added mass and damping may occur. It is, thus, unknown to what extent the size of the structure relative to the severity of the ice conditions causes system changes, e.g. changes in the eigenfrequency, damping and mode shapes, or the introduction of nonlinearities. It is also unknown for which ice conditions the true modal properties can be identified and when the underlying assumptions of the applied algorithms are violated the most.
Even though many arctic offshore structures are located in vulnerable areas where a structural failure may have fatal consequences for the environment, it is still unknown whether vibration-based SHM is feasible during the ice-covered months. This is relevant not only for hydrocarbon exploitation, but also for advancing the development of offshore wind power in cold climates. The null hypothesis is that the feasibility depends on the severity of the ice actions relative to the size of the structure, which was partly exploited in [20]. An automatic routine was applied to identify eigenfrequencies for data records considering various modes of ice–structure interaction occurring on the Norströmsgrund lighthouse. The identified frequencies were spread and only few time records rendered similar identified frequencies. The origin of both the bias errors and variance errors in the estimated modal parameters when using the covariance-driven reference-based stochastic subspace identification routine (SSI-cov/ref) was addressed [21]. It was shown how the bias error could partly be removed, whereas the variance error could only be estimated. A computationally efficient implementation was presented in [22], which is exploited in this study as a means to investigate the variability in the identified modal parameters for different ice conditions. The remaining paper is structured as follows: §2 explains some fundamentals of ice–structure interaction and ice forces on vertically sided structures; §3 presents a summary of the SSI-cov/ref algorithm used to identify the modal parameters; §4 presents the identified modal parameters and their uncertainties for simulated cases of ice–structure interaction; §5 presents the identified modal parameters and the corresponding uncertainties for 150 recordings of ice–structure interaction on the Norströmsgrund lighthouse; and finally, the concluding remarks are presented in §6.
2. Modes of ice–structure interaction
Several types of ice–structure interactions against vertically sided structures are considered in this study, and they are illustrated in figure 1. Readers are recommended to refer to [23] for an overview of the mechanics of ice–structure interaction and [24] for descriptions of the observed failure types against the Norströmsgrund lighthouse. Continuous brittle crushing (figure 1a) is governed by the non-simultaneous occurrence of so-called high-pressure zones across the ice–structure interface. The interaction process ongoing at the ice–structure interface also involves the occurrence of many modifications of the ice material, such as recrystallization and microcrack developments [23,25]. The bending type of flexural failure is often initiated by the development of a circumferential crack followed by radial cracks (figure 1b). Splitting failures (figure 1c) are usually observed when the interacting ice sheet has a low lateral confinement. The buckling type (figure 1d) of flexural failure is governed by a build-up of curvature in the ice sheet. Winds and waves as well as ice management can generate fields of broken ice (figure 1e) that cause small impacts from floes of various sizes onto the walls of the structure. The floes split and pass around the structure, while the wind and wave actions contribute significantly to the total force. The last interaction type considered in this study is creep, in which the ice floe rests against the structure. For simplicity, no distinction is made between limit force, when the driving forces are too low to generate any of the failure mechanisms mentioned above, and limit-stress creep deformation. Among these modes, ice crushing and creep exert the highest forces on the structure. The frequency contents of the ice forces vary substantially not only between the individual failure types but also within the same type of failure with different environmental parameters, see e.g. [20,26]. As ice forces cannot be described as Gaussian white noise, the following sections describe the assessment of the influence of violating the stochastic white noise input assumption for the SSI-cov/ref.
Figure 1.
Types of failure modes of ice–structure interaction (from Nord et al. [20]).
3. Estimation of modal parameters and their uncertainty
(a). System model
Consider the linear time-invariant system described by a discrete time state–space model
| 3.1 |
and
| 3.2 |
where is the state vector, is the input vector, is the measurement vector and and are the system matrices. Here, n is the model order and r is the number of sensors. The measurements are corrupted with the measurement error which is modelled as a white noise random process. The white noise random process is also used to model the input , which is unknown for many practical applications, and the state–space model is thus reduced to
| 3.3 |
and
| 3.4 |
where and are the process and output noise, respectively.
We aim to identify matrices A and C from which the modal frequencies, damping and mode shapes can be obtained. The eigenvalues and eigenvectors of the system in equations (3.3) and (3.4) become
| 3.5 |
and
| 3.6 |
from which the continuous time eigenvalues , eigenfrequencies and damping coefficients (in % of critical) can be obtained as follows:
| 3.7 |
where T is the sampling period.
(b). Stochastic subspace identification algorithm
In the following two sections, the covariance-driven SSI-cov/ref and the data-driven unweighted principal component (UPC) SSI algorithm are briefly introduced; but for thorough explanations, see [27]. Let r be the number of sensors, be the number of reference sensors, and p and q be the parameters chosen such that , where n is the model order. The algorithm uses the output data to build a subspace matrix which (for a sufficient number of samples) may be decomposed as
| 3.8 |
where is the observability matrix and matrix depends on the chosen subspace identification algorithm. The observability matrix is constructed from a singular value decomposition (SVD) of the subspace matrix , which is further truncated at a user-defined model order n
| 3.9 |
and
| 3.10 |
The C matrix can be directly extracted from the first block of r rows of the observability matrix , while the A matrix can be obtained from a least-squares solution of
| 3.11 |
where
(c). Estimate of the subspace matrix
‘Future’ and ‘past’ output data matrices are assembled from a total number of samples as follows:
| 3.12 |
where contains the reference sensor data. These data matrices are further normalized with respect to their numbers of columns, such that
| 3.13 |
From the data matrices, the covariance-driven subspace matrix is defined
| 3.14 |
while in the data-driven case, the subspace matrix is defined:
| 3.15 |
Alternatively, the data-driven subspace matrix can be estimated from the thin decomposition
| 3.16 |
from which , where and . Note that because of the orthogonal properties of , the observability matrix is estimated directly from in the implementation.
(d). Covariance estimate of the subspace matrix
Statistical uncertainty in the identified modal parameters may occur due to, e.g., non-white excitation of the system, a finite number of data samples, non-stationarity etc. which leads to variance errors in the modal parameters. In what follows, the covariance computation of the modal parameters is based upon an underlying covariance-driven SSI algorithm and propagation of first-order perturbations from the data to the modal parameters [21]. Full-scale validations of the method were presented in [28], while our study applies a computationally efficient implementation [22]. Reviews of existing methods for covariance estimation of identified modal parameters are presented in [28] and [29].
In the covariance-driven SSI, the covariance of the subspace matrix were calculated by first splitting and into blocks
| 3.17 |
where for simplicity, ; subsequently, the blocks were normalized according to the block length. From each data block in equation (3.17), the subspace matrix estimate is built with
| 3.18 |
and its covariance estimate reads as
| 3.19 |
(e). Covariance estimate of the modal parameters
The principle of the method is to propagate the covariance of the subspace matrix, , to the modal parameters through first-order perturbations. First-order perturbations of the subspace matrix H are first propagated to the system matrices A and C as follows:
| 3.20 |
where is the sensitivity matrix according to the definitions given in [21,28,30]. The covariance of the vectorized system matrices, , can be defined as
| 3.21 |
in which the covariance of the subspace matrix, , can be estimated by dividing the subspace matrix into blocks as described in the previous section and in [22]. The perturbations of the modal parameters can be described as functions of the vectorized system matrices as follows:
| 3.22 |
where the sensitivities , and are defined per mode i. Finally, the covariances of the modal parameters are obtained as
| 3.23 |
In this study, the implementation is performed in accordance with algorithm 4 presented in [22] which yields fast computations when multiple model orders are considered.
4. Modal parameter identification using simulated data of dynamic ice–structure interactions
Since ice forces have been measured by means of both inverse techniques and installations of force panels at the ice–structure interface, some knowledge exists concerning their appearance in time and frequency domains. The continuous brittle crushing process, which is one of the interaction types decisive for design loads, is described as a random process [31]. Non-simultaneous contact across the interface between the ice and structure that changes in space and time causes local pressures to vary across the interface [32]. This means that the force varies randomly superimposed to a mean level. The structure, in some cases, slows down the drifting ice floe(s), thereby influences the driving force(s); therefore, the mean level is seldom constant. The slow-varying processes of ice forces are also influenced by uneven ice thickness, stochastic variation of ice strength, and delayed elastic and viscous properties of the ice, in addition to the intermittent occurrences of other failure processes; all of these may contribute to a non-white forcing onto the structure.
In this study, a phenomenological ice–structure interaction model [19,33] is used to investigate the effect of variation in ice conditions on the identified modal parameters and their uncertainties. A Matlab implementation of the model, including a single degree-of-freedom structural representation in the modal domain, is available from Mendeley data [34]. The ice model is coupled to the modal characteristics of the Norströmsgrund lighthouse, extracted from the finite-element software Abaqus CAE.
The Norströmsgrund lighthouse (figure 2) is a gravity-based concrete structure located in the Gulf of Bothnia, Sweden. The lighthouse was constructed in 1971 and designed to withstand ice loads of 2.2 MN m−1. Below the mean water level, the main structure and foundation caisson are filled with sand. Eight concrete bulkheads stiffen the foundation frame, and a 0.7 m thick concrete foundation plate rests on a top layer of cement-grouted crushed stones and a lower layer of morainic soil. The wall thickness varies between 0.2 m at the top and 1.4 m at the mean water level. Service personnel visiting Norströmsgrund late in the winter of 1972 observed heavy vibrations due to ice actions. In 1973, thin cracks were detected in the most strained area of the superstructure walls close to the ground floor. Despite that the cracks pervaded through the wall and moisture intrusion was observed, it was concluded that the structural integrity remained intact [9].
Figure 2.
Illustration, picture and finite-element model of the Norströmsgrund lighthouse (from Nord et al. [26]). (Online version in colour.)
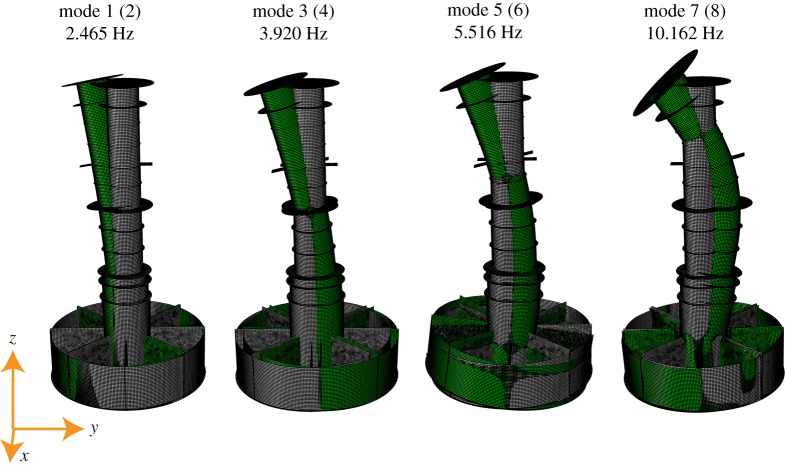
The finite-element model, modelled with quadrilateral finite membrane-strain shell elements with reduced integration (S4R), is displayed in figures 2 and 3. The structural dimensions and material properties are obtained from [35] and an elaborate description of the model can be found in [26]. Because the structure is near axisymmetric, structural modes occur in pairs with almost identical frequencies. Mode shape 1 (and 2) is governed by tilt of both the foundation caisson and tower substructure (tower below + 16.5 m), while the superstructure deflects in the tilt direction. For mode shape 3 (4), both the tower caisson and tower substructure displace in the opposite direction to the superstructure deflection. Mode shape 5 (6) has the same tilt of both the caisson and tower substructure as for mode shape 1, whereas the superstructure deflects in the opposite direction to the substructure tilt direction. In mode shape 7 (8), the foundation caisson tilts in the opposite direction to the tower substructure.
Figure 3.
Mode shapes and corresponding natural frequencies of the finite-element model (from Nord et al. [26]). (Online version in colour.)
The forces are treated as concentrated loads acting on a linear time-invariant structure that is represented by selected vibration eigenmodes
| 4.1 |
Here, is the vector of modal coordinates, and is the number of eigenmodes used to assemble the model. The ice force, , is specified to act on the desired location ‘Force N–S’ in figure 2 through the force influence matrix , where is the number of force time histories and is the number of degrees of freedom.
is the diagonal damping matrix populated on the diagonal with the terms , where and represent the natural frequency in radians per second and damping ratio corresponding to eigenmode j, respectively. is a diagonal matrix containing the natural frequencies , and is a matrix collecting the mass-normalized mode shapes. Rayleigh damping is assigned to the model with 2% in modes 1 and 2, increasing up to 20% in mode 24. The lowest four eigenfrequencies and corresponding damping ratios of the finite-element model are given in table 1, with the corresponding mode shapes displayed in figure 3. The axisymmetry of the model leads to mode pairs in the orthogonal directions, with each pair assigned identical damping values.
Table 1.
Modal properties of simulation model.
| mode 1 (2) | mode 3 (4) | mode 5 (6) | mode 7 (8) | |
|---|---|---|---|---|
| (Hz) | 2.465 | 3.920 | 5.516 | 10.162 |
| (%) | 2.000 | 2.005 | 2.367 | 3.642 |
Two time series, each of 600 s, were simulated using the ice model. The mean ice thickness and ice velocity were assumed to be 1 m and 0.1 m s−1, respectively. Time-dependent parameters in the ice model were used to generate time series with different ice conditions, herein categorized as slow-varying and fast-varying ice conditions (figure 4). Though the ice model is in essence nonlinear and dependent on the structural motion, the nonlinearity is considered insignificant at the high ice velocities considered in this work. Under these conditions, the time between contact and failure of a single ice element is short and consequently the motion of the structure is insignificant compared to the deformation of the ice element. At low ice-drift velocities, strongly nonlinear interactions commonly referred to as intermittent crushing and frequency lock-in, become prevalent and the presented approach is no longer applicable.
Figure 4.
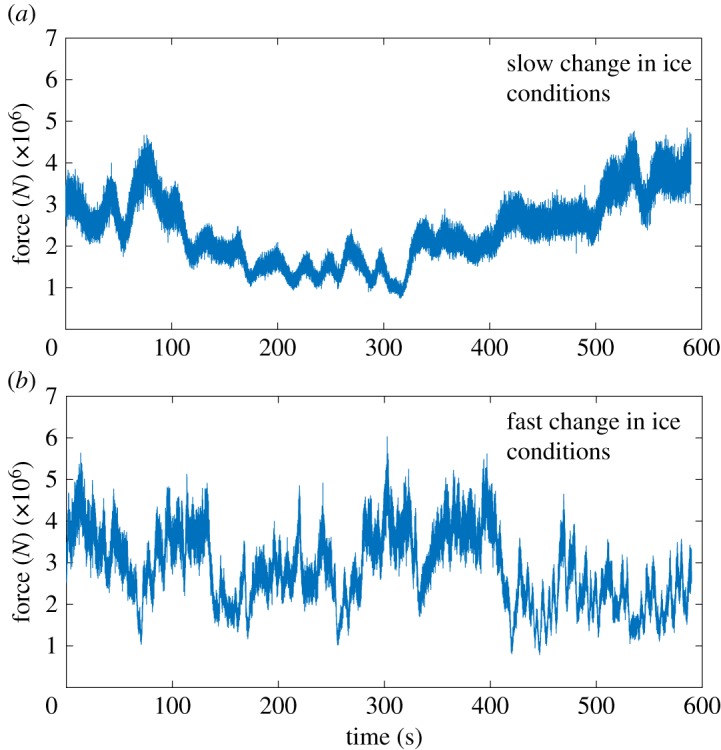
Simulated force time histories during interaction with slow-varying (a) and fast-varying (b) ice conditions. (Online version in colour.)
Four measurements of accelerations extracted at locations specified in figure 2 were used for the subspace identification (SSI-cov/ref), and throughout the paper, the number of reference sensors is set equal to the total number of sensors r = r0 = 4. This involved the same number of sensors with the same locations as installed on the lighthouse in the winters of years 2001–2003.
For comparison, a white noise force with an amplitude 0.3294 × 10⁶ N was applied to the same model and with accelerations extracted at the same locations as for the ice–structure interaction simulations. In the simulations, the system matrices A,B,C,D in equations (3.1) and (3.2) were assembled from the same modally reduced order finite-element model as described above, with forces acting in the same nodes and the sensors located at the same nodes. Section 2a in [26] describes in depth how the modal properties of the structure are used to assemble the system matrices A,B,C,D.
Recordings of 59 000 sample points were added 5% Gaussian white noise. The sampling frequency was 100 Hz, the number of blockrows was set as 100 and the number of blocks for the covariance of the subspace matrix, , was set as 60.
Tolerance deviances to frequency, damping and MAC-values, as well as the normalized standard deviation of the frequency, , were added into the stabilization diagram. A pole at order n was considered stable if the deviances in frequency, damping and normalized standard deviation of the frequency between a pole at order n and were less than 0.01, 0.05 and 0.05, respectively, and corresponding MAC-values exceeded 0.95. A routine was used to pick eigenmodes automatically from the stabilization diagrams. The poles were first sorted with increasing corresponding absolute values, and a user-defined frequency slack value, Sf, defined the range from which the poles were collected. From the eigenvectors of the poles in that range, MAC-values were calculated between all eigenvectors, and a reference eigenmode was selected as the pole that rendered the highest sum of MAC-values. The MAC-values between the reference eigenmode and the eigenvectors of the remaining poles in that frequency range (defined by Sf) must lie within a user-defined MAC-slack, SMAC to be further considered. The third acceptance criterion checked whether the poles that fulfilled the MAC-slack also fulfilled a damping slack, . Finally, the selected eigenmode contained the mean values of the frequency, damping, mode shape and their corresponding variances. Sf, and SMAC were chosen to be 0.02, 0.3 and 0.5, respectively.
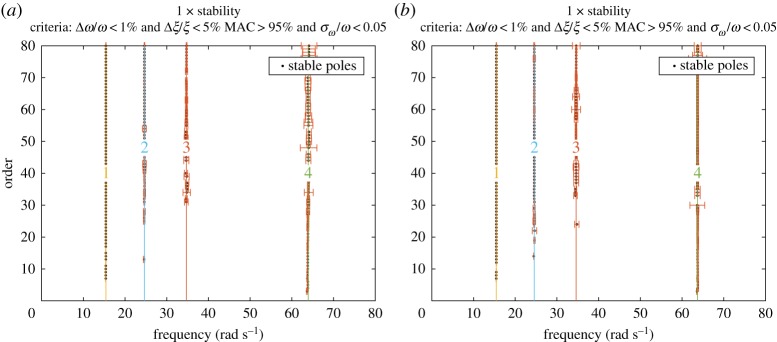
The stabilization diagrams in figure 5 show the first four identified eigenmodes, with the square root of the identified variance (standard deviation), , added to each pole in the diagram. Both the slow and fast-varying ice conditions rendered clear columns of stable poles, and the differences were noticeable mainly in the variance estimates. Table 2 presents the automatically selected eigenmodes' frequency, damping and corresponding standard deviations alongside with the absolute error between the identified and model frequencies. The results obtained from the time series of ice–structure interaction were compared with the results obtained from the time series with Gaussian white noise as the input. As expected, the Gaussian white noise input yielded more accurate frequency estimates than both the ice–structure interaction scenarios, while the fast-varying ice conditions appeared to render damping as accurate as in the case of the Gaussian white noise.
Figure 5.
Stabilization diagrams for (a) slow-varying ice conditions and (b) fast-varying ice conditions. (Online version in colour.)
Table 2.
Identified modal parameters (using SSI-cov/ref), standard deviations and absolute errors.
| identified eigenmodes | white noise | slow-varying ice conditions | fast-varying ice conditions |
|---|---|---|---|
| mode 1 | 2.465 ± 0.004/(0.000) | 2.454 ± 0.005/(0.011) | 2.462 ± 0.005/(0.003) |
| mode 2 | 3.923 ± 0.010/(0.003) | 3.925 ± 0.027/(0.005) | 3.909 ± 0.021/(0.011) |
| mode 3 | 5.517 ± 0.051/(0.001) | 5.527 ± 0.057/(0.011) | 5.505 ± 0.068/(0.011) |
| mode 4 | 10.148 ± 0.134/(0.014) | 10.173 ± 0.121/(0.011) | 10.140 ± 0.072/(0.022) |
| white noise | slow-varying ice conditions | fast-varying ice conditions | |
| mode 1 | 2.149 ± 0.193/(0.149) | 1.627 ± 0.215/(0.373) | 1.804 ± 0.211/(0.196) |
| mode 2 | 1.793 ± 0.266/(0.212) | 2.239 ± 0.653/(0.391) | 2.070 ± 0.619/(0.065) |
| mode 3 | 2.623 ± 0.726/(0.256) | 2.092 ± 0.837/(0.275) | 2.188 ± 0.867/(0.178) |
| mode 4 | 3.840 ± 0.961/(0.198) | 3.438 ± 0.975/(0.204) | 3.566 ± 0.635/(0.075) |
Since simulations with the ice model were computationally expensive, it was not feasible to check whether the point estimate of variances of the identified frequency and damping coincided with the sample statistics for multiple simulations. Instead, sample statistics were generated using Monte Carlo simulations as follows.
Continuous brittle crushing ice forces, , were generated by realization of a typical ice force spectrum from the Norströmsgrund lighthouse, , which was discretized using
| 4.2 |
where is the phase angle modelled as uniformly random between 0 and .
The ice forces were first obtained with a sampling frequency of 1660 Hz and further resampled down to 100 Hz (figure 6). The simulated acceleration time series was thereafter generated by using equations (3.1) and (3.2) by applying the ice force onto the ice-action point (cf. figure 2). In the simulations, the system matrices A,B,C,D were assembled from the same modally reduced order finite-element model as described previously. In total, 250 acceleration time series were simulated using ice forces.
Figure 6.
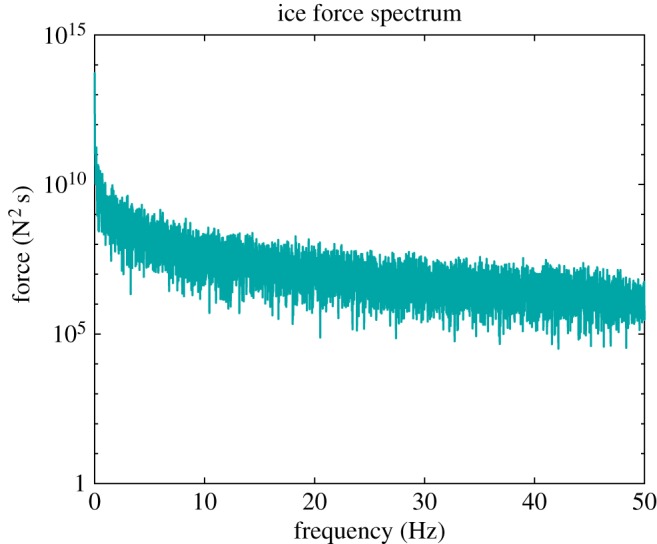
Ice force spectrum used for Monte Carlo simulations. (Online version in colour.)
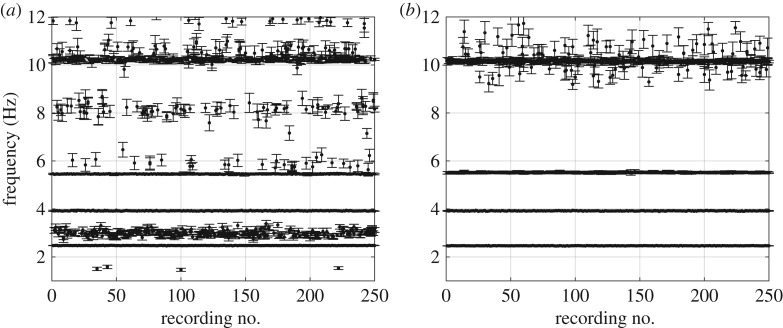
Five per cent Gaussian white measurement noise was added to the four acceleration signals, and all the settings for the SSI-cov/ref were identical to those in the abovementioned examples. For each identification, the first automatically identified eigenmodes in the frequency range 0–12 Hz with their corresponding damping and variances were stored. For the sake of further illustrations and result presentation, the standard deviations were calculated from the variances. Two hundred and fifty simulated time series with Gaussian white noise input with an amplitude of 0.3294 × 10⁶ N was used for comparison. The collection of identified frequencies during the ice–structure interactions shows the presence of spurious modes, spread out from the true eigenfrequency, most with larger standard deviations (figure 7). For simulations of ice–structure interactions, the sample standard deviations for the identified frequencies and damping ( and ) did not correspond to the mean values of the identified standard deviations ( and , table 3), a result which is significantly influenced by four spurious frequencies below 2 Hz (figure 7a). In the case of the simulations with Gaussian white noise, the sample standard deviations corresponded well with the identified standard deviations.
Figure 7.
Identified frequencies and their uncertainties for each simulation with (a) ice–structure interaction and (b) Gaussian white noise input. Each simulation contained N = 59 000 sample points.
Table 3.
Natural frequencies and damping ratios of the first identified eigenmode. and , mean values over 250 simulations; and , mean of the estimated standard deviations; and , sample standard deviation.
| mode | (Hz) | (%) | ||||
|---|---|---|---|---|---|---|
| mode 1 (ice–structure interaction) | 2.459 | 1.530 | ||||
| mode 1 (white noise input) | 2.465 | 2.047 | ||||
| mode 1 (ice–structure interaction) short time series | 2.433 | 1.859 | ||||
| mode 1 (white noise input) short time series | 2.464 | 2.004 |
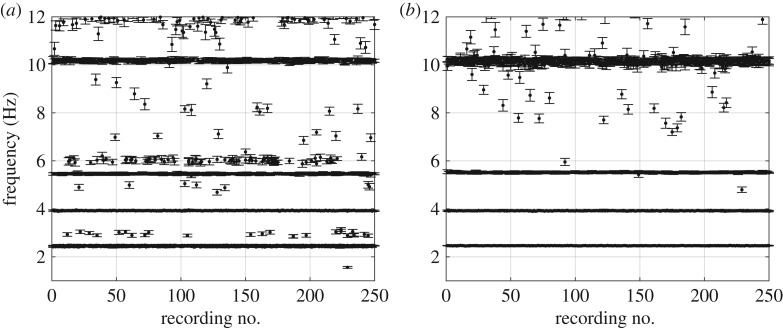
Until now, the simulated time series had a long duration. In the following section, we describe the analysis of the effects of having a short duration of time series and of resampling down to 30 Hz. The short duration resembles the nature of rapidly changing ice conditions, which vary by site. Because we aim to assess the identification of modal parameters for different ice conditions, the duration constraint is inevitable. Figure 7 shows that the variances of the identified frequencies for spurious modes were larger than those for the true eigenmodes; therefore, a tolerance value of the normalized standard deviation that could eliminate spurious modes and retain true eigenmodes was attempted to be determined. Each simulation had 17 800 sample points and 5% noise was added to each acceleration signal. The number of blockrows, number of blocks for the calculation of the variance of the subspace matrix, , and tolerance value for the stabilization criterion, , were changed to 30, 20 and 0.03, respectively. All other settings remained as described above. Figure 8 displays the identified eigenfrequencies and their estimated standard deviations for both simulations with ice–structure interaction and Gaussian white noise input. It was noted that some spurious modes remained in the identifications, some of them with standard deviations in frequency nearly as low as the standard deviations of true eigenfrequencies. Therefore, reducing the tolerance value, , further suppressed the correctly identified eigenfrequencies alongside the spurious frequencies. The eigenfrequencies were reasonably well identified during ice–structure interaction, whereas the ensemble statistics in table 3 (bottom two rows) show that neither the identified damping nor the mean of the estimated standard deviations, and , matched with the sample standard deviations and . These discrepancies may be explained by both the violation of stationary white noise excitation and the chosen slack values for the automatic mode selection routine.
Figure 8.
Identified frequencies and their uncertainties for each simulation with (a) ice–structure interaction and (b) Gaussian white noise input. Each simulation contained N = 17 800 sample points.
5. Modal parameter identification using measured data of ice–structure interactions
(a). Measurements of ice–structure interaction at Norströmsgrund lighthouse
At the Norströmsgrund lighthouse (figure 9), the structural responses, ice forces, ice thicknesses, air temperatures, wind speeds, wind directions and ice conditions during the winter seasons from 1999 to 2003 were monitored in the measurement projects LOLEIF (LOw LEvel Ice Forces) [36] and STRICE (STRuctures in ICE) [24]. Nine panels were installed at the mean water level to measure the ice forces [36], covering the outer perimeter from 0° (north) to 162°. Four acceleration channels (Shaevitz SB) and four inclinometer channels (Schaevitz DC inclinometer series and Applied Geomechanics biaxial Model 716-2A) measured the structural accelerations in the north–south and east–west directions, and the tilts about the same directions, respectively. The accelerometers were located close to the ice-action point at an elevation of +16.5 m and close to the top at an elevation of +37.1 m. A summary of the STRICE project and earlier measurement campaigns can be found in Bjerkås [37].
Figure 9.
The Norströmsgrund lighthouse during ice action: (a) rubble formation after ice interaction (photo by courtesy of Basile Bonnemaire); (b) crushing ice failure and (c) splitting ice failure. (Online version in colour.)
(b). Data selection
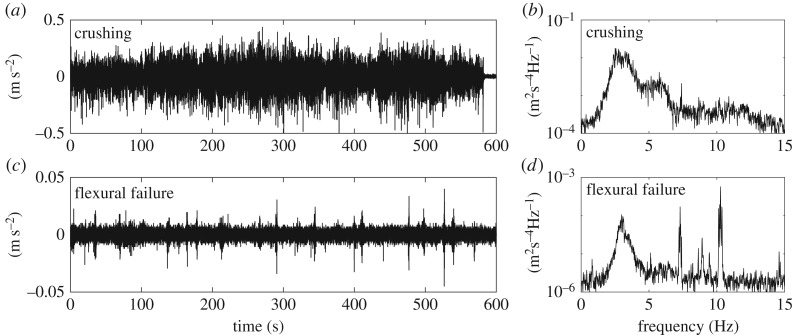
Extensive efforts were devoted to the selection of data for this study, as several criteria were required to be fulfilled; a similar selection was used in [20], although minor modifications were adopted in the present study. The sampling frequency had a minimum value of 30 Hz, video footage was available to define the type of failure and the ice failure was governed by one of the aforementioned failure modes for a minimum of 10 min. The individual data files contained time series of various lengths, and they were selected by operators to capture specific types of interactions. Often, one data file had several events of interaction that fulfilled the criteria above, and each of these events is hereon referred to as a recording. In total, 150 recordings with lengths of 10 min were selected and further used in this study; of these, the number of recordings pertaining to continuous crushing, flexural, splitting, ice floe, and creep failures were 79, 30, 14, 8 and 19, respectively. Examples of acceleration signals during continuous crushing and flexural failures are displayed in figure 10. For these examples, the continuous crushing excites the modes with lower eigenfrequencies stronger than the flexural failure does (figure 10b,d). An important disadvantage with the STRICE dataset was that data were stored with different sampling frequencies depending on the level of dynamic response of the lighthouse. If the vibrations were significant, the original data were resampled down and stored at 100 Hz, whereas if less dynamic ice action was present, data were resampled and stored at 30 Hz. For the purpose of this study, regardless of which sampling frequency the data were stored at, all accelerations were resampled to 30 Hz.
Figure 10.
Accelerations measured during: crushing failure (a,b) and flexural failure (c,d).
(c). Modal parameters and their uncertainty
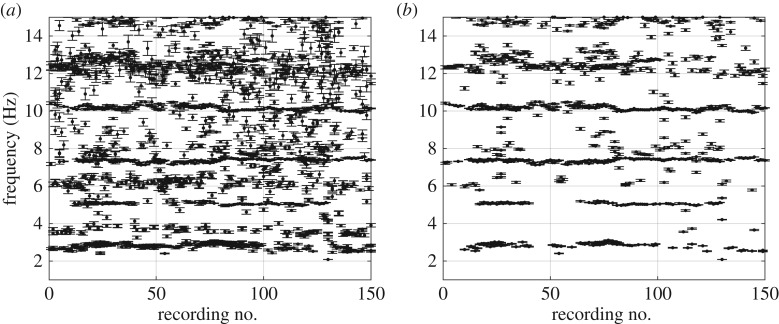
The measured data were used in conjunction with the automatic routine for identifying the modal parameters and their uncertainties. The automatic routine involved recordings of 17 800 sample points, sampling frequency of 30 Hz and the same input values as for the simulated examples in figure 8. The identified eigenfrequencies and corresponding standard deviations are shown in figure 11a. A collection of points forms horizontal branches, indicating the eigenfrequencies at approximately 2.9, 5.0, 7.5 and 10.2 Hz. A scatter of points with somewhat higher standard deviations is displayed between these horizontal lines. Assuming that these are not true eigenfrequencies of the lighthouse, another attempt is made to eliminate these by lowering the tolerance value for the stabilization criterion, now set as 0.01. The horizontal branches are more pronounced as much of the scatter is successfully eliminated via the tolerance value (figure 11b), and another branch becomes apparent at approximately 12.4 Hz.
Figure 11.
Identified frequencies and their uncertainties for each recording with two different tolerance values for the stabilization criterion: (a) tolerance criterion and (b) tolerance criterion .
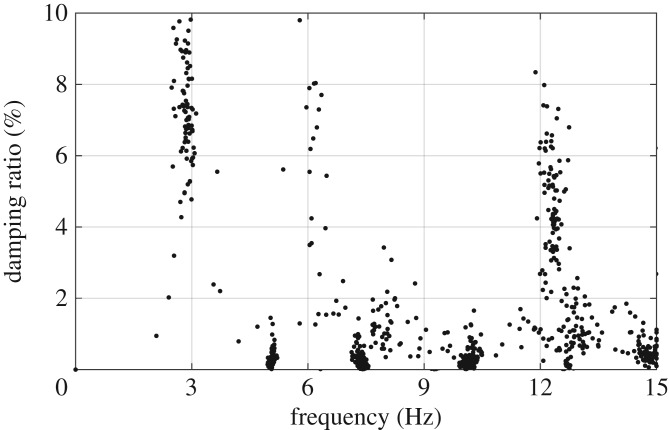
Figure 12 displays the identified damping obtained from the poles used to extract the eigenfrequencies in figure 11b. Large variations can be observed between the identified damping at frequencies corresponding to eigenmodes 1 and 5 (approx. 2.9 Hz and 12.4 Hz, respectively) and the damping identified for the other eigenmodes (at 5.0, 7.5 and 10.2 Hz, respectively). The eigenmodes 1 and 5 have significantly higher damping than the other eigenmodes. A possible explanation for this observation may be that eigenmodes 1 and 5 play a more active role in the interaction between the ice and structure than the other eigenmodes do. Similar scatters can commonly be observed for wind-sensitive bridges, for which it is well established that the modal damping varies with the wind velocity [38]. High damping was also estimated during laboratory model-scale ice–structure interaction, where damping as high as 13% was identified during ice crushing [18]. Another hypothesis considers the data quality, which may be inadequate for damping estimates for low excitation amplitudes. However, these hypotheses require verification with higher quality data.
Figure 12.
Identified damping for all recordings (tolerance criterion ).
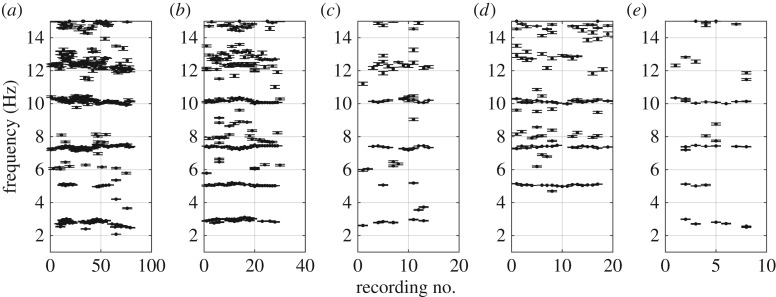
Since the recordings were categorized according to the governing interaction mode, it was possible to investigate differences between the identified quantities for different interaction modes. The two interaction modes, crushing and flexural failure, excited the most frequencies (figure 13). When the ice rested against the structure (creep, figure 13), higher eigenmodes at 5.0, 7.5 and 10.2 Hz were excited for most recordings, whereas no eigenfrequencies were identified at around the first eigenmode at 2.9 Hz, and only a few were identified in the vicinity of 12.4 Hz. These observations support the hypothesis that the eigenmodes at 2.9 and 12.4 Hz participate in the interaction process at the ice–structure interface, thereby causing higher damping. It is also suggested that eigenmodes 2, 3 and 4 are less affected by both the interaction process at the ice–structure interface and the support provided from the ice resting against the structure.
Figure 13.
Frequencies identified from the automatically selected poles for different regimes of ice–structure interaction: (a) crushing failure, (b) flexural failure, (c) splitting failure, (d) creep and (e) floe ice.
The horizontal branches formed by frequencies in figures 11 and 13 indicate the eigenfrequencies. These branches barely resemble straight lines. Laboratory experiments of IIVs show that the frequency content of the structural response could be dominated by different modes of the structure depending on the ice velocity [39]. In full scale, the ice velocity near a structure may change in a matter of seconds, thereby influencing the governing failure mode and thus the structural response [40]. The observed variability in the results may also be explained by the differences in the ice thickness, ice-drift direction, mechanical properties of the ice, air temperature, ice rubble accumulation at the structure or other metocean conditions that in turn cause differences in the structural behaviour.
The numerical simulations were limited to a specific mode of interaction, namely continuous brittle crushing. In the full-scale measurements, it is important to note that even if a failure mode governed the process for each recording, other failure mechanisms were often involved in the process. For instance, some local crushing often took place during interactions governed by flexural failure, and even for short time sequences, the interactions were entirely governed by crushing failure. This led to a non-stationary force and response, possibly contributing to the observed scatter in the experimental results. Presently, models for predicting dynamic response in such mixed-mode scenarios are limited to the combination of ice crushing and buckling [41].
Even though the structure is almost symmetric, there may be differences in the modes depending on the direction of excitation. The recordings ranging from 23 to 30 in figure 13b display identified frequencies that resemble straight lines. For all these recordings, the interaction was governed by flexural failures, the ice-drift direction was from south to south–southwest and the air temperature was warmer than −2°C.
Attempts were made to test whether the data were inaccurate at low vibration amplitudes by sorting out the recorded events with the highest standard deviations of the acceleration; however, no clear indication was found. Similar results were also obtained using the UPC algorithm instead of the SSI-cov/ref. It is, however, a fact that this is an imperfect axisymmetric problem with asymmetric mass distribution at the waterline caused by the heavy force panels and varying mass distribution due to ice rubble. Further, an unknown extent of nonlinearity is involved and the system identification is handled with only a few sensors. An attempt was also made to investigate whether the first eigenmode had preferred mode shape alignments in the horizontal plane. Only vague indications of the preferred directions were found, but the results highly depend on the slack values for the automated selection of modes, and such analysis lies beyond the scope of this study. Owing to the few sensor locations, the identified mode shapes and their variances were also not considered in this study. By using a hierarchy clustering method as described in [42], similar results as shown in figure 11b were obtained when low importance was assigned to the weights for the MAC-values and clusters with few poles were discarded. It must also be noted that the identified eigenfrequencies indicate that the FE model contained modelling errors. Updating the model would benefit numerical simulations in the future, but it does not influence the conclusions of this study.
Nord et al. [40] studied 61 events of frequency lock-in vibrations of the Norströmsgrund lighthouse. This is a mode of vibrations caused by crushing failure under certain conditions; lock-in vibrations have been a topic of research during the past 50 years [43] and still represent a popular research topic. The vibrations' signature is an amplified periodic response near one of the eigenfrequencies of the structure. For the 61 frequency lock-in events analysed, the governing frequency of vibrations was 2.3 Hz, more than 20% lower than the suggested eigenfrequency found in this study at 2.9 Hz, which is somewhat more than that reported for channel markers in the Baltic Sea [44].
6. Conclusion
Simulated and measured recordings of a structure subjected to ice actions were used to assess the possibility to identify consistent modal parameters during ice–structure interaction and consistent system changes with observed ice conditions.
The combined use of ice–structure interaction simulations and identification of variances alongside modal parameters rendered insight into how the identified modal parameters were influenced by the presence of ice. The simulations guided the choice of tolerance values for the stabilization criterion, in turn rendering some consistent estimates of eigenfrequencies for different ice conditions with measured data.
Even though the eigenfrequency often varied between each data recording, some consistency was noted between the ice failure mode and identified frequencies. The lowest eigenfrequency at approximately 2.9 Hz was identified in all interaction modes except in the case of creep, i.e. when the ice was resting against the structure. This eigenmode, as well as another mode at 12.4 Hz, exhibited significantly higher damping than the other eigenmodes, and these eigenmodes were mostly identified during crushing and flexural ice failures. It is therefore suggested that these modes were influenced by the interaction process at the ice–structure interface. Since eigenmodes at 5.0, 7.5 and 10.2 Hz were identified also during creep and had for all cases significantly lower damping, it is suggested that these higher modes were less influenced by the interaction process. For the sake of SHM, identifying eigenmodes insensitive to the interaction process significantly reduces the environmental variability and may turn out useful in selecting damage-sensitive features.
The variability in the results may be explained by the violation of the underlying assumptions used to derive the applied identification routine, the structural complexity and limited sensor data of uncertain quality.
Acknowledgements
The authors wish to acknowledge the support in data processing provided by Dr Ying Tu at the Norwegian University of Science and Technology.
Data accessibility
The data accessibility is handled by the Hamburg ship model basin (HSVA). www.hsva.de.
Authors' contributions
T.S.N. performed the simulations, identifications and data analysis, and drafted the manuscript. H.H. conducted the simulations with the ice model. Ø.W.P. performed the data analysis.
Competing interests
We declare we have no competing interests.
Funding
The study was conducted with support from the Research Council of Norway through the Centre for Research-based Innovation SAMCoT (50049000 SAMCoT Financial Contribution Partners) and support from all SAMCoT partners (10382200 SAMCoT SFI Funding Research Council of Norway). The work is also funded by the Research Council of Norway and co-funded by European Union's Horizon 2020 research and innovation programme under the framework of ERA-NET Cofund MarTERA (Maritime and Marine Technologies for a new Era). The full-scale measurements were funded by the European Commission DG RESEARCH under the Fifth Framework Programme for Research and Development within the Energy, Environment and Sustainable Development (EESD) Programme under the Key Action RTD activities of a generic nature (contract no. EVG1-CT-2000-00024).
References
- 1.Blenkarn KA. (ed.) 1970. Measurement and analysis of ice forces on Cook inlet structure. In Proc. of the Second Annu. Offshore Technology Conference, Houston, TX, 22–24 April, pp. 365–378, vol. II. [Google Scholar]
- 2.Peyton HR. 1967. Sea ice strength. PhD thesis, University of Alaska, USA. [Google Scholar]
- 3.Frederking R, Haynes FD, Hodgson TP, Sayed M. 1986. Static and dynamic ice loads on the Yamachiche lightpier, 1984–1986. In 8th Int. Symp. on Ice, pp. 115–126. Iowa, IA: IAHR. [Google Scholar]
- 4.Määttänen M. 1975. Experiences of ice forces against a steel lighthouse mounted on the seabed, and proposed constructional refinements. In Port and Ocean Engineering under Arctic conditions (POAC), Fairbanks, Alaska, pp. 857–867. [Google Scholar]
- 5.Bjerkås M, Nord TS. 2016. Ice action on Swedish lighthouses revisited. In The 23rd IAHR Int. Symp. on Ice, Ann Arbor, Michigan, USA. [Google Scholar]
- 6.Timco G, Croasdale KR. 2006. How well can we predict ice loads? pp. 167–174. Sapporo, Japan: IAHR. [Google Scholar]
- 7.Danys JV. 1977. Ice forces on old and new offshore lighthouses in the St Lawrence Waterway. In Port and Ocean Engineering under Arctic Conditions (POAC), pp. 115–138. St Johns, Newfoundland, Canada. [Google Scholar]
- 8.Määttänen M, Kärnä T. 2011. ISO 19906 ice crushing load design extension for narrow structures. In Proc. of the 21st Int. Conf. on Port and Ocean Engineering under Arctic Conditions (POAC), Montréal, Canada. [Google Scholar]
- 9.Bjørk B. 1981. Ice-induced vibration of fixed offshore structures. Part 2: experience with Baltic lighthouses. In Marine structure and ships in ice. Report 81-06/2 Ship Research Institute of Norway, Information Department. [Google Scholar]
- 10.Hendrikse H, Metrikine A. 2015. Interpretation and prediction of ice induced vibrations based on contact area variation. Int. J. Solids Struct. 75–76, 336–348. ( 10.1016/j.ijsolstr.2015.08.023) [DOI] [Google Scholar]
- 11.Määttänen M. 1978. On conditions for the rise of self-excited ice induced autonomous oscillations in slender marine pile structures. PhD, University of Oulu. [Google Scholar]
- 12.Sodhi DS. 1988. Ice-induced vibration of structures. In Proc. of the 9th IAHR Int. Symp. on Ice, Sapporo, Japan, pp. 625–657. [Google Scholar]
- 13.Jefferies MG, Wright WH. 1988. Dynamic response of ‘Molikpaq’ to ice-structure interaction. In Proc. 7th Int. Conf. on Offshore Mechanics and Arctic Engineering (OMAE 88), Houston, TX, USA, pp. 201–220. [Google Scholar]
- 14.Londoño NA. 2006. Use of vibration data for structural health monitoring of Bridges. Ottawa, Canada: Carleton University. [Google Scholar]
- 15.Brown TG, Tibbo JS, Tripathi D, Obert K, Shrestha N. 2010. Extreme ice load events on the Confederation Bridge. Cold Reg. Sci. Technol. 60, 1–14. ( 10.1016/j.coldregions.2009.08.004) [DOI] [Google Scholar]
- 16.Shrestha N, Brown TG. 2018. 20 years of monitoring of ice action on the Confederation Bridge piers. Cold Reg. Sci. Technol. 151, 208–236. ( 10.1016/j.coldregions.2018.03.025) [DOI] [Google Scholar]
- 17.Hendrikse H, Metrikine A, Evers K-U. 2012. A method to measure the added mass and added damping in dynamic ice-structure interaction. ‘Ice Research for a Sustainable Environment’ (IAHR) Dalian, China (Paper no. 094).
- 18.Singh SK, Timco GW, Frederking R, Jordaan IJ. 1990. Tests of ice crushing on a flexible structure, pp. 89–94. Houston, TX: OMAE. [Google Scholar]
- 19.Hendrikse H. 2017. Ice-induced vibrations of vertically sided offshore structures. PhD thesis, Delft University of Technology, The Netherlands. [Google Scholar]
- 20.Nord TS, Kvåle KA, Petersen ØW, Bjerkås M, Lourens E-M. 2017. Operational modal analysis on a lighthouse structure subjected to ice actions. Procedia Eng. 199, 1014–1019. ( 10.1016/j.proeng.2017.09.268) [DOI] [Google Scholar]
- 21.Reynders E, Pintelon R, De Roeck G. 2008. Uncertainty bounds on modal parameters obtained from stochastic subspace identification. Mech. Syst. Signal Process. 22, 948–969. ( 10.1016/j.ymssp.2007.10.009) [DOI] [Google Scholar]
- 22.Döhler M, Mevel L. 2013. Efficient multi-order uncertainty computation for stochastic subspace identification. Mech. Syst. Signal Process. 38, 346–366. ( 10.1016/j.ymssp.2013.01.012) [DOI] [Google Scholar]
- 23.Jordaan IJ. 2001. Mechanics of ice–structure interaction. Eng. Fract. Mech. 68, 1923–1960. ( 10.1016/S0013-7944(01)00032-7) [DOI] [Google Scholar]
- 24.Kärnä T, Jochmann P. 2003. Field observations on failure modes. In Port and ocean engineering under Arctic conditions, pp. 839–849. Trondheim, Norway: Norwegian University of Science and Technology. [Google Scholar]
- 25.Wells J, Jordaan I, Derradji-Aouat A, Taylor R. 2011. Small-scale laboratory experiments on the indentation failure of polycrystalline ice in compression: main results and pressure distribution. Cold Reg. Sci. Technol. 65, 314–325. ( 10.1016/j.coldregions.2010.11.002) [DOI] [Google Scholar]
- 26.Nord TS, Øiseth O, Lourens E-M. 2016. Ice force identification on the Norströmsgrund lighthouse. Comput. Struct. 169, 24–39. ( 10.1016/j.compstruc.2016.02.016) [DOI] [Google Scholar]
- 27.Peeters B, De Roeck G. 1999. Reference-based stochastic subspace identification for output-only modal analysis. Mech. Syst. Signal Process. 13, 855–878. ( 10.1006/mssp.1999.1249) [DOI] [Google Scholar]
- 28.Reynders E, Maes K, Lombaert G, De Roeck G. 2016. Uncertainty quantification in operational modal analysis with stochastic subspace identification: validation and applications. Mech. Syst. Signal Process. 66–67, 13–30. ( 10.1016/j.ymssp.2015.04.018) [DOI] [Google Scholar]
- 29.Mellinger P, Döhler M, Mevel L. 2016. Variance estimation of modal parameters from output-only and input/output subspace-based system identification. J. Sound Vib. 379, 1–27. ( 10.1016/j.jsv.2016.05.037) [DOI] [Google Scholar]
- 30.Döhler M, Lam X-B, Mevel L. 2013. Uncertainty quantification for modal parameters from stochastic subspace identification on multi-setup measurements. Mech. Syst. Signal Process. 36, 562–581. ( 10.1016/j.ymssp.2012.11.011) [DOI] [Google Scholar]
- 31.ISO. 2010. ISO/FDIS 19906, p. 188.
- 32.Sodhi D, Haehnel R. 2003. Crushing ice forces on structures. J. Cold Reg. Eng. 17, 153–170. ( 10.1061/(ASCE)0887-381X(2003)17:4(153)) [DOI] [Google Scholar]
- 33.Hendrikse H, Nord TS. 2019. Dynamic response of an offshore structure interacting with an ice floe failing in crushing. Mar. Struct. 65, 271–290. ( 10.1016/j.marstruc.2019.01.012) [DOI] [Google Scholar]
- 34.Hendrikse H. 2019. Model for simulation of dynamic ice-structure interaction for vertically sided offshore structures—SDOF MATLAB implementation. Mendeley Data v2. See https://data.mendeley.com/datasets/582m8565dj/2.
- 35.Heinonen J, Kärnä T, Luo C. 2003. Dynamic behavior of the Nordströmsgrund lighthouse, STRICE-REPORT VTT. Technical Research Centre of Finland and Luleå University of Technology.
- 36.Jochmann P, Schwarz J. 1999. Ice force measurements at lighthouse Norströmsgrund—winter 1999, LOLEIF Report No. 5, MAS3-CT-97-0098. Hamburgische shiffbau-versuchsantalt GmbH.
- 37.Bjerkås M. 2006. Ice action on offshore structures. PhD thesis, Norwegian University of Science and Technology, Norway. [Google Scholar]
- 38.Hong AL, Ubertini F, Betti R. 2011. Wind analysis of a suspension bridge: identification and finite-element model simulation. J. Struct. Eng. 137, 133–142. ( 10.1061/(ASCE)ST.1943-541X.0000279) [DOI] [Google Scholar]
- 39.Nord TS, Øiseth O, Lourens E, Määttanen M, Høyland KV. 2015. Laboratory experiments to study ice-induced vibrations of scaled model structures during their interactions with level ice at different ice velocities. Cold Reg. Sci. Technol. 119, 1–15. ( 10.1016/j.coldregions.2015.06.017) [DOI] [Google Scholar]
- 40.Nord TS, Samardžija I, Hendrikse H, Bjerkås M, Høyland KV, Li H. 2018. Ice-induced vibrations of the Norströmsgrund lighthouse. Cold Reg. Sci. Technol. 155, 237–251. ( 10.1016/j.coldregions.2018.08.005) [DOI] [Google Scholar]
- 41.Hendrikse H, Metrikine A. 2016. Ice-induced vibrations and ice buckling. Cold Reg. Sci. Technol. 131, 129–141. ( 10.1016/j.coldregions.2016.09.009) [DOI] [Google Scholar]
- 42.Magalhães F, Cunha Á, Caetano E. 2009. Online automatic identification of the modal parameters of a long span arch bridge. Mech. Syst. Signal Process. 23, 316–329. ( 10.1016/j.ymssp.2008.05.003) [DOI] [Google Scholar]
- 43.Määttänen M. 2015. Ice induced frequency lock-in vibrations—coverging towards concensus. In Proc. of the 23rd Int. Conf. on Port and Ocean Engineering under Arctic Conditions, Trondheim, Norway. [Google Scholar]
- 44.Kärnä T. 1994. Steady-state vibrations of offshore structures. Hydrotech. Constr. 28, 446–453. ( 10.1007/BF01487453) [DOI] [Google Scholar]
Associated Data
This section collects any data citations, data availability statements, or supplementary materials included in this article.
Data Availability Statement
The data accessibility is handled by the Hamburg ship model basin (HSVA). www.hsva.de.


