

Abstract
Physical activity in an inpatient setting is often limited to brief periods of walking. For healthy adults, public health agencies recommend a minimum of 150 min/week of moderate intensity exercise. We sought to determine if meeting this activity threshold, in the absence of incidental activities of daily living, could protect skeletal muscle health during bed rest. Healthy older adults (68 ± 2 y) were randomized to 7-days bed rest with (STEP; n=7) or without (CON; n=10) a 2000 step/day intervention. Performing 2018 ± 4 steps/day did not prevent the loss of lean leg mass and had no beneficial effect on aerobic capacity, strength or muscle fiber volume. However, the insulin response to an oral glucose challenge was preserved. Performing a block of 2000 steps/day, in the absence of incidental activities of daily living, was insufficient to fully counter the catabolic effects of bed rest in healthy older adults.
Keywords: Inactivity, atrophy, physical activity, muscle function
Introduction
Compromised muscle mass, function and metabolic control are hallmarks of muscular disuse. As little as 5 days of inactivity can significantly compromise muscle health, particularly in middle-aged and older adults (Covinsky et al., 2003; Hirsch, Sommers, Olsen, Mullen, & Winograd, 1990; Sager et al., 1996). Over 70% of hospitalized adults are discharged below their preadmission level of function and many experience long-lasting physical and metabolic impairment. Compelling data support the muscle-health benefits of moderate-to-high intensity resistance and aerobic exercise training in ambulatory older adults (Dela & Kjaer, 2006; Evans, 2002; Fiatarone et al., 1994; Fielding, 1995; Frontera, Meredith, O’Reilly, & Evans, 1990; Melov, Tarnopolsky, Beckman, Felkey, & Hubbard, 2007; Parise & Yarasheski, 2000). Physical activity guidelines call for 150–300 min/week of purposeful, moderate intensity exercise, in addition to regular, incidental activities of daily living (U.S. Department of Health and Human Services. Physical activity guidelines advisory committee report, 2008; Chodzko-Zajko et al., 2009). At a typical walking cadence of approximately 90–100 steps/min, this represents 20 to 40 min of activity. However, in an inpatient setting, incidental activities of daily living are greatly curtailed and purposeful physical activity is often limited to comparatively brief periods of standing and/or walking (Blocker, 1992; Landefeld, Palmer, Kresevic, Fortinsky, & Kowal, 1995; Mahoney, Sager, & Jalaluddin, 1999; Suesada, Martins, & Carvalho, 2007).
Investigators recently demonstrated that reducing and limiting step count to 1413±110 steps/day for 14 days had a negative effect on myofibrillar protein synthesis, lean leg mass and glucose tolerance in a cohort of free-living, healthy older adults (Breen et al., 2013). In clinical populations, increasing purposeful physical activity beyond 1400 steps/day may confer health benefits, but may also be contraindicated, inefficient, or place a burden on patients and health care delivery system (Baldwin, van Kessel, Phillips, & Johnston, 2017; Fisher et al., 2011).
To mimic the overt physical inactivity experienced during hospitalization, while separating the catabolic, disease-related effects from the intrinsic effects of skeletal muscle disuse, we subjected a cohort of healthy, community-dwelling older adults to a 7-day bed rest protocol with and without a 2000 steps/day intervention. While lacking direct clinical translation, our protocol represents a “best case” research model, with healthy volunteers and (clinically) ambitious physical activity intervention. We hypothesized that performing 2000 steps/day, despite the absence of most other incidental activities of daily living, would counter the catabolic stress of inactivity and protect key markers of skeletal muscle health.
Methods
Subjects
17 healthy, physically untrained older adults were recruited, provided written informed consent, medically screened, and compensated for their participation. The study protocol was conducted in accordance with the Declaration of Helsinki, approved by the Institutional Review Board and registered at ClinicalTrials.gov (NCT01846130). At the time of submission, additional data collection and analysis for nutrition-related study arms were ongoing; these data are not directly/statistically comparable to the STEP intervention data presented here.
Volunteers were randomized to a bed rest only control (CON: n=10, 7 male, 3 female; no weight bearing) or intervention group (STEP: n=7, 4 male, 3 female; 2000 steps/day) and completed a 3 day run-in, followed by 7 days of horizontal bed rest and a final day of post-testing. At baseline there were no differences between the groups in age (CON: 68 ± 2 y; STEP: 68 ± 2 y), body mass (CON: 72.1 ±3.0 kg; STEP: 72.9 ± 4.1 kg) or BMI (CON: 25.2 ± 0.7 kg/m2; STEP 27.1 ± 1.4 kg/m2).
Study Design
The general experimental design and timeline is depicted in Figure 1. Our bed rest model included subject monitoring, safety and comfort provisions. Volunteers received isoenergetic diets with protein and energy evenly distributed across three daily meals. Daily energy intake was pre-determined by the Harris-Benedict equation. Activity factors of 1.6 and 1.3 were used during the run-in and bed rest periods, respectively. Macronutrient intake and plate-waste were analyzed using Nutrition Data System for Research software (v 2006, Nutrition Coordinating Center University of Minnesota, Minneapolis, MN USA).
Figure. 1.
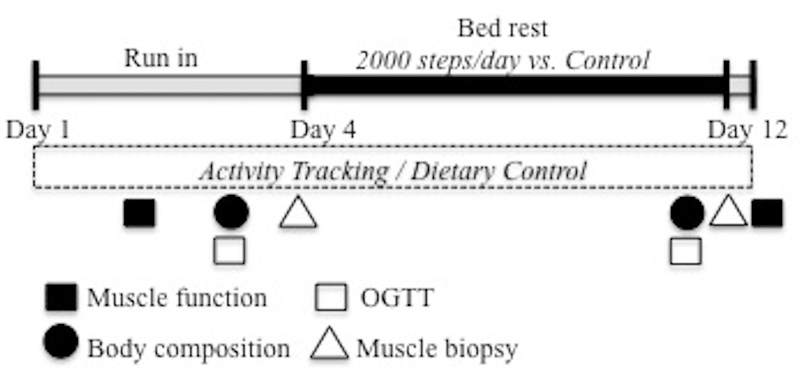
Study timeline. The 3 d ambulatory, run-in included baseline testing of dependent measures, activity tracking and dietary control. During the 7 d bed rest phase, subjects were randomized to 2000 steps/day (STEP) or bed rest alone (CON). Dependent measures were re-assessed on day 10–12. Subjects were encouraged to minimize physical activity between completion of bed rest on the afternoon of day 11 and completion of muscle function testing on day 12.
During the 7-day bed rest phase, the CON group performed no weight bearing. Bathing and toiletry activities were performed in bed, or with a bedside commode. CON group volunteers were encouraged to change position frequently to prevent postural discomfort during bed rest. The CON groups were also required to passively sit upright in a chair for 30 min each day prior to lunch as a postural control for the STEP condition.
Subjects in the STEP cohort performed 2000 steps/day during the bed rest period. The sessions consisted of a single daily bout of supervised, self-selected, moderately-paced walking. Step count was captured with a pedometer worn at the subject’s waist (Yamax, Digi-Walker-SW-701 pedometer, Tokyo, Japan). Walking sessions were preceded by 10 minutes of upright sitting to reduce dizziness, postural hypotension and the risk of falling. Walking bouts were completed within approximately 18–22 minutes between 10:00–11:00 each morning.
Vastus lateralis muscle samples (approximately 200 mg/biopsy) were obtained pre-and post bed rest on study days 4 and 11 using a 5 mm Bergström biopsy needle with subjects in the post absorptive state.
Outcome measures
The sequence and timing of all pre-and post-testing events was standardized to maintain data integrity, limit any confounding influence on subsequent measures, and minimize subject burden (see Figure 1).
Whole body lean tissue mass (WBLM), whole body fat mass (WBFM) and leg lean tissue mass (LLM) were assessed using dual energy x-ray absorptiometry (DXA) on days 3 and 10 (Lunar iDEXA, GE Medical Systems, Madison, WI USA). To minimize and standardize the acute effects of postural fluid shift, subjects were asked to lie supine for at least 15 minutes prior to each scan.
Muscle for immunohistochemical analysis was mounted on foil-covered cork with Tissue Tek (O.C.T. Compound, Sakura Finetek, Torrance CA, USA) and frozen in liquid nitrogen for later analysis. Muscle for cross-sectional area (CSA) analysis was cut into 7 um sections using a cryostat (HM525-NX, Thermo Fisher Scientific, Waltham, MA USA) and stained for fiber type (Arentson-Lantz, English, Paddon-Jones, & Fry, 2016).
To analyze single fiber volume, 15–20 mg of muscle was fixed in 4% paraformaldehyde for 48 h. Single fibers were isolated using a 40% NaOH digestion for 2 h followed by mechanical separation and washes in phosphate-buffered saline (PBS) (Finnerty et al., 2017). Suspended fibers were stained with 4’,6-diamidino-2-phenylindole (DAPI) for nuclei visualization and mounted on a slide with Vectashield fluorescence mounting medium (Vector Laboratories, Burlington, CA USA).
Immunohistochemical images of CSA and fiber type were captured at x100 and x200 total magnification, respectively, at room temperature with a Zeiss upright microscope (AxioImager M1; Zeiss, Oberkochen, Germany) and analysis was performed using AxioVision Rel software (v4.9). Due to issues with sample integrity only muscle from a subset of subject for CSA (CON, n=6; STEP, n=6) and single fiber volume (CON; n=6; STEP: n=7) were successfully analyzed. The average number of fibers analyzed at each time point for CSA was 209± 32 fibers Pre-BR and 183 ± 38 fibers Post-BR. Eight to ten fibers from each subject at each time point were analyzed with z-stack analysis to measure fiber volume by calculating π x 1/2 fiber width (radius)2 x length of the measured fiber segment to give a fiber segment volume (μm3).
Single leg isokinetic knee extensor peak torque at 60°/s was measured using isokinetic dynamometry (Biodex System 4, Biodex Medical Systems, Inc., Shirley, NY USA) on days 2 and 12. Peak aerobic capacity (VO2-peak) (Monark Ergomedic 828E; Monark Exercise, Vansbro Sweden) was assessed using graded cycle ergometry (Vmax Encore 29; Care Fusion, Yorba Linda, CA USA) approximately 2 h following strength testing on study days 2 and 12.
A standard 75 g oral glucose challenge was performed on days 3 and 10 with blood draws at 0 min, 30 min, 60 min, 90 min and 120 min for measurement of blood glucose (YSI Incorporated, Yellow Springs, OH USA) and plasma insulin via ELISA (Millipore Sigma, Burlington, MA USA). Glucose and insulin area under the curve (AUC) was calculated using the trapezoidal method (Tai, 1994).
Statistical analysis
Statistical analyses were performed using SPSS v24 software (IBM, Chicago IL USA). Two-factor mixed ANOVA were used to analyze dependent variables with fixed effects of bed rest (pre/post time points) as the within subject factor and group (CON/STEP) as the between subject factor. If the interaction of group by time was significant (p<0.05), individual post hoc tests with a Bonferroni adjustment were performed. Residual normality was tested using the Shapiro-Wilk test (p<0.05) and Levene’s Test of Equality of Error variance was used to check for equal variance. Muscle fiber volume studentized residuals were not normally distributed so values were natural log transformed; means were back transformed and reported as physiologically relevant values with a 95% confidence interval (CI). Data points greater than two standard deviations from the average were excluded from the analysis to better meet model assumptions. Data are expressed as mean ± SEM; significance was set at p < 0.05.
Results
Diet
Energy and macronutrient consumption were similar in the CON and STEP groups. Full dietary intake data during the 7-day bed rest phase are presented in Table 1.
Table 1.
Dietary intake during the 7-day bed rest phase.
| Energy (kcal) |
Protein (g) |
Protein (g/kg) |
Carbohydrate (g) |
Fat (g) |
|
|---|---|---|---|---|---|
| CON | |||||
| Breakfast | 526 ± 129 | 23 ± 3 | 0.32 ± 0.03 | 68 ± 29 | 19 ± 2 |
| Lunch | 532 ± 88 | 22 ± 4 | 0.32 ± 0.04 | 78 ± 10 | 20 ± 2 |
| Dinner | 552 ± 80 | 23 ± 3 | 0.33 ± 0.02 | 77 ± 10 | 20 ± 2 |
| Total | 1610 ± 139 | 68 ± 6 | 0.97 ± 0.01 | 223 ± 3 | 59 ± 0 |
| STEP | |||||
| Breakfast | 543 ± 111 | 23 ± 2 | 0.32 ± 0.03 | 70 ± 26 | 19 ± 3 |
| Lunch | 576 ± 59 | 24 ± 3 | 0.32 ± 0.03 | 79 ± 8 | 16 ± 5 |
| Dinner | 576 ± 59 | 23 ± 3 | 0.32 ± 0.03 | 79 ± 8 | 18 ± 4 |
| Total | 1695 ± 155 | 70 ± 7 | 0.96 ± 0.00 | 228 ± 3 | 53 ± 1 |
Note: Values are presented as means ± SEM.
Physical Activity and Step Count
The STEP group completed 2018 ± 4 steps/day during the bed rest phase for a 7-day total of 155 ± 8 minutes of activity. During the walking bouts, subjects averaged 94 ± 4 steps/min for 22 ± 1 min at an exercising heart rate of 102 ± 5 beats/min (vs. resting: 65 ± 3 beats/min). The bed rest protocol ensured that all other weight bearing and most other incidental activities of daily living (particularly of the lower body) were minimized.
Body Composition
Bed rest had a characteristically negative effect on lean body mass (Table 2). Total fat mass was not influenced by bed rest, but body fat percentage increased. Performing 2000 steps/day during bed rest had no effect on total body mass or fat mass and did not significantly protect lean leg mass (Change in leg lean mass: CON vs. STEP: −1006 vs. −609 ± 149 g; p=0.094; Figure 2a).
Table 2.
Change Body composition for CON and STEP before and after 7 days of bed rest.
| Body mass (kg) |
WBLM (kg) |
WBFM (kg) |
|
|---|---|---|---|
| CON | |||
| Pre bed rest | 72.1±3.1 | 45.8±1.9 | 23.9 ± 2.1 |
| Post-BR (Δ) | −1.4±0.5** | −1.3±0.3** | − 0.09 ± 0.11 |
| STEP | |||
| Pre bed rest | 74.9±3.8 | 46.9±2.7 | 26.1 ± 2.5 |
| Post-BR (Δ) | −2.0±0.5** | −1.8±0.4** | 0.02 ± 0.18 |
Note: Values are presented as means ± SEM pre bed rest and the change following 7 days of bed rest (Post-BR (Δ)). Body composition measures were assessed using dual x-ray absorptiometry on days 3 and 10. WBLM =Whole body lean mass. WBFM=whole body fat mass.
significant main effect of bed rest, p<0.05
significant main effect of bed rest, p<0.001
Figure 2.
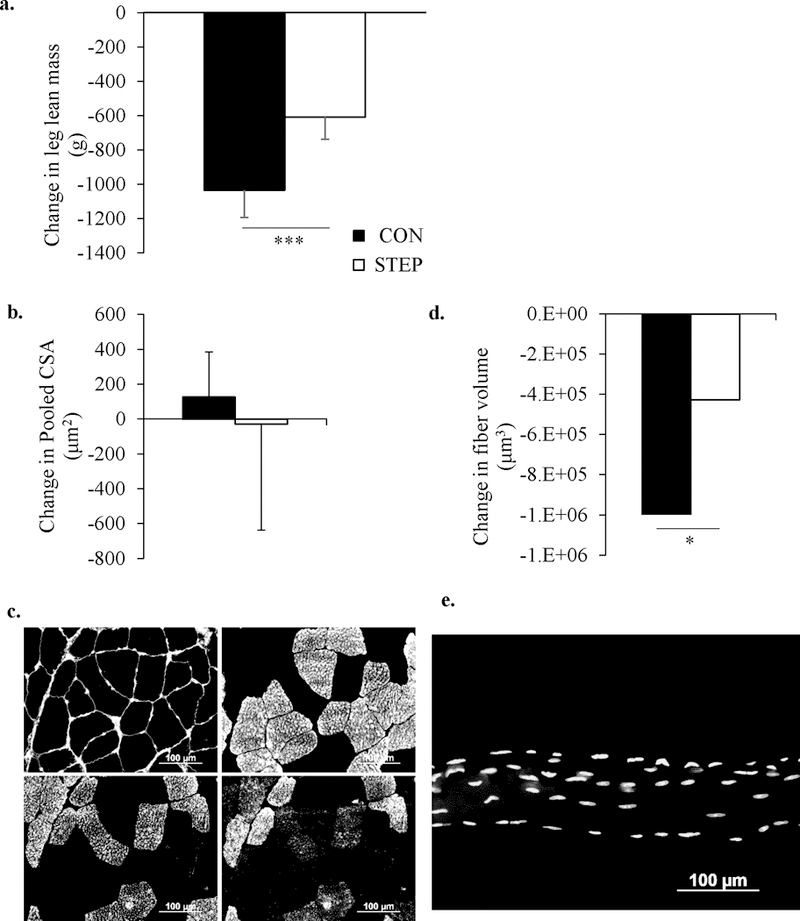
Seven days of bed rest significantly decreased leg lean mass (a) and muscle fiber volume (d), and was not rescued by 2000 steps a day. However, there was no change in muscle fiber cross sectional area (c) and (e) are representative of images used for muscle fiber cross sectional area (pink fibers = Type 1, green fibers = Type 2a, orange fibers = Type 2a/2x) and single fiber volume (stacked z-stack image, yellow dots represent individual myonuclei), respectively. The 95% confidence interval for fiber volume was (1867292, 4273740). The black bars represent the CON group and the white bars represent the STEP group. * significant difference from pre-bed rest (p < 0.05); *** significant difference from pre-bed rest, (p < 0.001)
Immunohistochemistry
Following bed rest, the pooled fiber CSA demonstrated substantial variability and did not significantly change (Figure 2); fiber-specific CSA also did not change (data not shown). However, single fiber volume was significantly reduced (p<0.05) by 7 days of inactivity (Figure 2).
Muscle Function
Muscle strength (isokinetic knee extension peak torque) decreased by 12% during bed rest (p<0.001) and was not influenced by the STEP intervention (Table 2). Aerobic capacity (VO2 peak, expressed as absolute L/min or relative to body mass (mL/kg/min) was not significantly altered by bed rest or the STEP intervention (Table 3).
Table 3.
Muscle function and aerobic capacity for CON and STEP before and after 7 days of bed rest.
| Knee extensor torque at 60°/sec (Nm) |
VO2 peak (L/min) |
Relative VO2 peak (mL/kg/min) |
|
|---|---|---|---|
| CON | |||
| Pre bed rest | 133.4 ± 10.0 | 1.79 ± 0.02 | 24.6 ± 1.6 |
| Post-BR (Δ) | 16.2 ± 2.4** | −0.13 ± 0.09 | −1.2 ± 1.0 |
| STEP | |||
| Pre bed rest | 119.8 ± 11.9 | 1.33 ± 0.01a | 18.4 ± 2.1a |
| Post-BR (Δ) | 14.4 ± 3.8** | −0.01 ± 0.09a | 0.3 ± 1.1a |
Note: Values are presented as means ± SEM pre bed rest and the change following 7 day of bed rest (Post-BR (Δ)). Muscle function measures and were assessed on days 3 and 12.
significant main effect of bed rest, p<0.001
n=6
Blood glucose and Insulin
Fasting plasma glucose concentrations and glucose area under the curve following an OGTT exhibited considerable inter-subject variation and did not significantly change in response to bed rest (CON) or the STEP intervention. (Figure 3). In response to bed rest, plasma insulin AUC following the OGTT increased in the CON group, but did not change in the STEP cohort (Figure 3).
Figure 3.
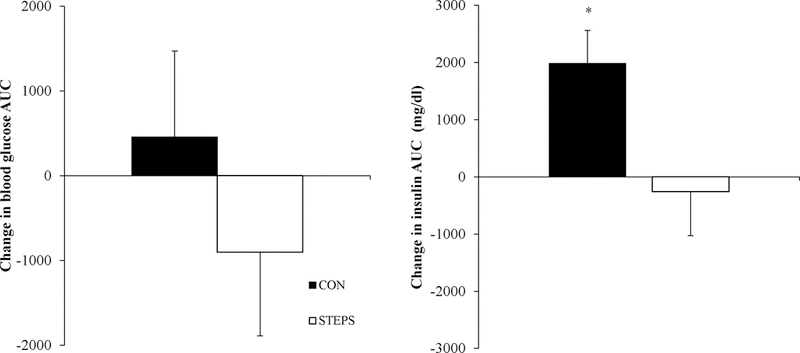
Blood glucose and plasma insulin were measured at baseline (0 min) and 30, 60, 90 and 120 min following a 75 g oral glucose tolerance test and the area under the curve was calculated. There was not significant effect of time or group on glucose AUC. However, there were a main effect of bed rest (p=0.089), group (p=0.025) and an interaction of bed rest x group (p=0.032) on plasma insulin AUC. The control group experienced a significant increase in plasma insulin (p< 0.05) that was not exhibited by the STEP group.
Discussion
Physical inactivity is a common feature of the inpatient experience. While bed rest may be unavoidable in some situations, even brief periods of inactivity accelerate catabolism and contribute to metabolic and musculoskeletal dysfunction (Dirks et al., 2016; Galvan, Arentson-Lantz, Lamon, & Paddon-Jones, 2016). In this paper, we have demonstrated that 2000 steps/day, performed as a single daily bout of exercise, has a minimal effect on most markers of skeletal muscle health, and is insufficient to fully counter the catabolic effects of bed rest in healthy older adults.
The rapid decrease in lean leg mass and muscle fiber volume following only 7 days of bed rest reinforces the fact that even healthy, well nourished older adults are susceptible to the catabolic impact of brief periods of physical inactivity. The discrepancy between the gross measurement of lean mass (DXA) and changes at the cellular/muscle fiber level (CSA) likely reflect the relative heterogeneity of the muscle samples. While some groups have reported a 25% decrease in muscle fiber CSA in older adults following 5 days of disuse (Reidy et al., 2017), others have reported smaller changes (Wall et al., 2014; Wall et al., 2015). In contrast, the pattern of changes in vastus lateralis, single fiber volume (Figure 2d) was consistent with the loss of lean leg mass measured by DXA. To our knowledge this is the first time single fiber volume has been reported in humans, particularly in conjunction with the atrophy response to disuse, and appears to be a sensitive and useful technique for detecting changes in muscle fiber size.
While glucose AUC following 7 days of inactivity did not change in either group, maintenance of glucose control in the CON group was achieved at the expense of increasing insulin output. In comparison, the moderate amount of activity in STEP group was sufficient to maintain insulin sensitivity during disuse.
The rationale for subjecting healthy volunteers to a bed rest intervention is to isolate the effects of physical inactivity on aging skeletal muscle and provide an uncomplicated, comorbidity-free baseline for future clinical trials in patient populations at risk of disuse atrophy. To this end, we were able to eliminate most incidental (lower body) activities of daily living and precisely control daily physical activity. For the STEP cohort this represented a ~60% reduction in pre-bed rest step count and the complete removal of all other standing or weight bearing activities. Performing 2000 steps/day for 7 days is equivalent to 155 min/week of low-to-moderate intensity activity. For healthy ambulatory adults also engaged in typical activities of daily living, this amount of exercise is broadly consistent with the World Health Organization (WHO) and the American College of Sports Medicine (ACSM) recommendation of 150–300 min/week of purposeful, moderate intensity exercise (or 75–150 min/week of vigorous exercise), (U.S. Department of Health and Human Services. Physical activity guidelines advisory committee report, 2008; Chodzko-Zajko et al., 2009).
In free-living adults, attempting to meet physical activity goals with a single daily bout of exercise, in the absence of all other incidental or routine daily activities, is clearly a contrived research construct. However, our results do provide general insight into clinical exercise-prescription and exercise patterns in excessively sedentary individuals. For example, in clinical environments there is a cost, and some risk, associated with walking or weight bearing interventions (Fisher et al., 2011; Lewis et al., 2016). While we did not titrate activity levels or recruit clinically compromised older adults, a “bolus” 2000 step/day protocol is clearly at the very upper end of what could be tolerated by most inpatient populations (Fisher et al., 2011). In clinical surveys, the average step count in inpatient settings is approximately 400 steps/day. Increasing the duration or intensity of exercise would almost certainly confer additional/improved muscle health benefits in healthy individuals, but is increasingly unrealistic in older, compromised patients (Evans, 2010; Glover & Phillips, 2010).
There is a considerable body of observational data supporting the positive relationship between low-intensity activity or breaks in sedentary behavior and metabolic health and physical function (Dunstan et al., 2012; Healy et al., 2007, 2008). However, in a cohort of healthy, older adults whose step count was purposely restricted to 1400 steps/day for 2-weeks, a low level of activity and frequent breaks in sedentary behavior distributed at varying intervals throughout the day, was insufficient to preserve markers of muscle mass and metabolic health.
Alternate strategies to preserve skeletal muscle mass and function during periods of physical inactivity have included neuromuscular electrical stimulation (Dirks, Hansen, Van Assche, Dendale, & Van Loon, 2015; Dirks et al., 2014), artificial gravity (Symons, Sheffield-Moore, Chinkes, Ferrando, & Paddon-Jones, 2009). While these interventions have the potential to reduce the negative consequences of inactivity in cohorts of hospitalized patients and healthy research volunteers, there are practical challenges that limit their scalability for use on a large population. Higher intensity exercise interventions, such as those employed during microgravity and flight analogue studies, are clearly beneficial, but are generally not translatable to a compromised patient population (Ploutz-Snyder et al., 2014).
In terms of study limitations, we acknowledge that our study was moderately underpowered and unable to detect a between-group difference in our primary outcome: leg lean mass. While enrolling additional volunteers may have yielded a statistically significant outcome, our general thesis, that 2000 steps/day is insufficient to fully protect muscle mass and function during bed rest, would still hold true. Moving forward, we encourage researchers to build on our data and explore the many knowledge gaps that remain, including sex differences and the potential synergistic effects of combining and optimizing physical activity, nutrition and/or pharmacological interventions.
In conclusion, in the absence of incidental activities of daily living, simply performing 2000 steps/day, and broadly meeting physical activity guidelines, was insufficient to fully counter the negative effects of physical inactivity in healthy older adults. In compromised patient populations, avoiding complete bed rest is clearly beneficial. However, meeting a threshold of purposeful activity that preserves muscle-and metabolic-function may be unrealistic. Instead, it may be prudent to adopt strategies that optimize the efficacy of moderate physical activity interventions by introducing concurrent nutrition and/or pharmaceutical support.
References
- Arentson-Lantz EJ, English KL, Paddon-Jones D, & Fry CS (2016). Fourteen days of bed rest induces a decline in satellite cell content and robust atrophy of skeletal muscle fibers in middle-aged adults. J Appl Physiol (1985), 120(8), 965–975. doi: 10.1152/japplphysiol.00799.2015 [DOI] [PMC free article] [PubMed] [Google Scholar]
- Baldwin C, van Kessel G, Phillips A, & Johnston K (2017). Accelerometry Shows Inpatients With Acute Medical or Surgical Conditions Spend Little Time Upright and Are Highly Sedentary: Systematic Review. Phys Ther, 97(11), 1044–1065. doi: 10.1093/ptj/pzx076 [DOI] [PubMed] [Google Scholar]
- Blocker WP Jr. (1992). Maintaining functional independence by mobilizing the aged. Geriatrics, 47(1), 42, 48–50, 53 passim. [PubMed] [Google Scholar]
- Breen L, Stokes KA, Churchward-Venne TA, Moore DR, Baker SK, Smith K, . . . Phillips SM (2013). Two weeks of reduced activity decreases leg lean mass and induces “anabolic resistance” of myofibrillar protein synthesis in healthy elderly. J Clin Endocrinol Metab, 98(6), 2604–2612. doi: 10.1210/jc.2013-1502 [DOI] [PubMed] [Google Scholar]
- Chodzko-Zajko WJ, Proctor DN, Fiatarone Singh MA, Minson CT, Nigg CR, Salem GJ, & Skinner JS (2009). American College of Sports Medicine position stand. Exercise and physical activity for older adults. Med Sci Sports Exerc, 41(7), 1510–1530. doi: 10.1249/MSS.0b013e3181a0c95c [DOI] [PubMed] [Google Scholar]
- Covinsky KE, Palmer RM, Fortinsky RH, Counsell SR, Stewart AL, Kresevic D, . . . Landefeld CS (2003). Loss of independence in activities of daily living in older adults hospitalized with medical illnesses: increased vulnerability with age. J Am Geriatr Soc, 51(4), 451–458. [DOI] [PubMed] [Google Scholar]
- Dela F, & Kjaer M (2006). Resistance training, insulin sensitivity and muscle function in the elderly. Essays Biochem, 42, 75–88. doi: 10.1042/bse0420075 [DOI] [PubMed] [Google Scholar]
- Dirks ML, Hansen D, Van Assche A, Dendale P, & Van Loon LJ (2015). Neuromuscular electrical stimulation prevents muscle wasting in critically ill comatose patients. Clin Sci (Lond), 128(6), 357–365. doi: 10.1042/cs20140447 [DOI] [PubMed] [Google Scholar]
- Dirks ML, Wall BT, Snijders T, Ottenbros CL, Verdijk LB, & van Loon LJ (2014). Neuromuscular electrical stimulation prevents muscle disuse atrophy during leg immobilization in humans. Acta Physiol (Oxf), 210(3), 628–641. doi: 10.1111/apha.12200 [DOI] [PubMed] [Google Scholar]
- Dirks ML, Wall BT, van de Valk B, Holloway TM, Holloway GP, Chabowski A, . . . van Loon LJ (2016). One Week of Bed Rest Leads to Substantial Muscle Atrophy and Induces Whole-Body Insulin Resistance in the Absence of Skeletal Muscle Lipid Accumulation. Diabetes, 65(10), 2862–2875. doi: 10.2337/db15-1661 [DOI] [PubMed] [Google Scholar]
- Dunstan DW, Kingwell BA, Larsen R, Healy GN, Cerin E, Hamilton MT, . . . Owen N (2012). Breaking up prolonged sitting reduces postprandial glucose and insulin responses. Diabetes Care, 35(5), 976–983. doi: 10.2337/dc11-1931 [DOI] [PMC free article] [PubMed] [Google Scholar]
- Evans WJ (2002). Effects of exercise on senescent muscle. Clin Orthop Relat Res(403 Suppl), S211–220. [DOI] [PubMed] [Google Scholar]
- Evans WJ (2010). Skeletal muscle loss: cachexia, sarcopenia, and inactivity. Am J Clin Nutr, 91(4), 1123S–1127S. doi:ajcn.2010.28608A [pii] 10.3945/ajcn.2010.28608A [DOI] [PubMed] [Google Scholar]
- Fiatarone MA, O’Neill EF, Ryan ND, Clements KM, Solares GR, Nelson ME, . . . Evans WJ (1994). Exercise training and nutritional supplementation for physical frailty in very elderly people. N Engl J Med, 330(25), 1769–1775. doi: 10.1056/nejm199406233302501 [DOI] [PubMed] [Google Scholar]
- Fielding RA (1995). Effects of exercise training in the elderly: impact of progressive- resistance training on skeletal muscle and whole-body protein metabolism. Proc Nutr Soc, 54(3), 665–675. [DOI] [PubMed] [Google Scholar]
- Finnerty CC, McKenna CF, Cambias LA, Brightwell CR, Prasai A, Wang Y, . . . Fry CS (2017). Inducible satellite cell depletion attenuates skeletal muscle regrowth following a scald-burn injury. J Physiol, 595(21), 6687–6701. doi: 10.1113/jp274841 [DOI] [PMC free article] [PubMed] [Google Scholar]
- Fisher SR, Goodwin JS, Protas EJ, Kuo YF, Graham JE, Ottenbacher KJ, & Ostir GV (2011). Ambulatory activity of older adults hospitalized with acute medical illness. J Am Geriatr Soc, 59(1), 91–95. doi: 10.1111/j.1532-5415.2010.03202.x [DOI] [PMC free article] [PubMed] [Google Scholar]
- Frontera WR, Meredith CN, O’Reilly KP, & Evans WJ (1990). Strength training and determinants of VO2max in older men. J Appl Physiol (1985), 68(1), 329–333. doi: 10.1152/jappl.1990.68.1.329 [DOI] [PubMed] [Google Scholar]
- Galvan E, Arentson-Lantz E, Lamon S, & Paddon-Jones D (2016). Protecting Skeletal Muscle with Protein and Amino Acid during Periods of Disuse. Nutrients, 8(7). doi: 10.3390/nu8070404 [DOI] [PMC free article] [PubMed] [Google Scholar]
- Glover EI, & Phillips SM (2010). Resistance exercise and appropriate nutrition to counteract muscle wasting and promote muscle hypertrophy. Curr Opin Clin Nutr Metab Care, 13(6), 630–634. doi: 10.1097/MCO.0b013e32833f1ae5 [DOI] [PubMed] [Google Scholar]
- Healy GN, Dunstan DW, Salmon J, Cerin E, Shaw JE, Zimmet PZ, & Owen N (2007). Objectively measured light-intensity physical activity is independently associated with 2-h plasma glucose. Diabetes Care, 30(6), 1384–1389. doi: 10.2337/dc07-0114 [DOI] [PubMed] [Google Scholar]
- Healy GN, Dunstan DW, Salmon J, Cerin E, Shaw JE, Zimmet PZ, & Owen N (2008). Breaks in sedentary time: beneficial associations with metabolic risk. Diabetes Care, 31(4), 661–666. doi: 10.2337/dc07-2046 [DOI] [PubMed] [Google Scholar]
- Hirsch CH, Sommers L, Olsen A, Mullen L, & Winograd CH (1990). The natural history of functional morbidity in hospitalized older patients. J Am Geriatr Soc, 38(12), 1296–1303. [DOI] [PubMed] [Google Scholar]
- Landefeld CS, Palmer RM, Kresevic DM, Fortinsky RH, & Kowal J (1995). A randomized trial of care in a hospital medical unit especially designed to improve the functional outcomes of acutely ill older patients. N Engl J Med, 332(20), 1338–1344. doi: 10.1056/nejm199505183322006 [DOI] [PubMed] [Google Scholar]
- Lewis ZH, Ottenbacher KJ, Fisher SR, Jennings K, Brown AF, Swartz MC, & Lyons EJ (2016). Testing Activity Monitors’ Effect on Health: Study Protocol for a Randomized Controlled Trial Among Older Primary Care Patients. JMIR Res Protoc, 5(2), e59. doi: 10.2196/resprot.5454 [DOI] [PMC free article] [PubMed] [Google Scholar]
- Mahoney JE, Sager MA, & Jalaluddin M (1999). Use of an ambulation assistive device predicts functional decline associated with hospitalization. J Gerontol A Biol Sci Med Sci, 54(2), M83–88. [DOI] [PubMed] [Google Scholar]
- Melov S, Tarnopolsky MA, Beckman K, Felkey K, & Hubbard A (2007). Resistance exercise reverses aging in human skeletal muscle. PLoS One, 2(5), e465. doi: 10.1371/journal.pone.0000465 [DOI] [PMC free article] [PubMed] [Google Scholar]
- Parise G, & Yarasheski KE (2000). The utility of resistance exercise training and amino acid supplementation for reversing age-associated decrements in muscle protein mass and function. Curr Opin Clin Nutr Metab Care, 3(6), 489–495. [DOI] [PubMed] [Google Scholar]
- Ploutz-Snyder LL, Downs M, Ryder J, Hackney K, Scott J, Buxton R, . . . Crowell B (2014). Integrated resistance and aerobic exercise protects fitness during bed rest. Med Sci Sports Exerc, 46(2), 358–368. doi: 10.1249/MSS.0b013e3182a62f85 [DOI] [PubMed] [Google Scholar]
- Reidy PT, McKenzie AI, Brunker P, Nelson DS, Barrows KM, Supiano M, . . . Drummond MJ (2017). Neuromuscular Electrical Stimulation Combined with Protein Ingestion Preserves Thigh Muscle Mass But Not Muscle Function in Healthy Older Adults During 5 Days of Bed Rest. Rejuvenation Res, 20(6), 449–461. doi: 10.1089/rej.2017.1942 [DOI] [PMC free article] [PubMed] [Google Scholar]
- Sager MA, Franke T, Inouye SK, Landefeld CS, Morgan TM, Rudberg MA, . . . Winograd CH (1996). Functional outcomes of acute medical illness and hospitalization in older persons. Arch Intern Med, 156(6), 645–652. [PubMed] [Google Scholar]
- Suesada MM, Martins MA, & Carvalho CR (2007). Effect of short-term hospitalization on functional capacity in patients not restricted to bed. Am J Phys Med Rehabil, 86(6), 455–462. doi: 10.1097/PHM.0b013e31805b7566 [DOI] [PubMed] [Google Scholar]
- Symons TB, Sheffield-Moore M, Chinkes DL, Ferrando AA, & Paddon-Jones D (2009). Artificial gravity maintains skeletal muscle protein synthesis during 21 days of simulated microgravity. J Appl Physiol, 107(1), 34–38. doi:91137.2008 [pii] 10.1152/japplphysiol.91137.2008 [DOI] [PMC free article] [PubMed] [Google Scholar]
- Tai MM (1994). A mathematical model for the determination of total area under glucose tolerance and other metabolic curves. Diabetes Care, 17(2), 152–154. [DOI] [PubMed] [Google Scholar]
- U.S. Department of Health and Human Services. Physical activity guidelines advisory committee report, 2008. Washington, DC: U.S. Department of Health and Human Services; 2008. [Google Scholar]
- Wall BT, Dirks ML, Snijders T, Senden JM, Dolmans J, & van Loon LJ (2014). Substantial skeletal muscle loss occurs during only 5 days of disuse. Acta Physiol (Oxf), 210(3), 600–611. doi: 10.1111/apha.12190 [DOI] [PubMed] [Google Scholar]
- Wall BT, Dirks ML, Snijders T, Stephens FB, Senden JM, Verscheijden ML, & van Loon LJ (2015). Short-term muscle disuse atrophy is not associated with increased intramuscular lipid deposition or a decline in the maximal activity of key mitochondrial enzymes in young and older males. Exp Gerontol, 61, 76–83. doi: 10.1016/j.exger.2014.11.019 [DOI] [PubMed] [Google Scholar]