

Summary
Approximately half of human genes generate mRNAs with alternative 3′ untranslated regions (3′UTRs). Through 3′UTR-mediated protein-protein interactions, alternative 3′UTRs enable multi-functionality of proteins with identical amino acid sequence. While studying how information on protein features is transferred from 3′UTRs to proteins, we discovered that the broadly expressed RNA-binding protein TIS11B forms a membrane-less organelle, called TIS granule that enriches membrane protein-encoding mRNAs with multiple AU-rich elements. TIS granules form a reticular meshwork intertwined with the endoplasmic reticulum (ER). The association between TIS granules and the ER creates a subcellular compartment – the TIGER domain – with a biophysically and biochemically distinct environment from the cytoplasm. This compartment promotes 3′UTR-mediated interaction of SET with membrane proteins, thus allowing increased surface expression and functional diversity of proteins, including CD47 and PD-L1. The TIGER domain is a subcellular compartment that enables formation of specific and functionally relevant protein-protein interactions that cannot be established outside.
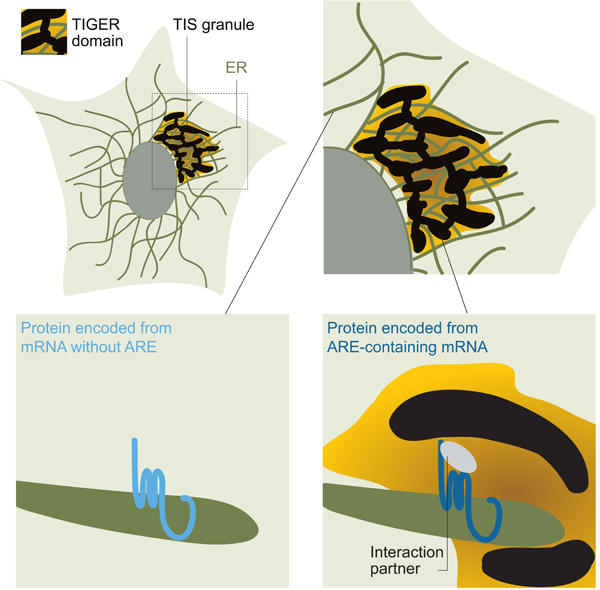
Graphical Abstract
Introduction
Membrane-bound and membrane-less organelles create intracellular compartments to achieve spatiotemporal control of biochemical reactions in the densely packed cellular space (Banani et al., 2017; Shin and Brangwynne, 2017; Kato and McKnight, 2018). Membrane-less organelles –also called biomolecular condensates – can be liquid-like, gel-like, or solid (Brangwynne et al., 2009; Frey et al., 2006; Boke et al., 2016). They have diverse molecular compositions that endow them with distinct physical properties (Nott et al., 2015; Zhang et al., 2015; Nott et al., 2016; Su et al., 2016). By enabling inclusion or exclusion of reactants, membrane-less organelles create specific environments that increase the efficiency of cellular processes, including signaling and the addition of post-translational modifications (Li et al., 2012; Su et al., 2016).
One type of membrane-less organelle are RNA granules that contain mRNA transcripts packaged into ribonucleoprotein assemblies (Han et al., 2012). RNA granules described so far typically have sphere-like shapes and form through phase-transitions driven by scaffolding proteins with intrinsically disordered regions (IDRs) (Han et al., 2012; Kato et al., 2012; Nott et al., 2015; Banani et al., 2017; Shin and Brangwynne, 2017; Kato and McKnight, 2018). However, in many cases, the biochemical reactions favored or disfavored by RNA granules are not known (Banani et al., 2017).
The perinuclear localized rough endoplasmic reticulum (ER) is the major site of protein synthesis of membrane proteins (Reid and Nicchitta, 2015). During translation, mRNAs and their encoded proteins come into proximity. This facilitates the formation of 3′UTR-mediated protein-protein interactions (Berkovits and Mayr, 2015; Chartron et al., 2016; Mayr, 2017). For example, in yeast, it was demonstrated that signal recognition particle (SRP) is recruited to ribosomes that translate membrane proteins even before the signal sequence had become exposed from the ribosome. SRP recruitment was accomplished by 3′UTRs of messages that encode plasma membrane proteins, but not by other 3′UTRs (Chartron et al., 2016).
In human cells, more than half of genes generate mRNA isoforms with alternative 3′UTRs (Lianoglou et al., 2013) that can potentially regulate alternative protein complex formation (Mayr, 2018). This was first demonstrated for CD47 membrane protein (Berkovits and Mayr, 2015). It was found that the effector protein SET only interacts with CD47 protein that was encoded by the long 3′UTR isoform (CD47-LU), but not with the protein that was encoded by the short 3′UTR isoform (CD47-SU), despite their identical amino acid sequences (Figure 1A). SET is a highly acidic protein with a multitude of functions that interacts with positively charged amino acids in the cytoplasmic domains of CD47-LU (Li et al., 1996; ten Klooster et al., 2007; Berkovits and Mayr, 2015). The 3′UTR-mediated binding of SET to CD47-LU is functionally relevant and results in several downstream consequences, including higher CD47 plasma membrane expression, thus, protecting cells better from phagocytosis by macrophages (Berkovits and Mayr, 2015).
Figure 1. TIS11B assemblies have a reticular pattern and are intertwined with the ER.

(A) The interaction between SET and CD47-LU protein is 3′UTR-dependent, as CD47-SU does not interact with SET. It is unknown how SET is transferred from the 3′UTR to the protein.
(B) Fluorescent confocal microscopy of endogenous TIS11B protein in HeLa cells. Transfected GFP-SEC61B visualizes the ER and DAPI stains the nucleus. Two representative cells are shown. Right panel shows higher magnification of demarcated region.
(C) Confocal live cell imaging (Airyscan) of HeLa cells after transfection of mCherry (mC)-TIS11B and of GFP-SEC61B to visualize the ER. Shown are three different magnifications. The arrow indicates the plane used for line profile generation.
(D) 3D-reconstruction of confocal images, shown as in (C). See also Figure S1.
These observations indicated that 3′UTRs contain genetic information that can be transmitted to proteins through the formation of 3′UTR-dependent protein-protein interactions and imply that the transfer of genetic information from DNA to proteins does not exclusively happen through the translation of mRNAs into the amino acid sequence of proteins (Crick, 1958; Mayr, 2017). However, the mechanism of information transfer from 3′UTRs to proteins is currently unclear.
Here, we set out to investigate how SET is transferred from the mRNA to the protein (Figure 1A). In the course of these studies, we discovered a membrane-less organelle, called TIS granule that is formed through physiological assembly of the RNA-binding protein TIS11B. TIS granules form a large reticular meshwork that is intertwined with the ER. They enrich or exclude specific mRNAs and proteins, and they enable the translation of specific mRNAs at a subdomain of the ER defined by presence of the TIS granules. The association of TIS granules with the ER creates a subcellular compartment with special properties that is necessary and sufficient for SET transfer from mRNAs to proteins, and thus, for the 3′UTR-dependent interaction of SET, and likely other proteins, with membrane proteins.
Results
TIS11B forms reticular assemblies that are intertwined with the ER
We previously showed that the long 3′UTR of CD47 (LU) is required to establish the protein-protein interaction between SET and CD47-LU, whereas the short CD47 3′UTR (SU) isoform is unable to do so (Figure 1A). The RNA-binding protein HuR is necessary for 3′UTR-mediated CD47 plasma membrane localization as it binds to LU and recruits SET. However, HuR is not sufficient as it is only partially able to mediate this process (Berkovits and Mayr, 2015). This led us to hypothesize that additional RNA-binding proteins cooperate with HuR in establishing the protein-protein interaction between SET and CD47-LU. As SET binding to CD47-LU protein occurs at the site of translation, we hypothesized that the unknown RNA-binding protein localizes to the ER surface.
We screened the subcellular localization of several RNA-binding proteins using immunostaining (Figure S1A). TIS11B (also called ZFP36L1) is widely expressed across human tissues and cell types (Figure S1B) (Lianoglou et al., 2013). In several mouse and human cell lines, we found that endogenous TIS11B protein forms peri-nuclear assemblies that are several µm large and cover a substantial portion of the ER (Figures 1B and S1C). To evaluate the relationship between TIS11B and the ER, we performed live cell imaging using a confocal microscope. In addition to soluble TIS11B in the cytoplasm, we observed that TIS11B assemblies form a meshwork that is intertwined with the ER (Figures 1C and S1D). This is in contrast to many previously described biomolecular condensates that are usually sphere-like (Figure S1D).
Like endogenous TIS11B, overexpressed TIS11B forms assemblies that are associated with a portion of the per-inuclear ER. However, in cells that highly express TIS11B, either through experimental overexpression or endogenously, it forms huge assemblies that cover almost all peri-nuclear ER areas (Figures S1C and S1D). Time lapse microscopy showed association of ER and TIS11B assemblies despite dynamic movement of the ER (Video S1). 3D-reconstruction of the images showed that TIS11B assemblies have tubule-like structures that look similar to the ER, but are more bulky (Figures 1D and S1E). TIS11B assemblies embrace ER tubules (Figure S1F) and the three-dimensional organization of TIS11B assemblies and the ER allows them to share a large amount of surface area. To assess if TIS11B assemblies are liquid-like or more solid, we perfor med fluorescence recovery after photobleaching (FRAP). The slow fluorescence recovery suggests a gel-like state of the TIS11B assemblies (Figure S1G).
Membrane protein-encoding mRNAs that contain multiple AREs in their 3′UTRs are enriched in TIS granules
As TIS11B is an RNA-binding protein known to bind to AU-rich elements (AREs) (Stoecklin et al., 2002; Lykke-Andersen and Wagner, 2005; Hodson et al., 2010), we performed RNA-FISH on SU and LU mRNAs to investigate the relationship between CD47 mRNAs and TIS11B assemblies. LU mRNA contains 22 AREs with 19 of them located in the 3′UTR and is strongly enriched in the region of the TIS11B assemblies (Figures 2A, 2B, and S2A). Higher resolution RNA-FISH showed that LU mRNA localized to TIS11B assemblies as well as to their surface (Figure S2B). In contrast, SU mRNA, which contains four AREs with one of them located in the 3′UTR, does not preferentially co-localize with TIS11B and is mostly located at other regions of the ER (Figures 2A, 2C, S2A, and S2C). To quantify the extent of enrichment or exclusion of mRNAs with respect to TIS11B assemblies, we created line diagrams of the fluorescence intensities of the mRNAs and the TIS11B assemblies. The correlation coefficients of the fluorescence intensities confirm that SU mRNA is not significantly enriched in the TIS11B assemblies, whereas LU mRNA strongly co-localizes with TIS11B assemblies (Figures 2B–D). As TIS11B assemblies enrich LU mRNA, we call them TIS granules, because they have the characteristics of RNA granules.
Figure 2. TIS granules enrich membrane protein-encoding mRNAs with AREs in a 3′UTR-dependent manner.

(A) GFP-tagged constructs used for RNA-FISH are drawn to scale. Red stars indicate AREs. S, signal peptide.
(B) Representative images obtained from RNA-FISH (green) against GFP after transfection of GFP-CD47-LU in HeLa cells. BFP-TIS11B (red) was co-transfected. The white dotted line demarcates the nucleus. Bottom panel shows higher magnification of indicated region. Right panels show line profiles (generated as in Figure 1C) of fluorescence intensities including Pearson′s correlation coefficients (r).
(C) As in (B), but after transfection of GFP-CD47-SU.
(D) Pearson′s correlation coefficients of line profiles of TIS11B and the indicated mRNAs. N, number of line profiles. Mann Whitney test, ***, P < E-14, **, P = E-6, NS, not significant.
(E) As in (B), but after transfection of GFP-CD274-UTR or GFP-CD274-NU.
(F) As in (B), but after transfection of GFP-BCL2-LU or GFP-BCL2-NU. See also Figure S2.
We then asked if other ARE-containing mRNAs that encode membrane proteins co-localize with TIS granules. We examined two additional messages (BCL2 and CD274, encoding PD-L1) that contain multiple AREs in their 3′UTRs (Figures 2A, S2A and S2D). For both mRNAs, the presence of their respective 3′UTRs was necessary for their enrichment in TIS granules, as expression of the messages without 3′UTRs (-NU (no UTR), but with a polyadenylation signal) resulted in their exclusion from the TIS granule region (Figures 2D–F). This showed that all three tested membrane protein-encoding mRNAs with several AREs in their 3′UTRs predominantly localize to TIS granules.
We next examined the localization of an mRNA lacking both features and used the TP53 mRNA that does not encode a membrane protein and does not contain any ARE in its 3′UTR. In the presence or absence of its corresponding 3′UTR TP53 mRNA was excluded from the TIS granule region, but increased its co-localization when instead a 3′UTR containing several AREs was used (Figures 2D, S2A, S2D, and S2E). To further assess the importance of AREs for mRNA co-localization with TIS granules, we next examined ARE-containing mRNAs that do not encode membrane proteins. We tested three pairs of mRNAs containing 13, 7, and 5 AREs in their respective 3′UTRs and compared mRNA localization in the presence or absence of their 3′UTRs. In the presence of the respective 3′UTRs the mRNAs co-localized with TIS11B in a subset of cells, whereas absence of the 3′UTRs resulted in their exclusion (Figures 2D, S2A, S2D, and S2F–H).
Taken together, mRNAs that combine both features, namely the presence of multiple AREs in their 3′UTRs and the presence of at least one region that encodes a transmembrane domain, are enriched in TIS granules (Figure 2D), whereas in the absence of both features all tested mRNAs (6/6) are excluded from TIS granules. Moreover, the total number of AREs in the mRNA correlates with the extent of co-localization, especially when this number is multiplied by two upon presence of a transmembrane domain (Figures S2A and S2I). Other features within mRNAs, including the number of transmembrane domains, mRNA length, GC content or ARE density showed weaker correlations with TIS granule colocalization (Figures S2A and S2J). Our data indicate that 3′UTR elements determine the localization of membrane protein-encoding mRNAs to a membrane-less organelle, and thus, to a specific subcellular compartment. The 3′UTR-based subcellular mRNA sorting occurs in addition to the well-described 3′UTR function in mRNA localization to very specialized cellular sites such as dendrites or synapses in neuronal cells (Mori et al., 2000; Mayr, 2018).
TIS granules enrich specific proteins
After having established that specific mRNAs are enriched or excluded from TIS granules, we next investigated this feature for proteins. HuR is an RNA-binding protein known to bind to AREs (Fan and Steitz, 1998). HuR mostly localizes to the nucleus and is only lowly expressed in the cytoplasm. However, strikingly, cytoplasmic HuR was enriched in the TIS granule region (Figure 3A).
Figure 3. TIS granules enrich specific proteins.

(A) Confocal live cell imaging (Airyscan) of HeLa cells after transfection of mC-TIS11B (red) and GFP-HuR (green). The white dotted line demarcates the nucleus. Line profile as in Figure 2B.
(B) As in (A) but after transfection of GFP-TIS11B (red) and mC-HSPA8 (green).
(C) Pearson′s correlation coefficients of line profiles of TIS11B and the indicated proteins. N, number of line profiles. See also Figure S3A.
As translation of membrane proteins at the ER requires folding of the polypeptide chains, we next investigated the localization of chaperones with respect to TIS granules. HSPA8 (also called HSC70) is known as constitutively expressed cytosolic chaperone that assists the folding of the majority of nascent peptides, whereas NACA is a ribosome-associated chaperone (Hartl and Hayer-Hartl, 2002). We found only slight enrichment of NACA, but strong enrichment of HSPA8 in the TIS granule region (Figures 3B and S3A). The increased concentration of chaperones in the TIS11B-defined ER domain may enable more efficient folding of membrane proteins translated within this region. Enrichment of HuR, HSPA8 and NACA in the TIS granule region was consistently observed in all cells investigated, demonstrated by the correlation coefficients of the fluorescence intensities (Figure 3C). In summary, TIS11B generates reticular assemblies that are intertwined with the ER and that enrich specific mRNAs and proteins. We next investigated the function of the TIS granules and asked if they are involved in SET transfer from LU to CD47-LU.
TIS11B is necessary for 3′UTR-dependent interaction between SET and CD47-LU and for subsequent surface localization of CD47-LU
As LU mRNA was enriched in the TIS granule region, we investigated if TIS11B was necessary for the formation of the 3′UTR-dependent interaction between SET and CD47-LU protein. shRNA-mediated knock-down of either HuR or TIS11B abolished binding of endogenous SET to CD47-LU protein, as shown by co-immunoprecipitation (co-IP) of GFP-CD47-LU, indicating that TIS11B is required for the 3′UTR-mediated binding of SET to CD47 (Figures 4A, S3B, and S3C). TIS11B is also necessary for the functional consequences of SET binding to CD47-LU as depletion of TIS11B reduced endogenous CD47 surface expression but did not affect overall CD47 protein expression (Figure 4B). The reduction was partial and was similar to the previously observed reductions after SET or HuR knock-down (Figures S3B–F). This was expected as CD47 localizes to the plasma membrane in a 3′UTR-dependent as well as - independent manner (Berkovits and Mayr, 2015). Taken together, we demonstrated that in addition to SET and HuR, expression of TIS11B is necessary for the 3′UTR-mediated increase in surface localization of CD47.
Figure 4. TIS11B is required for 3′UTR-mediated cell surface localization of CD47 and interaction of SET with CD47-LU.

(A) Co-IP of endogenous SET using GFP-Trap after transfection of GFP-CD47-LU into HeLa cells stably expressing the indicated shRNAs. 2.5 % of input was loaded. TUBULIN was used as additional loading control. shRNA Ctrl, control shRNA.
(B) FACS analysis of endogenous CD47 in HeLa cells stably expressing the indicated shRNAs. Mean fluorescent intensity (MFI) values are shown in parentheses. Shown is a representative experiment. Right panel shows mean ± SD of five biological replicates. t-test, ***, P < 0.001.
(C) Sequence of TNFα ARE.
(D) RNA pulldown of indicated biotinylated RNA oligonucleotides and western blot analysis of endogenous proteins in HeLa cells. 2.5 % of input was loaded. Mock, no RNA was transfected. ARE-1 and ARE-2 differ in the restriction sites used for cloning. HNRNPA1 specifically binds to SU1. TUBULIN served as loading control.
(E) FACS analysis of GFP after transfection of the indicated constructs into HeLa cells, shown as in (B). Bottom panel shows surface and total GFP expression as mean ± SD of five biological replicates. t-test, ***, P < 0.001.
(F) Co-IP of endogenous SET using GFP-Trap after transfection of the indicated constructs into HeLa cells. 2.5 % of input was loaded.
(G) Western blot of the indicated endogenous proteins in HeLa cells stably expressing TIS11B shRNA1. See also Figure S3B–I.
As both RNA-binding proteins – HuR and TIS11B – are known to bind to AREs and as AREs in the 3′UTRs of mRNAs were required for their enrichment in TIS granules, we next investigated if the presence of a repeated ARE is sufficient for 3′UTR-mediated SET binding and subsequent surface localization of CD47-LU. We used a short 3′UTR that contains six concatenated AREs that is naturally present in the 3′UTR of TNFα (Figure 4C). Both HuR and TIS11B bind to the TNFα ARE, but they do not bind to SU1, a size-matched 3′UTR fragment from the 3′ end of SU (Figure 4D). Strikingly, replacement of the long 3′UTR of CD47 – which is over 4 kilobases long – with the ARE of TNFα in the context of the GFP-CD47 construct showed that the TNFα ARE was able to fully recapitulate 3′UTR-dependent surface localization of CD47 (Figure 4E). Furthermore, as was shown by co-IP, the TNFα ARE mediated SET binding to GFP-CD47 in a similar manner as was accomplished by LU (Figure 4F). These data show that a short 3′UTR containing several AREs is sufficient for 3′UTR-mediated SET binding and the subsequent increase in CD47 surface localization. The function of this ARE is mediated by HuR and TIS11B, as other known ARE-binding proteins (Barreau et al., 2005), including KHSRP and FXR1, did not bind to the TNFα ARE in a specific manner and did not influence surface localization of endogenous CD47 (Figures 4D, S3C, and S3G–I).
Although the known function of TIS11B is the destabilization of specific mRNAs (Lykke-Andersen and Wagner, 2005), knock-down of TIS11B did not affect endogenous CD47 protein expression level (Figures 4B and 4G). It did also not affect protein expression of the other known factors involved in 3′UTR-mediated CD47 cell surface localization, including HuR and SET (Figure 4G). This suggested that TIS11B may create a special environment that enables SET transfer.
Overexpression of TIS11B, but not overexpression of SET, increases 3′UTR-mediated surface localization of CD47-LU
In most cases, the extent of protein interaction increases upon overexpression of the two interacting proteins. However, this is not the case upon overexpression of SET and CD47-LU. Instead, expression of TIS11B promotes the interaction of SET and CD47-LU as it increased 3′UTR-mediated cell surface localization by two-fold (Figures 5A–C). This supports the hypothesis that TIS11B generates a permissive environment for SET transfer. To gain insights into the relationship between TIS granules and SET, we used confocal microscopy to assess the localization of SET protein with respect to TIS granules.
Figure 5. Model of TIS granule-mediated protein-protein interactions.

(A) FACS analysis of surface and total GFP in HeLa cells after transfection of GFP-CD47-LU together with mC (grey) or mC-SET (green). Representative plots are shown.
(B) As in (A), but after transfection of mC-TIS11B (blue).
(C) Surface and total GFP-CD47-LU expression from (A) and (B) shown as mean ± SD of three biological replicates. t-test, ***, P < 0.001.
(D) Confocal live cell imaging (Airyscan) of HeLa cells after transfection of GFP-TIS11B (red) and mC-SET (green), shown as in Figure 3A.
(E) Pearson′s correlation coefficients of line profiles of TIS11B and SET. N, number of line profiles.
(F) Model, see text. The TIGER domain is a new subcellular compartment created by the association of TIS granules and the ER. See also Figure S3J.
In contrast to HuR and HSPA8 (Figure 3), SET showed a very different localization pattern. SET is uniformly expressed in the cytoplasm, but it was anti-correlated with TIS11B in the TIS granule region (Figure 5D). Although SET was not completely absent from the granule (note that the line graph for SET does not reach zero), SET expression was especially reduced in dense granules, showing that SET is relatively excluded from TIS granules (Figures 5D and 5E).
Taken all the data together, we propose the following model (Figure 5F). Membrane protein-encoding mRNAs (such as SU) are translated at the ER (Figure S2C). If membrane protein-encoding mRNAs contain multiple AREs in their 3′UTRs, as was the case for LU, CD274-UTR, and BCL2-LU, they will bind to TIS11B and localize to the TIS granule. TIS11B assembly results in the acquisition of new properties, also called collective properties (Alberti, 2017), as TIS granules are able to enrich or exclude specific proteins. TIS granules are associated with a portion of the rough ER. We propose that functional interaction between the ER and TIS granules creates a new subcellular compartment that we call the TIGER (TIS granule-ER) domain. Our data suggest that specific mRNAs with several AREs in their 3′UTRs are translated in the TIGER domain (Figure S3J). Translation within this special environment enables the formation of specific protein-protein interactions, as shown for binding of SET to CD47-LU. Importantly, these protein-protein interactions cannot be established outside the TIGER domain.
It is currently unclear how the special environment created by the TIGER domain enables the interaction between SET and CD47-LU. As the TIS granules are intertwined with the ER, their three-dimensional organization seems to keep SET confined to the region between the TIS granules and the ER, which we call the inter-organelle space. This may increase the local concentration of SET at the ER surface and it may reduce the degrees of freedom of SET movement. Entrapment of SET at the ER surface could facilitate the formation of protein-protein interactions between SET and CD47, thus enabling SET-mediated downstream functions of CD47 protein.
TIS granules are necessary and sufficient for the protein-protein interaction between SET and membrane proteins
We next set out to experimentally test the predictions of our model. The model postulates that the protein-protein interaction between SET and membrane proteins can only be established within the TIGER domain. If this is true, SET should bind also to CD47-SU, if CD47-SU is translated within the TIGER domain. In cells that highly express TIS11B, TIS granules cover the entire peri-nuclear ER (Figure S1D). In these cells, also SU mRNA localizes to TIS granules (Figure 6A), indicating that the entire rough ER is converted into the TIGER domain. Intriguingly, as shown by co-IP, in these cells SET interacts with CD47-SU (Figure 6B). Moreover, SET binding to CD47-SU is functional as it increases surface localization of CD47-SU (Figure 6C). As overexpression of HuR was not sufficient for the interaction between SET and CD47-SU (Figure 6B), these findings demonstrate that the TIGER domain is necessary and sufficient to mediate the protein-protein interaction of SET with membrane proteins.
Figure 6. The TIGER domain is necessary and sufficient for the protein-protein interaction between SET and membrane proteins.

(A) RNA-FISH as in Figure 2C, but cells with high TIS11B expression were selected.
(B) Co-IP of endogenous SET after transfection of GFP-CD47-SU in HeLa cells. GFP-Trap was performed after expression of mC, mC-HuR or high expression of mC-TIS11B. 2.5 % of input was loaded. TUBULIN is shown as loading control.
(C) FACS analysis of surface GFP after transfection of GFP-CD47-SU in HeLa cells, in the presence of mC (grey) or in the presence of mC-TIS11B (blue). Cells with high mC-TIS11B expression were analyzed and shown as in Figure 5B. Right panel shows mean ± SD of three biological replicates. t-test, ***, P < 0.001.
(D) Co-IP of endogenous SET using GFP-Trap after transfection of GFP-CD274-UTR or GFP-CD274-NU into HeLa cells. 2.5 % of input was loaded.
(E) As in (C), but after transfection of GFP-CD274-UTR (blue) or GFP-CD274-NU (grey) into HeLa cells. Endogenous TIS11B expression was used.
We next tested if SET interacts also with membrane proteins other than CD47. CD274 mRNA contains 14 AREs in its 3′UTR and encodes PD-L1 (Figure 2A). Only the 3′UTR-containing mRNA was enriched in the TIS granule region (Figures 2D and 2E) and SET only interacted with PD-L1 protein that was encoded by CD274-UTR mRNA and not by CD274-NU (Figure 6D), supporting the model that the protein-protein interaction only occurs in the TIGER domain. Presence of the 3′UTR led to a four-fold increase in surface expression of PD-L1 (Figure 6E). As endogenous CD274 mRNA has a constitutive 3′UTR, our data suggest that the 3′UTR of CD274 optimizes surface localization of PD-L1 in a post-translational manner.
TIS11B assembly is charge pattern-driven and is required for 3′UTR-mediated protein-protein interactions
Another prediction of the model is that TIS11B assembly is required for the formation of protein-protein interactions, as only assembled TIS11B has acquired the ability to enrich or exclude proteins in the TIS granule region. To test this prediction, we investigated the molecular features responsible for TIS11B assembly. Most biomolecular condensates described so far are formed by proteins that contain IDRs (Han et al., 2012; Kato et al., 2012; Nott et al., 2015; Banani et al., 2017; Shin and Brangwynne, 2017; Kato and McKnight, 2018). TIS11B contains a moderate IDR at its C-terminus (Figure S4A) (Dosztanyi et al., 2005). Deletion of the IDR increased nuclear localization of TIS11B to some extent, but did not affect TIS11B assembly (Figures 7A and 7B). Moreover, it had little influence on CD47-LU surface localization (Figure 7C).
Figure 7. TIS11B is the scaffold of TIS granules whose assembly is charge pattern-driven.

(A) Net charge distribution of protein sections of wild-type (WT) and mutant TIS11B. RBD, RNA-binding domain, IDR, intrinsically disordered domain, CPM, charge pattern mutant. See also Figure S4B, S4C.
(B) Confocal live cell imaging of HeLa cells after transfection of the indicated constructs described in (A) fused to mC together with GFP-SEC61B to visualize the ER.
(C) FACS analysis of GFP after transfection of GFP-CD47-LU and the constructs from (A) fused to mC into HeLa cells. Normalized GFP expression (MFI values) shown as mean ± SD of five biological replicates. t-test, ***, P < 0.001.
(D) RNA-FISH as in Figure 2B against GFP-CD47-LU mRNA after co-transfection of BFP-labeled WT or CPM2 TIS11B (red) in HeLa cells with stable knock-down of endogenous TIS11B.
(E) Pearson′s correlation coefficients of line profiles of TIS11B and the indicated mRNAs from (D) and Figure S5B, shown as in Figure 2D. Mann Whitney test, ***, P < E-21.
(F) Confocal microscopy of mC-tagged WT or CPM2 TIS11B and GFP-tagged HSPA8 in HeLa cells with stable knock-down of endogenous TIS11B, shown as in Figure 3B. mC was used as control.
(G) Pearson′s correlation coefficients of line profiles of TIS11B and the indicated proteins from (F) and Figures S5C and S5D, shown as in Figure 2D. Mann Whitney test, ***, P < E-12.
(H) FRAP of GFP-SET in the TIS granule region (mC-TIS11B) or in the cytoplasm located outside of TIS granules, performed in HeLa cells. Mean fluorescence ± SD from 40 different granule and cytoplasmic regions from 21 cells is shown. Mann Whitney test, P = E-41.
(I) Confocal imaging of HeLa cells after transfection of GFP-TIS11B (red) and mC-SET (green). Bottom panel, cells were fixed and permeabilized for 1 hour. The white dotted line demarcates the nucleus. Shown are representative images. See also Figures S4, S5, S6, S7, and Table S1.
We noticed that TIS11B has a very particular charge distribution. The net charge of the N-terminal half of the protein is highly positive, whereas the C-terminal half is highly negative (Figures 7A and S4B). Distortion of the charge pattern distribution through the introduction of point mutations (Figures 7A and S4C) in charge pattern mutant (CPM) 2 abolished TIS11B assembly (Figures 7B, S4D and Table S1), and prevented the increase in surface localization of CD47-LU accomplished by overexpression of TIS11B (Figure 7C). Mutation of non-charged amino acids, such as serines, had no effect on TIS11B assembly or surface localization of CD47-LU (CPM1 vs CPM4, Figures S4C–F and Table S1). Importantly, restoration of the charge pattern through point mutations with opposite effects rescued both TIS11B assembly and 3′UTR-mediated CD47-LU surface localization (CPM3, Figures 7A–C, S4C, S4D, and Table S1). As all TIS11B CPMs had expression levels similar to wild-type TIS11B (Figure S4G), their effects on CD47-LU surface localization were not due to decreased expression.
TIS11B is the scaffold of TIS granules
As the CPM2 mutant abrogated TIS11B assembly, it allowed us to examine if TIS11B is the protein responsible for TIS granule formation. To test if TIS11B acts as scaffold or client of TIS granules, we knocked-down endogenous TIS11B (Figure S5A) and replaced it either with tagged wild-type TIS11B or tagged CPM2 TIS11B. We repeated the RNA-FISH for LU and CD274-UTR mRNAs and observed again strong enrichment with TIS granules formed by wild-type TIS11B, but complete loss of local mRNA enrichment in the case of mutant TIS11B (Figures 7D, 7E, and S5B). Similarly, we no longer observed enrichment of HuR, HSPA8 or NACA in the peri-nuclear region in the case of mutant TIS11B (Figures 7F, 7G, S5C, and S5D). This shows that TIS11B is the responsible protein for TIS granule formation, demonstrating that TIS11B is the scaffold of TIS granules.
Notably, the point mutations in CPM2 that abrogated TIS granule formation preserved RNA binding and the function of TIS11B with respect to mRNA destabilization as shown by its repressive effect on protein levels (Figures S4H–K). Taken together, these experiments demonstrated that TIS11B assembly is not caused by the presence of the IDR, but instead is charge pattern driven. Importantly, regulation of mRNA stability can be accomplished by soluble TIS11B (Figure S4I), but TIS11B assembly is required for the collective properties of the protein that endow it with the ability to regulate protein functions through mediating 3′UTR-dependent protein-protein interactions.
TIS11B is widely expressed and TIS granule formation is conserved among vertebrates
We next examined if TIS granule formation is conserved in other species. Amino acid sequence conservation of the RNA-binding domain was used by others to identify TIS11B homologues (Figure S6A) (Thompson et al., 1996). In contrast to the high sequence conservation of the RNA-binding domain, the sequence conservation outside of the RNA-binding domain decreases substantially in species other than vertebrates (Figure S6B). In parallel, the net charge pattern of TIS11B is only preserved within vertebrates (Figure S6C). We examined TIS granule formation of transfected mouse, zebrafish, and fly TIS11B in HeLa cells and observed TIS granule formation for all except Drosophila melanogaster TIS11 (dTIS11; Figures S6D and S6E) (Twyffels et al., 2013). dTIS11 did also not form TIS granules in Drosophila S2 cells (Figure S6F). These results further support the requirement of the charge pattern distribution for TIS granule formation and show that TIS11B assembly is conserved among vertebrate species.
The TIS granule region has different biophysical and biochemical properties than the cytoplasm
We postulated that the movement of SET is restricted in the granule region. To test this prediction, we performed a FRAP assay and compared the recovery of SET fluorescence in the TIS granule region with its recovery in the cytoplasm. Within the granule region, we observed significantly less recovery (Figure 7H), revealing reduced exchange of SET protein. Limited fluorescence recovery was also observed for HuR and HSPA8 in the TIS granule region compared with the cytoplasm (Figures S7A and S7B), indicating that the biophysical properties within the TIS granule region are different than in the cytoplasm.
In the future, it will be important to identify the features that enable formation of protein-protein interactions in the special environment created by the TIGER domain. We started to obtain experimental evidence for the special environment provided by the TIGER domain. It was described that over-permeabilization of fixed cells can lead to extraction of proteins (Schnell et al., 2012). Having this principle in mind, we performed a retention assay (Figure 7I). We fixed and permeabilized the cells for one hour, followed by comparison of the fluorescence intensity signals of SET in the cytoplasm and in the TIS granule region. This experiment revealed a striking difference of SET behavior in the cytoplasm compared with the TIS granule region. We observed the disappearance of cytoplasmic SET, but retention of SET in the granule region (Figure 7I). Similarly, HSPA8 and NACA were also retained (Figures S7C and S7D). These results indicate that the TIS granule region is biochemically different from the cytoplasm, supporting the idea that the environment of the TIGER domain is special.
Discussion
TIS granules form under physiological conditions and create a meshwork intertwined with the ER
We identified a new type of RNA granule with several features that sets it apart from RNA granules described so far. The RNA-binding protein TIS11B assembles under physiological conditions to generate TIS granules. TIS11B assembly is independent of its IDR but depends on a particular charge pattern distribution of positive and negative net charges. TIS granules are gel-like and form a meshwork with a reticular pattern that is intertwined with the ER. TIS granules represent the first membrane-less organelle that is associated with a membrane-bound organelle. These TIS granule features are different in so far described RNA granules, including stress granules or P bodies, which form transient, liquid-like spheres in the cytoplasm (Banani et al., 2017; Shin and Brangwynne, 2017; Kato and McKnight, 2018).
The RNA-binding protein TIS11B is known as ARE-binding protein that destabilizes specific mRNAs (Stoecklin et al., 2002; Lykke-Andersen and Wagner, 2005; Hodson et al., 2010). We found that TIS11B is present in various cell types in a soluble as well as assembled state (Figures 1B and S1C). Whereas soluble TIS11B is able to destabilize mRNAs, through assembly, TIS11B acquires new, collective properties including its ability to enrich or exclude specific proteins in the granule region. This indicates that assembled TIS11B forms a membrane-less organelle.
TIS granules enable transmission of 3′UTR-encoded genetic information to proteins
The three-dimensional organization of TIS granules and the ER enables their functional interaction that results in the formation of a new subcellular compartment, that we call the TIGER domain. The TIGER domain defines a functional subdomain of the rough ER that enables the formation of specific and functionally relevant protein-protein interactions of newly translated membrane proteins. Specific proteins encoded by mRNAs with AREs in their 3′UTRs are translated within the TIGER domain. The TIGER domain provides a different biochemical and biophysical environment than the cytoplasm which allows the newly translated proteins to interact with 3′UTR-recruited factors, which is critical to turn them into functionally fully competent proteins. This implies that functional maturation of a subset of proteins is not completed after translation and protein folding. Instead, genetic information encoded in 3′UTRs can be transmitted to newly translated proteins through TIS granules, thus determining intrinsic or new protein features. Although, we currently only know of SET as 3′UTR-recruited protein, it is likely that many other proteins can be transferred from 3′UTRs to newly made proteins in the TIGER domain.
Specific protein-protein interactions are established in the TIGER domain that cannot form outside of this compartment
We demonstrated that translation of mRNAs within the TIGER domain is necessary and sufficient for the formation of protein-protein interactions between SET and membrane proteins and for the downstream consequences triggered by SET-binding (Figures 6A–C). In physiological conditions, SU is mostly translated outside of the TIGER domain (Figures 2C and 2D). However, TIS11B overexpression with subsequent granule formation at all regions of the rough ER localizes TIS granules to the site of SU translation. This results in the interaction between SET and CD47-SU and confirms that the protein-protein interaction between SET and membrane proteins can only be established within the specialized compartment created by the TIGER domain. As the protein-protein interaction occurs at the site of translation, the data indicate that some protein-protein interactions can only be established in a peri-translational manner, meaning either co-translationally or immediately afterwards (Natan et al., 2017). This means that formation of particular protein-protein interactions is spatially and temporarily restricted. As the protein-protein interaction between SET and CD47-LU is based on electrostatic interactions (Berkovits and Mayr, 2015), the spatiotemporal control increases the specificity of interaction. It is noteworthy that overexpression of both interaction partners was not sufficient for the formation of the protein-protein interaction between SET and CD47 (Figures 5A and 5C) (Berkovits and Mayr, 2015), thus further supporting the compartment model. This is in contrast to the formation of many known protein-protein interactions that are promoted by overexpression of the interaction partners.
3′UTRs play several roles in this process
The protein-protein interactions that are formed within the TIGER domain are 3′UTR-dependent. RNA-binding proteins play important roles in the information transfer from 3′UTRs to proteins: TIS11B binds to AREs in 3′UTRs and through TIS11B assembly creates a special environment at the site of translation. HuR also binds to AREs in 3′UTRs and recruits SET (Berkovits and Mayr, 2015), thus providing specificity of the protein-protein interaction.
Furthermore, 3′UTRs are responsible for the localization of mRNAs to this specific subcellular compartment. Our data revealed that using the 42 nucleotides long TNFα ARE as 3′UTR is sufficient to fully recapitulate the increased surface expression of CD47-LU mediated by the long CD47 3′UTR. This is an important finding as it was previously thought that 3′UTR length itself may be important for the protein recruitment function.
Our RNA-FISH data on 15 mRNAs showed that the presence of AREs is necessary for mRNA localization to TIS granules, but AREs were not sufficient for mRNA enrichment in TIS granules (Figure 2D). Although all enriched mRNAs encode membrane proteins, it is currently unclear if a transmembrane domain is the defining feature or if the mRNAs share additional motifs in their 3′UTRs that are responsible for their enrichment in TIS granules. According to bioinformatic analyses, in HeLa cells more than 1,000 mRNAs (~11% of all expressed mRNAs) contain AREs and encode membrane proteins (see Methods) (Bakheet et al., 2006; Huang da et al., 2009; Lianoglou et al., 2013). Further experiments will be required to assess whether these mRNAs are potential TIS11B targets.
TIS11B is widely expressed and TIS granule formation is conserved among vertebrates
TIS11B mRNA is among the highest expressed mRNAs in various cell types. Particularly high expression was detected in B cells, breast tissue and ovary, where it was found among the 100 highest expressed messages (Figure S1B) (Lianoglou et al., 2013). Importantly, its charge pattern distribution and capacity for assembly are conserved among vertebrate species (Figure S6), suggesting that TIS granule function is a fundamental feature of cells.
It is still largely unclear how the biochemical and biophysical environment of the TIS granule region promotes specific protein-protein interactions
We currently do not fully understand how the TIGER domain enables the formation of protein-protein interactions. There are several possibilities. SET is relatively excluded from TIS granules, but localizes to the interorganelle space (Figure 5D). It is possible that this characteristic of TIS granules may result in a local concentration increase of 3′UTR-recruited SET at the ER membrane. However, we currently do not have direct evidence for this. Nevertheless, we have evidence that the biochemical and biophysical properties in the TIS granule region are different from the cytoplasm (Figures 7H and 7I). We observed slower exchange of SET and other enriched proteins compared to their cytoplasmic localization (Figures 7H, S7A, and S7B). Thus, slower movement of SET and a decrease in the degrees of freedom of SET may be contributors of increased binding of SET to membrane proteins within the TIGER domain (Good et al., 2011). In addition, the interplay of the TIS granule and the ER creates a new interface. It is possible, that the presence of this interface enhances SET binding to membrane proteins, as biochemical reactions behave differently on surfaces than in solution (Kim and Yethiraj, 2010; Chapanian et al., 2014). Finally, many reactions are promoted by a lipid membrane context (Lamson et al., 2006). As the TIGER domain is created by the cooperative action between the TIS granule and the ER membrane, the membrane context may promote granule functions and improve SET binding.
It has become clear in recent years that the intracellular space is highly organized (Banani et al., 2017). In addition to the compartmentalization through lipid-membrane bound organelles or non-membrane bound organelles, our data reveal that there are also subcellular compartments that are created through interaction of membrane-less and membrane-bound organelles. The currently known function of this new subcellular compartment is the formation of protein-protein interactions that cannot be established outside of this compartment. However, we anticipate that TIS granules will play additional roles. Our data suggest that the biological consequences will be broad. In the case of PD-L1, encoded by an mRNA with a constitutive 3′UTR, 3′UTR-dependent binding of SET increased its cell surface expression by four-fold. Therefore, 3′UTRs are able to make cellular processes, such as protein trafficking, more efficient. This saves energy as less transcription and less translation are required to achieve a certain surface expression level. In the case of alternative 3′UTRs, as we showed previously for CD47, 3′UTR-mediated protein-protein interactions can mediate multi-functionality of proteins without changing their amino acid sequence (Berkovits and Mayr, 2015). As 3′UTR sequence has significantly expanded during evolution of higher organisms (Mayr, 2017), transmission of genetic information from 3′UTRs to membrane proteins – which is mediated by the TIGER domain – may contribute to increased functional complexity of organisms.
CONTACT FOR REAGENT AND RESOURCE SHARING
Further information and requests for resources and reagents may be directed to and will be fulfilled by the Lead Contact, Christine Mayr (mayrc@mskcc.org).
Experimental Model and Subject Details
Cell lines
HEK293T (human immortalized embryonic kidney cells, female origin), MCF7 (human breast cancer, female origin), CAOV-3 (human ovarian cancer, female origin), and NIH3T3 cells (mouse fibroblast cell line, male origin) were purchased from ATCC. HeLa, a human cervical cancer cell line (female origin), was a gift from the lab of Jonathan S. Weissman (UCSF), provided by Calvin H. Jan. The human osteosarcoma U2OS cell line (female origin) was a gift from Thijn Brummelkamp (Netherlands Cancer Institute). All cells were maintained at 37°C with 5% CO2 injection in Dulbecco’s Modified Eagle Medium (DMEM) containing 4,500 mg/L glucose, 10% heat inactivated fetal bovine serum, 100 U/ml penicillin and 100 µg/ml streptomycin. Drosophila S2R+ cells (male origin) were a gift from the lab of Jennifer Zallen (MSKCC), provided by Masako Tamada. Cells were maintained in Schneider’s Medium with 10% heat inactivated fetal bovine serum at 25°C. The cell l ines have not been authenticated.
Method details
Constructs
shRNA constructs
For HuR and KHSRP shRNA knockdown experiments pSUPERretropuro was used. The DNA oligonucleotides listed in Table S2 served as shRNA precursors and were inserted into pSUPERretropuro between BglII and XhoI sites. The shRNAs used were shRNA1 Ctrl (Control, luciferase), shRNA1 HuR, and shRNA1 KHSRP. For further shRNA knock-down experiments, shRNA clones were purchased from Sigma or Addgene. shRNA2 Ctrl (scramble): Addgene #1864, shRNA2 HuR: TRCN0000276129, shRNA1 TIS11B: TRCN0000329702, shRNA1 SET: TRCN0000063717, and shRNA1 FXR1: TRCN0000160812.
pcDNA-puro backbone
The eGFP/mCherry/BFP fusion constructs were generated in the pcDNA3.1-puro expression vector after replacement of neomycin by the puromycin resistance gene (Life Technologies). PCR was performed using Q5 High Fidelity DNA polymerase (NEB). The primer sequences used to generate PCR-amplified inserts are listed in Table S2. TagBFP (Evrogen) sequence was PCR-amplified from BFP-SEC61 beta vector (Addgene, #49154) with primers TagBFP F and TagBFP R.
Constructs used to visualize the ER
To visualize the ER in human cell lines, GFP/mCherry/BFP-SEC61B was used. The coding sequence of human SEC61B was PCR-amplified from HEK293 cells and cloned downstream of GFP using BsrGI and HindIII sites. The primers were SEC61B F and SEC61B R. To visualize the ER in Drosophila melanogaster S2R+ cells, pMT-Bip-GFP:V5:KDEL (Addgene, #69917) was used.
CD47 constructs
GFP-CD47-SU and GFP-CD47-LU were described previously (Berkovits and Mayr, 2015). In GFP-CD47-LU, the proximal polyadenylation site was mutated to generate only the long 3′UTR. The sequences of SU1 and TNFα ARE, are listed in Table S2. The artificial 3′UTRs were generated by annealing two DNA oligonucleotides that were inserted into the NotI and XbaI sites downstream of CD47 coding sequence.
TIS11B constructs
The human TIS11B coding sequence (1,017 bp) was PCR-amplified using TIS11B F and TIS11B R from HeLa cDNA and inserted between the BsrGI and EcoRI sites. For TIS11B ∆IDR constructs, the nucleotide sequence of the coding amino acids 1–278 were cloned into BsrGI and EcoRI sites with oligos TIS11B F and TIS11B R2. For TIS11B charge pattern mutant constructs, target mutations were incorporated into primers that were used for PCR amplification. Two overlapping fragments of TIS11B with target mutations were amplified by several rounds of PCR. The following primers were used. TIS11B CPM1 (R to D mutations in the C terminus): PCR1: TIS11B F and TIS11B CPM1 fragment R1; PCR2: TIS11B CPM1 fragment F2 and TIS11B R. CPM2 (CPM1 plus R to A mutations in the N terminus): PCR1–1: TIS11B F and TIS11B CPM2 fragment R1–1; PCR1–2: TIS11B F and TIS11B CPM2 fragment R1–2; PCR2–1: TIS11B CPM2 fragment F2–1 and TIS11B R; PCR2–2: TIS11B CPM2 fragment F2–2 and TIS11B R. CPM3 (CPM1 plus D or E to A mutations in the N terminus): PCR1: TIS11B F and TIS11B CPM3 fragment R1; PCR2: TIS11B CPM3 fragment F2 and TIS11B R. CPM4 (CPM1 plus S to A mutations in the N terminus): PCR1–1: TIS11B F and TIS11B CPM4 fragment R1–1; PCR1–2: TIS11B F and TIS11B CPM4 fragment R1–2; PCR2–1: TIS11B CPM4 fragment F2–1and TIS11B R; PCR2–2: TIS11B CPM4 fragment F2–2 and TIS11B R. A final ligation PCR was performed to ligate two PCR fragments of TIS11B to make full length TIS11B with target mutations with oligos TIS11B F and TIS11B R. For human TIS11B WT and CPM2 shRNA resistant constructs, five synonymous point mutations at the TIS11B shRNA1 target site were introduced using the QuikChange Lightning Multi Site-Directed Mutagenesis Kit (Agilent Technologies, #210513). The primer was TIS11B mu-sh. To generate the human TIS11B RBDM (RNA-binding domain mutant) construct, target mutations were introduced using the QuikChange Lightning Multi Site-Directed Mutagenesis Kit (Agilent Technologies, #210513). The primer was TIS11B C135H and TIS11B C173H.
The mouse Tis11b coding sequence was PCR-amplified using primers mTis11b F and mTis11b R from NIH3T3 cDNA and inserted between the BsrGI and EcoRI sites.
The zebrafish Tis11b (Zfp36l1a) coding sequence was PCR-amplified using primers zTis11b F and zTis11b R from ZMEL cDNA and inserted between the BsrGI and EcoRI sites. ZMEL cDNA was a gift from the lab of Philipp Niethammer (MSKCC), provided by King Hui.
The Drosophila TIS11 (dTIS11) coding sequence was PCR-amplified using primers dTIS11 F and dTIS11 R from the pMT-mCherry-dTIS11 vector and inserted between the BsrGI and EcoRI sites. The pMT-mCherry-dTIS11 vector was a gift from Véronique Kruys (University of Brussels).
Other constructs
The SET isoform c coding sequence was PCR-amplified from HeLa cell cDNA and inserted between the BsrGI and EcoRI sites with primers SETc F and SETc R.
The CD274 (PD-L1) signal peptide (SP) sequence was incorporated into the PCR primer used for amplification of PD-L1. Two rounds of PCRs were performed to amplify SP-GFP. The following primers were used. PCR1: PD-L1 SP-GFP F1 and PD-L1 SP-GFP R; PCR2: PD-L1 SP-GFP F2 and PD-L1 SP-GFP R. SP-GFP was cloned into pcDNA3.1-puro vector using NheI and BsrGI sites. Coding sequence for PD-L1 mature peptide (MP) was PCR-amplified from HeLa cell cDNA and inserted between the BsrGI and NotI sites. The primers were PD-L1 MP F and PD-L1 MP R. PD-L1 3′UTR sequence (2,705 bp) was PCR amplified from HeLa genomic DNA and inserted between the NotI and XbaI sites. The primers were PD-L1 3′UTR F and PD-L1 3′UTR R.
The BCL2 coding sequence (720 bp) was PCR-amplified from HEK293 cell cDNA and inserted between BsrGI and EcoRI sites. The primers were BCL2 F and BCL2 R. BCL2 long 3′UTR sequence (5,249 bp) was PCR-amplified from HEK293 cell genomic DNA and inserted into the NotI and PmeI sites. The proximal polyadenylation signals were mutated. The primers were BCL2 3′UTR F and BCL2 3′UTR R.
The ELAVL1 (HuR) coding sequence was PCR-amplified from HEK293 cell cDNA and inserted between the BsiWI and EcoRV sites. The primers were HuR F and HuR R. HuR 3′UTR sequence (4,909 bp) was PCR-amplified from HEK293 cell genomic DNA and inserted into the EcoRV and NotI sites. The proximal polyadenylation signals were mutated. The primers were HuR 3′UTR F and HuR 3′UTR R.
To generate TP53-GFP-NU, TP53 cDNA was amplified from B-LCL and cloned into pcDNA3.1-puro-GFP vector using HindIII and BamHI restriction sites and HindIII-TP53-fw and TP53-BamHI-rev primers. GFP (lacking a start codon) was fused in-frame downstream of TP53 and is located between BamHI and EcoRI. To generate TP53-GFP-UTR, the 3′UTR of TP53 (1,207 bp) was cloned downstream of GFP using EcoRI and NotI sites and EcoRI-TP53-U-fw and TP53-U-NotI-rev primers. To generate TP53-GFP-TNFα ARE, the artificial 3′UTR was generated by annealing two DNA oligonucleotides (TP53-ARE F and TP53-ARE R) that were inserted into the EcoRI and NotI sites downstream of GFP coding sequence.
The FUS coding sequence was PCR-amplified from the 423Gal-FUS-YFP vector (Addgene, #29615) using primers FUS F and FUS R and inserted between the HindIII and BamHI sites. The 3′UTR of FUS (1,814 bp) was PCR-amplified using primers FUS 3′UTR F and FUS 3′UTR R from HEK293 cell cDNA and inserted between the BamHI and NotI sites.
The CCND1 coding sequence was PCR-amplified using CCND1 F and CCND1 R from HEK293 cell cDNA and inserted between the BsrGI and BamHI sites. To clone CCND1 full-length mRNA with the 3′UTR sequence (3,191 bp), two overlapping fragments (CDS and proximal 1,727 bp of 3′UTR and distal 1,464 bp of 3′UTR) were PCR-amplified from HEK293 cell cDNA and fused at the endogenous EcoRI site. The primers were CCND1 F + CCND1 3′UTR R1 (fragment 1) and CCND1 3′UTR F2+ CCND1 3′UTR R2 (fragment 2). The fragments were digested and ligated into full length CCND1–3′UTR and inserted between the BsrGI and NotI sites.
The HSPA8 coding sequence was PCR-amplified using HSPA8 F and HSPA8 R from HeLa cell cDNA and inserted between the BsrGI and XbaI sites. The NACA coding sequence was PCR-amplified using NACA F and NACA R from HeLa cell cDNA and inserted between the HindIII and BamHI sites.
Transfections
For all transfections into HEK293T and HeLa cells, Lipofectamine 2000 (Invitrogen, 11668019) was used. For transfections into S2R+ cells, FUGENE HD (Promega, E2311) was used. 24 hours after transfection, 1 mM CuSO4 was added into the medium to induce gene expression driven by the metallothionein promoter.
shRNA-mediated knockdown
For shRNA-mediated knockdown experiments, stable cell lines were generated. shRNA1 Co contains the pSuperretropuro backbone, whereas shRNA2 Co contains the lentiviral backbone (pLKO). pSuperretro/MCV/VSVG plasmids were transfected into HEK293T cells for retroviral packaging. pLKO.1/pdR8.2/VSVG plasmids were transfected into HEK293T cells for lentiviral packaging. Virus was harvested 48 hours after transfection. 200 µl virus was used per 6 well to infect HeLa cells. 24 hours after infection, puromycin was added to the medium with a final concentration of 3 µg/ml. Cells were selected in medium with puromycin for 3 days to make stable cell lines. Knockdown efficiency was examined by western blot. Stable cell lines were maintained in medium with 3 µg/ml puromycin.
Western blotting
Cells were trypsinized and washed twice with PBS and lysed with RIPA buffer (25 mM Tris-HCl (pH 7.4), 150 mM NaCl, 1% NP-40, 1% Na-deoxycholate, 0.1% SDS, 1 mM EDTA, and Protease Inhibitor Cocktail (Thermo Fisher Scientific)). Cell lysates were centrifuged at 20,000 g for 10 min. Supernatants were mixed with Laemmli Sample buffer (Sigma-Aldrich) and boiled for 10 min at 95°C. Samples were subjected to SDS- PAGE on NuPAGE 4%–12% Bis-Tris gradient protein gel (Invitrogen). Imaging was captured on the Odyssey CLx imaging system (Li-Cor). The antibodies used are listed in the Key Resources Table.
KEY RESOURCES TABLE
| REAGENT or RESOURCE | SOURCE | IDENTIFIER |
|---|---|---|
| Antibodies | ||
| Chicken anti-GFP | Abcam | Cat# ab13970, RRID:AB_300798 |
| Mouse anti-α-TUBULIN | Sigma-Aldrich | Cat# T9026, RRID:AB_477593 |
| Mouse anti-ACTIN | Sigma-Aldrich | Cat# A4700, RRID:AB_476730 |
| Rabbit anti-HuR | Millipore | Cat# 07–1735, RRID:AB_1977173 |
| Mouse anti-HuR | Santa Cruz Biotechnology | Cat# sc-5261, RRID:AB_627770 |
| Rabbit anti-KHSRP | Sigma-Aldrich | Cat# SAB4200566, RRID:AB_2737444 |
| Rabbit anti-FXR1 | Sigma-Aldrich | Cat# HPA018246, RRID:AB_1849204 |
| Mouse anti-HNRNPA1 | Santa Cruz Biotechnology | Cat# sc-374526, RRID:AB_10991524 |
| Rabbit anti-CD47 | Abcam | Cat# ab108415, RRID:AB_10859754 |
| Rabbit anti-SET | Abcam | Cat# ab181990, RRID:AB_2737445 |
| Rabbit anti-ZFP36L1/2 | Cell Signaling Technology | Cat# 2119, RRID:AB_659988 |
| Rabbit anti-ZFP36L1 | Proteintech | Cat# 12306–1-AP, RRID:AB_2737443 |
| Mouse anti-mCherry | Abcam | Cat# ab125096, RRID:AB_11133266 |
| Mouse anti-SYNCRIP | Sigma-Aldrich | Cat# R5653, RRID:AB_261964 |
| Mouse anti-FUS | Sigma-Aldrich | Cat# SAB4200478, RRID:AB_2737446 |
| Rabbit anti-FUBP3 | Sigma-Aldrich | Cat# SAB1300583, RRID:AB_10611838 |
| PerCP-Cy5.5 mouse anti-CD47 | BD Biosciences | Cat# 561261, RRID:AB_10611734 |
| Alexa Fluor 647 mouse anti-CD47 | BD Biosciences | Cat# 561249, RRID:AB_10611568 |
| Donkey anti-mouse IRDye 700 | Rockland | Cat# 610–730-002, RRID:AB_1660934 |
| Donkey anti-rabbit IRDye 680 | LI-COR Biosciences | Cat# 926–68073, RRID:AB_10954442 |
| Donkey anti-rabbit IRDye 800 | LI-COR Biosciences | Cat# 926–32213, RRID:AB_621848 |
| Donkey anti-mouse IRDye 800 | LI-COR Biosciences | Cat# 926–32212, RRID:AB_621847 |
| Rabbit anti-chicken IRDye 800 | Rockland | Cat# 603–432-002, RRID:AB_1660856 |
| Goat anti-chicken secondary antibody, Alexa Fluor 633 | Thermo Fisher Scientific | Cat# A-21103, RRID:AB_2535756 |
| Goat anti-Rabbit IgG secondary antibody, Alexa Fluor 594 | Thermo Fisher Scientific | Cat# A-11037, RRID:AB_2534095 |
| Goat anti-Mouse IgG secondary antibody, Alexa Fluor 568 | Thermo Fisher Scientific | Cat# A-11004, RRID:AB_2534072 |
| Chemicals, Peptides, and Recombinant Proteins | ||
| GFP-Trap_A beads | Chromotek | Cat# gta-100 |
| Stellaris® FISH Probes, eGFP with Quasar® 670 Dye | Biosearchtech | Cat# VSMF-1015–5 |
| Streptavidin C1 beads | Invitrogen | Cat# 65002 |
| Lipofectamine 2000 | Invitrogen | Cat# 11668019 |
| FuGENE HD | Promega | Cat# E231A |
| Odyssey blocking buffer (PBS) | LI-COR Biosciences | Cat# 927–40000 |
| Halt Protease Inhibitor Cocktail | Thermo Fisher Scientific | Cat# 78439 |
| SeeBlue Plus2 Pre-Stained Standard | Thermo Fisher Scientific | Cat# LC5925 |
| NuPAGE MES SDS running buffer 20x | Invitrogen | Cat# NP0002 |
| NuPAGE Novex 4–12% Bis-Tris Protein Gels, 1.0 mm, 10 well | Invitrogen | Cat# NP0321 |
| NuPAGE 4–12% Bis-Tris Protein Gels, 1.0 mm, 12-well | Invitrogen | Cat# NP0322 |
| NuPAGE 4–12% Bis-Tris Protein Gels, 1.5 mm, 15-well | Invitrogen | Cat# NP0336 |
| NuPAGE Transfer Buffer | Invitrogen | Cat# NP00061 |
| Sample Buffer, Laemmli 2× Concentrate | Sigma-Aldrich | Cat# S3401 |
| Tween-20 | Fisher scientific | Cat# BP337–500 |
| Triton X-100 | Fisher scientific | Cat# BP151–100 |
| CHAPS hydrate | Sigma-Aldrich | Cat# C3023 |
| Nonidet P-40 | Sigma-Aldrich | Cat# 74385 |
| Ampicillin Sodium Salt | Fisher scientific | Cat# BP176025 |
| Bovine Serum Albumin (BSA) | Fisher scientific | Cat# BP1605100 |
| Tris Base | Fisher scientific | Cat# BP152–1 |
| Sodium Chloride | Fisher scientific | Cat# S271–3 |
| Dextran Sulfate Sodium Salt | Spectrum Chemical | Cat# DE131 |
| Ribonucleoside Vanadyl Complex | NEB | Cat# S1402 |
| Salmon testes single stranded DNA | Sigma-Aldrich | Cat# D7656 |
| Formamide | Sigma-Aldrich | Cat# F7503 |
| TRI Reagent™ Solution | Invitrogen | Cat# AM9738 |
| SuperScript III Reverse Transcriptase | Invitrogen | Cat# 18080044 |
| Q5 High-Fidelity DNA Polymerase | NEB | Cat# M0491L |
| T4 DNA Ligase | NEB | Cat# M0202L |
| UltraPure agarose | Invitrogen | Cat# 16500500 |
| 16% Paraformaldehde Aqueous Solution | Fisher scientific | Cat# 50–980-487 |
| ProLong Gold Antifade Mountant | Invitrogen | Cat# P36934 |
| Methanol | Fisher scientific | Cat# A412–4 |
| Ethanol | Fisher scientific | Cat# BP28184 |
| Isopropanol | Fisher scientific | Cat# BP26184 |
| Chloroform | Fisher scientific | Cat# C607–4 |
| Critical Commercial Assays | ||
| QuikChange Lightning Multi Site-Directed Mutagenesis Kit | Agilent Technologies | Cat# 210513 |
| QIAGEN Plasmid Plus Midi Kit | Qiagen | Cat# 12945 |
| Experimental Models: Cell Lines | ||
| HeLa | Jonathan S. Weissman | N/A |
| HEK293T | ATCC | ATCC Cat# CRL-3216, RRID:CVCL_0063 |
| CAOV-3 | ATCC | ATCC Cat# HTB-75, RRID:CVCL_0201 |
| U2OS | Thijn Brummelkamp | N/A |
| MCF7 | ATCC | ATCC Cat# CRL-12584, RRID:CVCL_0031 |
| NIH3T3 | ATCC | ATCC Cat# CRL-6442, RRID:CVCL_0594 |
| S2R+ | Jennifer Zallen | N/A |
| Oligonucleotides | ||
| shRNA1 Control (Luciferase) 5′-GATCTCCCCCGCCTGAAGTCTCTGATTTCAAGAGAATCAGAGACTTCAGGCGGGTTTTTC-3′ | This paper | N/A |
| shRNA1 HUR 5′-GATCTCCGATCAGACTACAGGTTTGTTTCAAGAGAACAAACCTGTAGTCTGATCTTTTTC-3′ | This paper | N/A |
| shRNA1 KHSRP 5′-GATCTCCGAGGAGGTGAACAAATTAATTCAAGAGATTAATTTGTTCACCTCCTCTTTTTC-3′ | This paper | N/A |
| Oligonucleotides for artifical 3′UTRs, SU1 5′-AUUGUUAGUUAAGUUUUUAUUCAAAGCAGCUGUAAUUUAGUU-3′ | This paper | N/A |
| Oligonucleotides for artifical 3′UTRs, TNFα ARE 5′-CACUUGUGAUUAUUUAUUAUUUAUUUAUUAUUUAUUUAUUUA-3′ | This paper | N/A |
| Oligonucleotides for PCR | This paper | Table S2 |
| Recombinant DNA | ||
| pLKO.1-shRNA2 Control (scramble) | Sarbassov et al., 2005 | Addgene, Cat# 1864 |
| pLKO.1-shRNA2 HuR | Sigma-Aldrich | TRCN0000276129 |
| pLKO.1-shRNA1 TIS11B | Sigma-Aldrich | TRCN0000329702 |
| pLKO.1-shRNA1 FXR1 | Sigma-Aldrich | TRCN0000160812 |
| pLKO.1-shRNA1 SET | Sigma-Aldrich | TRCN0000063717 |
| pSUPERretropuro-shRNA1 Control (Luciferase) | This paper | N/A |
| pSUPERretropuro-shRNA1 HuR | This paper | N/A |
| pSUPERretropuro-shRNA1 KHSRP | This paper | N/A |
| pcDNA-SP-GFP-CD47-SU | Berkovits and Mayr, 2015 | N/A |
| pcDNA-SP-GFP-CD47-LU | Berkovits and Mayr, 2015 | N/A |
| pcDNA-SP-GFP-CD47-TNFα ARE | This paper | N/A |
| pcDNA-GFP-SEC61B | This paper | N/A |
| TagBFP-SEC61B | Zurek et al., 2011 | Addgene, Cat# 49154 |
| pcDNA-BFP-SEC61B | This paper | N/A |
| pcDNA-mCherry-SEC61B | This paper | N/A |
| pMT-Bip-GFP:V5:KDEL | Okajima et al., 2005 | Addgene, Cat# 69917 |
| pcDNA-GFP-TIS11B | This paper | N/A |
| pcDNA-mCherry-TIS11B | This paper | N/A |
| pcDNA-mCherry-TIS11B shRNA resistant | This paper | N/A |
| pcDNA-BFP-TIS11B | This paper | N/A |
| pcDNA-BFP-TIS11B shRNA resistant | This paper | N/A |
| pcDNA-mCherry-TIS11B ΔIDR | This paper | N/A |
| pcDNA-mCherry-TIS11B CPM1 | This paper | N/A |
| pcDNA-mCherry-TIS11B CPM2 | This paper | N/A |
| pcDNA-mCherry-TIS11B CPM2 shRNA resistant | This paper | N/A |
| pcDNA-BFP-TIS11B CPM2 | This paper | N/A |
| pcDNA-BFP-TIS11B CPM2 shRNA resistant | This paper | N/A |
| pcDNA-mCherry-TIS11B CPM3 | This paper | N/A |
| pcDNA-mCherry-TIS11B CPM4 | This paper | N/A |
| pcDNA-mCherry-TIS11B RBDM | This paper | N/A |
| pcDNA-mCherry-Tis11b mouse | This paper | N/A |
| pcDNA-mCherry-Tis11b zebrafish | This paper | N/A |
| pcDNA-mCherry-TIS11 fly | This paper | N/A |
| pMT-mCherry-dTis11 | Véronique Kruys | N/A |
| pcDNA-GFP-SET isoform c | This paper | N/A |
| pcDNA-mCherry-SET isoform c | This paper | N/A |
| pcDNA-SP-GFP-CD274-NU | This paper | N/A |
| pcDNA-SP-GFP-CD274-UTR | This paper | N/A |
| pcDNA-GFP-BCL2-NU | This paper | N/A |
| pcDNA-GFP-BCL2-LU | This paper | N/A |
| pcDNA-GFP-ELAVL1-NU | This paper | N/A |
| pcDNA-GFP-ELAVL1-LU | This paper | N/A |
| pcDNA-mCherry-ELAVL1-NU | This paper | N/A |
| pcDNA-TP53-GFP-NU | This paper | N/A |
| pcDNA-TP53-GFP-UTR | This paper | N/A |
| pcDNA-TP53-GFP-TNFα ARE | This paper | N/A |
| pcDNA-GFP-FUS-NU | This paper | N/A |
| pcDNA-GFP-FUS-UTR | This paper | N/A |
| pcDNA-GFP-CCND1-NU | This paper | N/A |
| pcDNA-GFP-CCND1-UTR | This paper | N/A |
| pcDNA-GFP-HSPA8 | This paper | N/A |
| pcDNA-mCherry-HSPA8 | This paper | N/A |
| pcDNA-GFP-NACA | This paper | N/A |
| pcDNA-mCherry-NACA | This paper | N/A |
| Software and Algorithms | ||
| FIJI | NIH | https://fiji.sc/ |
| Imaris | BitPlane | http://www.bitplane.com/imaris |
| ZEN | ZEISS | https://www.zeiss.com/microscopy/int/downloads/zen.html |
| GraphPad Prism 7 | GraphPad Software | https://www.graphpad.com/scientific-software/prism |
| FlowJo_V10 | FlowJo | https://www.flowjo.com |
| Odyssey | LI-COR Biosciences | https://www.licor.com/bio/products/imaging_systems/odyssey/ |
FACS analysis of endogenous CD47 expression
Cells were trypsinized and washed once with FACS buffer A (PBS containing 0.5% FBS). To detect endogenous CD47 surface expression, cells were incubated with PerCP-Cy5.5 mouse anti-CD47 (BD Biosciences, 561261) or Alexa Fluor 647 mouse anti-CD47 (BD Biosciences, 561249) in FACS buffer A for 20 min at 4°C and then washed twice with FACS buffer A. For detection of total (surface and intracellular) endogenous CD47 expression, cells were fixed with 4% PFA for 15 min at RT (room temperature), washed twice with FACS buffer B (0.02% sodium azide, 0.1% Tween 20 in PBS), permeabilized for 8 min at RT in permeabilization buffer (0.1% Triton X-100 in PBS) and washed twice with FACS buffer B. Then, cells were incubated with PerCP-Cy5.5 mouse anti-CD47 (BD Biosciences, 561261) or Alexa Fluor 647 mouse anti-CD47 (BD Biosciences, 561249) in FACS buffer B for 20 min at 4°C and washed twice with FACS buffer B. At least 10,000 cells were analyzed on a BD FACS Calibur cell analyser (BD Biosciences). FACS data were analyzed using the FlowJo software. The same population of live cells was gated for analysis.
FACS analysis of transfected GFP-CD47 or GFP-PD-L1 expression
Surface GFP expression was measured using an anti-GFP antibody on non-permeabilized cells, whereas total GFP-CD47 or GFP-PD-L1 expression was represented by total GFP expression. For detection of surface GFP-CD47 and GFP-PD-L1 expression, cells were incubated with chicken anti-GFP (Abcam ab13970) in FACS buffer A for 20 min at 4°C and washed twice with FACS buffer A. Then, cells were incubated with goat anti-chicken secondary antibody, Alexa Fluor 633 (Thermo Fisher, A-21103) in FACS buffer A for 20 min at 4°C and washed twice with FACS buffer A. At least 30,000 cells were analyzed on a BD FACS Calibur cell analyser (BD Biosciences). FACS data were analyzed using the FlowJo software. Total GFP-CD47 and GFP-PD-L1 expression was represented by total GFP intensity. To compare surface expression levels of GFP-CD47-SU and GFP-CD47-LU or GFP-PD-L1 (CD274-U and CD274-NU), populations of cells with similar GFP expression levels were gated. Populations with medium GFP expression were used. For GFP/mCherry double expression cells, the same population of medium or high GFP/mCherry double positive cells was gated for analysis. To compare total GFP-CD47-LU expression after mCherry or mCherry-TIS11B overexpression, all GFP positive cells were gated for analysis.
RNA oligonucleotide pulldown
3′-biotinylated RNA oligonucleotides were ordered from Dharmacon and then purified by PAGE. The restriction sites used for cloning of artifical UTRs were included in the RNA oligonucleotide sequences. For TNFα ARE, two RNA oligonucleotides were ordered: TNFα ARE-1 (NotI) and TNFα ARE-2 (ClaI). 10 µg of RNA oligonucleotides were transfected into HeLa cells grown in 10 cm plates with 30 µl lipofectamine, respectively. One plate of HeLa cells was used as negative control (transfection of lipofectamine only). Twenty-four hours after transfection, HeLa cells were lysed with 400 µl ice-cold NP-40 lysis buffer (25 mM Tris-HCl pH 7.5, 150 mM NaCl, 1% NP-40, 1 mM EDTA) for 30 min. Then, cell lysates were spun down at 20,000 g for 10 min at 4°C. The supernatant was transferred to a pre-c ooled tube and diluted with 600 µl ice-cold dilution buffer (10 mM Tris-HCl pH 7.5, 150 mM NaCl, 0.5 mM EDTA). Streptavidin C1 beads (60 µl; Invitrogen, 65002) were added to each tube and rotated for 1 hour at 4°C. Beads were washed three times with wash buffer (10 mM Tris-HCl pH 7.5, 150 mM NaCl, 0.5 mM EDTA). Lastly, 2x sample buffer was added to the beads, boiled at 95°C for 10 min and cooled on ice before loading on SDS page gels. This was followed by Western blotting. To examine the RNA binding activity of TIS11B WT, TIS11B CPM2 and TIS11B RBDM, RNA oligonucleotide pulldown was performed. mCherry-tagged constructs were transfected into HeLa cells with or without 3′-biotinylated RNA oligonucleotides (TNFα ARE-1). Twenty-four hours after transfection, cells were harvested for RNA oligonucleotide pulldown as described above.
Co-immunoprecipitation
GFP fusion constructs were transfected into HeLa cells. Cells were lysed in 400 µl ice-cold Chaps buffer (50 mM Tris-HCl (pH 7.5), 150 mM NaCl, 1% NP-40, 1 mM EDTA, 1% Chaps, protease inhibitor cocktail (Thermo Fisher)) for 30 min. Then, cell lysates were spun down at 20,000 g for 10 min at 4°C. The supernatant was tr ansferred to a pre-cooled tube. As input, 40 µl of supernatant was reserved. The rest of the supernatant was diluted with 600 µl ice-cold GFP-Trap Dilution/Wash buffer (10 mM Tris-HCl pH 7.5, 150 mM NaCl, 0.5 mM EDTA). GFP-Trap-A beads (Chromotek) were washed three times with 500 µl ice-cold GFP-Trap Dilution/Wash buffer before use. Then, diluted cell lysates were added to GFP-Trap_A beads and rotated for 1 hour at 4°C. Beads were spun dow n 2,500 g for 2 min at 4°C and the supernatant was discarded. GFP-Trap-A beads were washed three times with 500 µl ice-cold Dilution/Wash buffer. Briefly, beads were resuspended in 500 µl ice-cold Dilution/Wash buffer, centrifuged at 2,500 g for 2 min at 4°C and the sup ernatant was discarded. Lastly, 2x sample buffer was added to the beads, boiled at 95°C for 1 0 min and cooled on ice before loading on SDS page gels. This was followed by Western blotting.
Immunofluorescence staining
Cells were plated on 4-well Millicell EZ silde (Millipore, PEZGS0496). GFP-SEC61B was transfected to label the ER. Twenty-four hours after transfection, cells were washed with PBS, fixed in 500 µl 4% PFA for 10 min at RT, and washed 2 × 5 min with PBST (PBS containing 0.1% Tween). Then, cells were permeabilized in 0.1% Triton X-100 in PBS for 15 min at RT and blocked with blocking buffer (3% BSA in PBS + 0.1% Tween) for one hour and gently rocked at RT. Cells were incubated in the diluted primary antibody in blocking buffer for 1.5 hour at RT. Cells were washed 3 × 5 min with PBST. Cells were incubated with the secondary antibody in blocking buffer for 1.5 hours at RT in the dark. The cells were washed 3 × 5 min with PBST. The slide was mounted with mounting medium with DAPI (Invitrogen, P36931) and a coverslip was added. Images were captured using a confocal ZEISS LSM 880 with Airyscan super-resolution mode (Huff, 2015). The primary antibodies used are listed in the Key Resources Table.
RNA-FISH
HeLa cells were plated on 4-well Millicell EZ silde and transfected with GFP fusion constructs. Fourteen hours after transfection, cells were washed with PBS, fixed with 3.7% formaldehyde for 10 min at RT and washed twice for 5 min with PBS. PBS was discarded and 1 ml 70% ethanol was added. The slide was kept at 4°C for 8 hours. The 70% ethanol was aspirated, 1 ml wash buffer was added (2x SSC, 10% formamide in RNase-free water) and incubated at RT for 5 min. Hybridization mix was prepared by mixing 10% Dextran sulfate, 10% formamide, 2 x SSC, 2 mM ribonucleoside vanadyl complex (NEB), 0.02% BSA, 200 µg/ml yeast tRNA, 200 µg/ml single strand DNA and FISH probe (1:200, Stellaris® FISH Probes, eGFP with Quasar® 670 Dye, Biosearchtech, VSMF-1015–5). To each well 200 µl hybridization mix was added and hybridized at 37°C overnight. Slides were washed t wice for 30 min each with pre-warmed wash buffer (1 ml, 37°C) in the dark, followed by one qu ick wash with PBST, and then mounted with mounting solution. Images were captured using confocal ZEISS LSM 880 with Airyscan super-resolution mode.
Confocal microscopy
Confocal imaging was performed using ZEISS LSM 880 with Airyscan super-resolution mode . A Plan-Apochromat 63x/1.4 Oil objective (Zeiss) was used. For live cell imaging, HeLa cells were plated on 3.5 cm glass bottom dishes (Cellvis, D35–20-1-N) and transfected with constructs described above. Fourteen hours after transfection, cells were incubated with a LiveCell imaging chamber (Zeiss) at 37°C and 5% CO 2 and imaged in cell culture medium. Z-stack images were captured with the interval size of 160 nm. Excitations were performed sequentially using 405, 488, 594 or 633 nm laser wave length and imaging conditions were experimentally optimized to minimize bleed-through. In the RNA FISH experiment, BFP-TIS11B was used to show the TIS11B organelle in order to completely avoid signal bleed-through to the far-red channel. Images were prepared with the commercial ZEN software black edition (Zeiss). Three-dimensional reconstruction was carried out using volume rendering with Imaris software (BITPLANE).
Constructs of GFP-TIS11B, mCherry-TIS11B or BFP-TIS11B were used in different experiments. In order to be consistent, TIS11B organelles are always shown in red, regardless if BFP, GFP or mCherry (mC) had been used. Time lapse movies were captured using the same method as described above. Frame interval between two images was 0.32 seconds.
Line profile analysis to calculate the correlation of fluorescence signal of TIS11B vs mRNAs or proteins
In order to examine whether specific mRNAs and proteins are enriched in the TIS granule, line profile analysis was performed. Line profiles were generated with FIJI (ImageJ). For each cell, two straight lines were drawn to cross the TIS granule in different directions, indicated by the arrows shown in the figures. Fluorescence signal along the straight line of TIS11B protein and examined mRNAs or proteins were calculated with the plot profile tool in FIJI. The Pearson’s correlation coefficient r values of two fluorescence signals were calculated with Excel or with MATLAB by the Molecular Cytology Core Facility of MSKCC. Perfect colocalization is indicated by r = 1, indicating mRNAs or proteins are enriched in the TIS granule, whereas perfect exclusion is indicated by r = −1, indicating that mRNAs or proteins are excluded from the TIS granule and 0 means random distribution.
Fluorescence recovery after photobleaching (FRAP)
FRAP for TIS granules:
GFP-TIS11B was transfected into HeLa cells. FRAP experiments were performed in a LiveCell imaging chamber (ZEISS) with ZEISS LSM 880 laser scanning confocal microscopy. A Plan-Apochromat 63x/1.4 Oil objective (Zeiss) was used. An area of diameter = 2 µm was bleached with a 405 nm laser. GFP fluorescence signal was collected over time. The fluorescence intensity of the bleached area was obtained by ZEN software black edition (ZEISS). The prebleached fluorescence intensity was normalized to 1 and the signal after bleach was normalized to the prebleach level.
FRAP for SET, HuR, and HSPA8:
GFP-SET/HuR/HSPA8 were transfected into HeLa cells with mCherry-TIS11B. FRAP experiments were performed as described above with slight modifications. An area (diameter = 1 m) in the TIS granule region was bleached with a 405 nm and a 488 nm laser and the GFP fluorescence signal was collected over time. In the same cell, another area (diameter = 1 m) in the cytoplasm outside of TIS granules was bleached also with both lasers and the GFP fluorescence signal was collected over time. The fluorescence intensities of the bleached areas were obtained by ZEN software black edition (ZEISS). The prebleached fluorescence intensity was normalized to 1 and the signal after bleach was normalized to the prebleach level.
Evaluation of granule formation using fluorescence microscopy
Microscopy was performed using ZEISS AXIO with AXIOCam MRC. An EC Plan-NEOFLUAR 10x/0.3 objective (Zeiss) or a LD Plan-NEOFLUAR 20X/0.4 Ph2 korr objective (ZEISS) was used. To perform statistics of TIS granule formation, equal amounts of WT or mutant TIS11B constructs were transfected into HeLa cells in 6 well plates. Twenty-four hours after transfection, three fluorescence images were taken in different fields for each construct. The total number of transfected cells was counted within each field. Then, the number of cells with granules was counted manually.
Protein retention assay
Permeabilization of fixed cells with Triton leads to protein extraction and can result in loss of cytoplasmic proteins (Schnell et al., 2012). We made use of this phenomenon to examine whether a protein was retained in the TIS granule region after permeabilization. We compared the fluorescence intensity of GFP or mCherry-tagged protein before and after permeabilization. GFP and mCherry-tagged constructs were transfected into HeLa cells. Twenty-four hours later, cells were washed with PBS and fixed with 4% PFA for 8 min at RT. Fixed cells were washed with PBS and permeabilized with 0.1% Triton-X100 in PBS for one hour at RT. Images were taken in live cells (before fixation), in cells after fixation, and in permeabilized cells (fixed and permeabilized).
Amino acid sequence conservation of TIS11B homologues
The amino acid sequences were obtained from Uniprot and the Uniprot alignment tool was used.
TIS11B mRNA expression
TIS11B mRNA expression levels were obtained from previously published 3′-seq data (Lianoglou et al., 2013). All mRNAs expressed with transcripts per million (TPM) > 3 were plotted and the position of the TIS11B mRNA was indicated by a red line (Figure S1B).
Estimating the number of membrane protein encoding mRNAs with AREs in HeLa cells
According to 3′-seq, N = 9,272 mRNAs are expressed in HeLa cells with an expression level of TPM > 3 (Lianoglou et al., 2013). According to the ARE data base (ARED), N = 4,884 mRNAs have AREs in their 3′UTRs (Bakheet et al., 2006). The intersection of the two lists yielded N = 2,482 mRNAs. According to gene ontology (GO) analysis using DAVID, out of this list, N = 1,019 have the label “membrane” (Huang da et al., 2009). Therefore, we estimated that 11% (1,019/9,272) of expressed mRNAs in HeLa cells are membrane protein-encoding mRNAs containing AREs.
Calculation of net charge of a defined protein fragment
Within a defined protein region, we calculated the number of positively charged amino acids and the number of negatively charged amino acids. The difference of the two numbers is the net charge of the protein region.
Quantification and Statistical Analysis
Statistical parameters are reported in the Figures and Figure Legends, including the definitions and exact values of N and experimental measures (mean ± SD). To test for significant differences between samples, a two sided t-test with assumption of equal variance was performed using Excel. A two-sided Mann Whitney test was used for comparison of Pearson’s correlation coefficients between two samples, and for the comparison of FRAP values in the cytoplasm and the TIS granule region. Spearman’s correlation coefficients were calculated using SPSS. Statistical significance is indicated by asterisks *, P < 0.05, **, P < 0.01, ***, P < 0.001. For FRAP experiments, p values are indicated on plots.
Supplementary Material
Confocal time lapse video of the TIS granule (red) and the ER (green) in HeLa cells after transfection of mCherry-TIS11B and of GFP-SEC61B to visualize the ER.
(A) FRAP of GFP-HuR in the TIS granule region or in the region of the cytoplasm located outside of TIS granules. GFP-HuR and mC-TIS11B were transfected into HeLa cells. Shown is mean ± SD of fluorescence measured in different granule and cytoplasmic regions (N = 33, each) from 17 cells. Mann Whitney test, P = E-54.
(B) As in (A), but for GFP-HSPA8. N = 32 regions from 16 cells were analyzed. Mann Whitney test, P = E-46.
(C) Confocal imaging of HeLa cells after transfection of GFP-TIS11B (red) and mC-HSPA8 (green). Images were taken in live cells, in cells after fixation by PFA and in cells after 1 hour of permeabilization with Triton X-100. The area of the nucleus is demarcated by the white dotted line.
(D) As in (C), but after transfection of mC-NACA (green). Shown are representative images.
Statistics for TIS11B granule formation upon transfection of WT or mutant TIS11B constructs. The constructs are shown in Figures 7A, S4B, S4C, and S4E. CPM, charge pattern mutant. The total number of transfected cells within a field was counted using a fluorescence microscope. Then, the number of cells containing granules was counted. Shown is the number of cells counted as well as the percentage of cells with granules. The corresponding bar plots are shown in Figure S4D.
(A) Subcellular expression pattern of RNA-binding proteins determined by immunostaining, data base search, and literature survey.
(B) Distribution of mRNA expression of all expressed transcripts across human tissues, cell types, and cell lines as detected by 3′-seq. The log2 transcript per million (TPM) expression of TIS11B is indicated by the red line. Boxplots depict median and interquartile range, error bars show confidence interval (5–95%), and circles and stars show outliers.
(C) Fluorescence confocal microscopy of endogenous TIS11B protein in human and mouse cell lines. The nucleus was stained with DAPI. Shown are representative cells. The right panel shows the region marked by the dotted line in higher magnification.
(D) Confocal live cell imaging (Airyscan) of HeLa cells after transfection of GFP-SEC61B to visualize the ER together with mC, mC-FXR1 or mC-TIS11B. FXR1 granules are shown for comparison reasons as they form sphere-like granules. Note that the TIS11B assemblies cover almost the entire peri-nuclear ER region in cells with high TIS11B expression. Shown are representative images.
(E) 3D-reconstruction of images from cells treated as in (D).
(F) 3D-model of TIS granules and the ER.
(G) Fluorescence recovery after photobleaching (FRAP) of TIS11B assemblies after transfection of GFP-TIS11B into HeLa cells. The top panel shows the normalized FRAP curve. Shown is mean ± SD of three TIS11B assemblies.
(A) Features of mRNAs examined by RNA-FISH for co-localization with TIS granules. TMD, transmembrane domain.
(B) RNA-FISH (green) against GFP in HeLa cells after transfection of GFP-CD47-LU and mC-TIS11B (red), showing that LU mRNA localizes to TIS granules as well as to their surface.
(C) As in (B), but after transfection of GFP-CD47-SU and mC-SEC61B (red) to visualize the ER.
(D) Shown are GFP-tagged constructs that were used for RNA-FISH. They are drawn to scale and AREs are shown as red stars.
(E) RNA-FISH (green) against GFP in HeLa cells after transfection of TP53-GFP-UTR (top panel) and TP53-GFP-NU (without 3′UTR, middle panel), and TP53-GFP-TNFα ARE (bottom panel). BFP-TIS11B (red) was co-transfected. The area of the nucleus is demarcated by the white dotted line. Right panel shows the line profiles with the Pearson’s correlation coefficients. See also Figure 2D.
(F) As in (E), but for GFP-ELAVL1-LU (top panel) and GFP-ELAVL1-NU (bottom panel).
(G) As in (E), but after transfection of GFP-CCND1-LU (top panel) and GFP-CCND1-NU (bottom panel).
(H) As in (E), but after transfection of GFP-FUS-UTR (top panel) and GFP-FUS-NU (bottom panel).
(I) Correlation of mRNA enrichment in TIS granules with AREs and the presence of a TMD. The number of AREs in the mRNA was multiplied by two if the mRNA encodes a membrane protein. Show is the Spearman’s correlation coefficient.
(J) Spearman’s correlation coefficients of various features tested for their association with mRNA enrichment in TIS granules.
(A) Confocal live cell imaging (Airyscan) of HeLa cells after transfection of GFP-TIS11B (red) and mC-NACA (green). The top right panel shows the line profile with the Pearson’s correlation coefficient. The bottom right panel shows the region marked by the dotted line in higher magnification.
(B), (C), (F) and (G) Western blots of HeLa cells stably expressing the indicated shRNAs. The western blots were probed for HuR, KHSRP, SET, TIS11B and TUBULIN, which served as loading control. shRNA Ctrl, control shRNA.
(D), (E), (H) and (I) FACS analysis of endogenous CD47 protein in HeLa cells stably expressing the indicated shRNAs from (C), (F) or (G). MFI values are shown in parentheses. Shown are representative experiments. Quantification of CD47 expression shown as mean ± SD of biological replicates. t-test, ***, P < 0.001.
(J) Confocal live cell imaging (Airyscan) of HeLa cells after transfection of GFP-CD47-LU, mC-TIS11B (red) and BFP-SEC61B (green). GFP-CD47-LU is shown either in green or red to emphasize co-localization (yellow). The white dotted line demarcates the nucleus. As CD47 is a membrane protein, the highest amount of co-localization is seen with the ER. Shown are representative images.
(A) IDR prediction of TIS11B using the IUPRED algorithm. A region is considered disordered if the disorder score is higher than 0.5.
(B) The amino acid sequence of each TIS11B region with a different net charge is shown. Positively charged amino acids (R, K) are colored red, whereas negatively charged amino acids (E, D) are colored green. The number of ′+′ or ′-′ within the domain symbols indicates the number of positive or negative net charges within each region of TIS11B. The RNA-binding domain (RBD) is shown in bold. IDR, intrinsically disordered region.
(C) The wild-type (WT) amino acid sequence of TIS11B together with the introduced point mutations are shown. Also shown are the names of the mutation constructs and the amino acids mutated. CPM, charge pattern mutant.
(D) Quantification of TIS11B granule formation upon transfection of WT or mutant TIS11B constructs. The constructs are shown in Figures 7A, S4B, S4C, and S4E. The total number of transfected cells was counted within a field using a fluorescence microscope. Then, the number of cells with granules were counted. Shown is the fraction of cells with granules as mean ± SD, t-test, ***, P < 0.001, NS, not significant. The corresponding numbers are shown in Table S1.
(E) Net charge pattern of TIS11B CPM1 and CPM4. Confocal live cell imaging of HeLa cells after transfection of the indicated constructs fused to mC together with GFP-SEC61B to visualize the ER.
(F) FACS analysis of GFP after transfection of GFP-CD47-LU and the TIS11B CPM1 or CPM4 constructs into HeLa cells. The introduced mutations are shown in (C). The fold increase in GFP expression (mean MFI values) compared to transfection with mC is shown for surface (left panel) and total GFP (right panel). Shown is mean ± SD of five biological replicates. t-test, ***, P < 0.001.
(G) Western blot showing the expression levels of mC-TIS11B WT and mC-TIS11B CPMs. ACTIN served as loading control.
(H) TIS11B CPM2 retains its ability to bind to the TNFα ARE. RNA oligonucleotide pulldown was performed after transfection of either mC-TIS11B WT or mC-TIS11B CPM2 in HeLa cells and probed for TIS11B. TUBULIN served as loading control. 2.5 % of input was loaded.
(I) As in (H), but after transfection of either mC-TIS11B WT or mC-TIS11B RBDM (RNA binding domain mutant, C135H/C173H). The TIS11B RBDM does not bind to the TNFα ARE and is used as control for (H) to demonstrate specific binding of CPM2 to the TNFα ARE.
(J) FACS analysis of total GFP-CD47-LU after overexpression of either mC (grey), TIS11B WT (blue) or TIS11B CPM2 (green) in HeLa cells. All GFP positive cells were gated for analysis. Shown is a FACS panel of a representative experiment. Right panel shows mean MFI values of total GFP expression as mean ± SD of two biological replicates. t-test, ***, P < 0.001, **, P < 0.01, *, P < 0.05. Overexpression of either TIS11B WT or TIS11B CPM2 results in a significant decrease of total GFP expression, indicating that TIS11B CPM2 retains its function with respect to mRNA destabilization.
(K) As in (J), but after overexpression of either mC (grey), TIS11B WT (blue) or TIS11B RBDM (green) in HeLa cells. This panel is shown as control for (J). In contrast to CPM2, the TIS11B RBDM has largely lost its ability to destabilize mRNAs.
(A) Western blot of HeLa cells stably expressing the indicated shRNAs. The western blot was probed for TIS11B and TUBULIN served as loading control. shRNA Ctrl, control shRNA.
(B) Stable knock-down of endogenous TIS11B in HeLa cells followed by RNA-FISH against GFP-CD274-UTR mRNA after co-transfection of BFP-labeled wildtype or CPM2 TIS11B (red). Shown as in Figure 2B.
(C) Stable knock-down of endogenous TIS11B in HeLa cells followed by confocal microscopy of mC-tagged WT or CPM2 TIS11B and GFP-tagged HuR. Shown as in Figure 3A. mC was used as control and shows no local enrichment. Lack of local enrichment of HuR in cells expressing TIS11B CPM2.
(D) As in (C), but after expression of GFP-tagged NACA.
(A) Amino acid alignment of the RNA-binding domain of TIS11B homologues in different species. Light grey shows conserved amino acids, dark grey shows similar amino acids and white indicates no sequence conservation.
(B) Number of conserved amino acids (aa) of TIS11B homologues in different species in comparison with the sequence of human TIS11B.
(C) Net charge pattern of TIS11B protein homologues in different species.
(D) Confocal live cell imaging (Airyscan) of HeLa cells after transfection of GFP-SEC61B to visualize the ER together with mC or mC-TIS11B homologues from mouse, zebrafish or fly. Fly TIS11 (dTIS11) did not generate TIS assemblies. Shown are representative images.
(E) As in (D), but shown is nucleus for zebrafish mC-Tis11b which forms TIS granules in the nucleus.
(F) As in (D), but mC-dTIS11 was transfected into Drosophila S2R+ cells. GFP-KDEL was used to visualize the ER. dTIS11 assemblies were not observed.
Acknowledgements
This work was funded by the NIH Director′s Pioneer Award (DP1-GM123454), the Pershing Square Sohn Cancer Research Alliance and the MSK Core Grant (P30 CA008748). We thank Yevgeniy Romin, Sho Fujisawa, and Elvin Feng from the Molecular Cytology Core Facility for help with the microscopy. We thank members of the Mayr lab, including Sibylle Mitschka and Sarah Tisdale for providing constructs and Véronique Kruys (University of Brussels) for the dTIS11 construct. We thank Richard White, Andrea Schietinger, and all the members of the Mayr lab for helpful discussions and critical reading of the manuscript.
Footnotes
Declaration of Interests
The authors declare no competing interests.
Publisher's Disclaimer: This is a PDF file of an unedited manuscript that has been accepted for publication. As a service to our customers we are providing this early version of the manuscript. The manuscript will undergo copyediting, typesetting, and review of the resulting proof before it is published in its final citable form. Please note that during the production process errors may be discovered which could affect the content, and all legal disclaimers that apply to the journal pertain.
References
- Alberti S (2017). Phase separation in biology. Current biology : CB 27, R1097–R1102. [DOI] [PubMed] [Google Scholar]
- Bakheet T, Williams BR, and Khabar KS (2006). ARED 3.0: the large and diverse AU-rich transcriptome. Nucleic Acids Res 34, D111–114. [DOI] [PMC free article] [PubMed] [Google Scholar]
- Banani SF, Lee HO, Hyman AA, and Rosen MK (2017). Biomolecular condensates: organizers of cellular biochemistry. Nature reviews Molecular cell biology 18, 285–298. [DOI] [PMC free article] [PubMed] [Google Scholar]
- Barreau C, Paillard L, and Osborne HB (2005). AU-rich elements and associated factors: are there unifying principles? Nucleic Acids Res 33, 7138–7150. [DOI] [PMC free article] [PubMed] [Google Scholar]
- Berkovits BD, and Mayr C (2015). Alternative 3’ UTRs act as scaffolds to regulate membrane protein localization. Nature 522, 363–367. [DOI] [PMC free article] [PubMed] [Google Scholar]
- Boke E, Ruer M, Wuhr M, Coughlin M, Lemaitre R, Gygi SP, Alberti S, Drechsel D, Hyman AA, and Mitchison TJ (2016). Amyloid-like Self-Assembly of a Cellular Compartment. Cell 166, 637–650. [DOI] [PMC free article] [PubMed] [Google Scholar]
- Brangwynne CP, Eckmann CR, Courson DS, Rybarska A, Hoege C, Gharakhani J, Julicher F, and Hyman AA (2009). Germline P granules are liquid droplets that localize by controlled dissolution/condensation. Science 324, 1729–1732. [DOI] [PubMed] [Google Scholar]
- Chapanian R, Kwan DH, Constantinescu I, Shaikh FA, Rossi NA, Withers SG, and Kizhakkedathu JN (2014). Enhancement of biological reactions on cell surfaces via macromolecular crowding. Nature communications 5, 4683. [DOI] [PMC free article] [PubMed] [Google Scholar]
- Chartron JW, Hunt KC, and Frydman J (2016). Cotranslational signal-independent SRP preloading during membrane targeting. Nature 536, 224–228. [DOI] [PMC free article] [PubMed] [Google Scholar]
- Crick FH (1958). On protein synthesis. Symposia of the Society for Experimental Biology 12, 138–163. [PubMed] [Google Scholar]
- Dosztanyi Z, Csizmok V, Tompa P, and Simon I (2005). IUPred: web server for the prediction of intrinsically unstructured regions of proteins based on estimated energy content. Bioinformatics 21, 3433–3434. [DOI] [PubMed] [Google Scholar]
- Fan XC, and Steitz JA (1998). Overexpression of HuR, a nuclear-cytoplasmic shuttling protein, increases the in vivo stability of ARE-containing mRNAs. EMBO J 17, 3448–3460. [DOI] [PMC free article] [PubMed] [Google Scholar]
- Frey S, Richter RP, and Gorlich D (2006). FG-rich repeats of nuclear pore proteins form a three-dimensional meshwork with hydrogel-like properties. Science 314, 815–817. [DOI] [PubMed] [Google Scholar]
- Good MC, Zalatan JG, and Lim WA (2011). Scaffold proteins: hubs for controlling the flow of cellular information. Science 332, 680–686. [DOI] [PMC free article] [PubMed] [Google Scholar]
- Han TW, Kato M, Xie S, Wu LC, Mirzaei H, Pei J, Chen M, Xie Y, Allen J, Xiao G, et al. (2012). Cell-free formation of RNA granules: bound RNAs identify features and components of cellular assemblies. Cell 149, 768–779. [DOI] [PubMed] [Google Scholar]
- Hartl FU, and Hayer-Hartl M (2002). Molecular chaperones in the cytosol: from nascent chain to folded protein. Science 295, 1852–1858. [DOI] [PubMed] [Google Scholar]
- Hodson DJ, Janas ML, Galloway A, Bell SE, Andrews S, Li CM, Pannell R, Siebel CW, MacDonald HR, De Keersmaecker K, et al. (2010). Deletion of the RNA-binding proteins ZFP36L1 and ZFP36L2 leads to perturbed thymic development and T lymphoblastic leukemia. Nature immunology 11, 717–724. [DOI] [PMC free article] [PubMed] [Google Scholar]
- Huang da W, Sherman BT, and Lempicki RA (2009). Systematic and integrative analysis of large gene lists using DAVID bioinformatics resources. Nature protocols 4, 44–57. [DOI] [PubMed] [Google Scholar]
- Kato M, Han TW, Xie S, Shi K, Du X, Wu LC, Mirzaei H, Goldsmith EJ, Longgood J, Pei J, et al. (2012). Cell-free formation of RNA granules: low complexity sequence domains form dynamic fibers within hydrogels. Cell 149, 753–767. [DOI] [PMC free article] [PubMed] [Google Scholar]
- Kato M, and McKnight SL (2018). A Solid-State Conceptualization of Information Transfer from Gene to Message to Protein. Annu Rev Biochem 87, 351–390. [DOI] [PubMed] [Google Scholar]
- Kim JS, and Yethiraj A (2010). Crowding effects on association reactions at membranes. Biophysical journal 98, 951–958. [DOI] [PMC free article] [PubMed] [Google Scholar]
- Lamson RE, Takahashi S, Winters MJ, and Pryciak PM (2006). Dual role for membrane localization in yeast MAP kinase cascade activation and its contribution to signaling fidelity. Current biology : CB 16, 618–623. [DOI] [PubMed] [Google Scholar]
- Li M, Makkinje A, and Damuni Z (1996). The myeloid leukemia-associated protein SET is a potent inhibitor of protein phosphatase 2A. J Biol Chem 271, 11059–11062. [DOI] [PubMed] [Google Scholar]
- Li P, Banjade S, Cheng HC, Kim S, Chen B, Guo L, Llaguno M, Hollingsworth JV, King DS, Banani SF, et al. (2012). Phase transitions in the assembly of multivalent signalling proteins . Nature 483, 336–340. [DOI] [PMC free article] [PubMed] [Google Scholar]
- Lianoglou S, Garg V, Yang JL, Leslie CS, and Mayr C (2013). Ubiquitously transcribed genes use alternative polyadenylation to achieve tissue-specific expression. Genes Dev 27, 2380–2396. [DOI] [PMC free article] [PubMed] [Google Scholar]
- Lykke-Andersen J, and Wagner E (2005). Recruitment and activation of mRNA decay enzymes by two ARE-mediated decay activation domains in the proteins TTP and BRF-1. Genes Dev 19, 351–361. [DOI] [PMC free article] [PubMed] [Google Scholar]
- Mayr C (2017). Regulation by 3’-Untranslated Regions. Annual review of genetics 51, 171–194. [DOI] [PubMed] [Google Scholar]
- Mayr C (2018). What Are 3’ UTRs Doing? Cold Spring Harb Perspect Biol [DOI] [PMC free article] [PubMed]
- Mori Y, Imaizumi K, Katayama T, Yoneda T, and Tohyama M (2000). Two cis-acting elements in the 3’ untranslated region of alpha-CaMKII regulate its dendritic targeting. Nature neuroscience 3, 1079–1084. [DOI] [PubMed] [Google Scholar]
- Natan E, Wells JN, Teichmann SA, and Marsh JA (2017). Regulation, evolution and consequences of cotranslational protein complex assembly. Current opinion in structural biology 42, 90–97. [DOI] [PubMed] [Google Scholar]
- Nott TJ, Craggs TD, and Baldwin AJ (2016). Membraneless organelles can melt nucleic acid duplexes and act as biomolecular filters. Nature chemistry 8, 569–575. [DOI] [PubMed] [Google Scholar]
- Nott TJ, Petsalaki E, Farber P, Jervis D, Fussner E, Plochowietz A, Craggs TD, Bazett-Jones DP, Pawson T, Forman-Kay JD, et al. (2015). Phase transition of a disordered nuage protein generates environmentally responsive membraneless organelles. Mol Cell 57, 936–947. [DOI] [PMC free article] [PubMed] [Google Scholar]
- Okajima T, Xu A, Lei L, and Irvine KD (2005). Chaperone activity of protein O-fucosyltransferase 1 promotes notch receptor folding. Science 307, 1599–1603. [DOI] [PubMed] [Google Scholar]
- Reid DW, and Nicchitta CV (2015). Diversity and selectivity in mRNA translation on the endoplasmic reticulum. Nature reviews Molecular cell biology 16, 221–231. [DOI] [PMC free article] [PubMed] [Google Scholar]
- Sarbassov DD, Guertin DA, Ali SM, and Sabatini DM (2005). Phosphorylation and regulation of Akt/PKB by the rictor-mTOR complex. Science 307, 1098–1101. [DOI] [PubMed] [Google Scholar]
- Schnell U, Dijk F, Sjollema KA, and Giepmans BN (2012). Immunolabeling artifacts and the need for live-cell imaging. Nat Methods 9, 152–158. [DOI] [PubMed] [Google Scholar]
- Shin Y, and Brangwynne CP (2017). Liquid phase condensation in cell physiology and disease. Science 357. [DOI] [PubMed] [Google Scholar]
- Stoecklin G, Colombi M, Raineri I, Leuenberger S, Mallaun M, Schmidlin M, Gross B, Lu M, Kitamura T, and Moroni C (2002). Functional cloning of BRF1, a regulator of ARE-dependent mRNA turnover. EMBO J 21, 4709–4718. [DOI] [PMC free article] [PubMed] [Google Scholar]
- Su X, Ditlev JA, Hui E, Xing W, Banjade S, Okrut J, King DS, Taunton J, Rosen MK, and Vale RD (2016). Phase separation of signaling molecules promotes T cell receptor signal transduction. Science 352, 595–599. [DOI] [PMC free article] [PubMed] [Google Scholar]
- ten Klooster JP, Leeuwen I, Scheres N, Anthony EC, and Hordijk PL (2007). Rac1-induced cell migration requires membrane recruitment of the nuclear oncogene SET. EMBO J 26, 336–345. [DOI] [PMC free article] [PubMed] [Google Scholar]
- Thompson MJ, Lai WS, Taylor GA, and Blackshear PJ (1996). Cloning and characterization of two yeast genes encoding members of the CCCH class of zinc finger proteins: zinc finger-mediated impairment of cell growth. Gene 174, 225–233. [DOI] [PubMed] [Google Scholar]
- Twyffels L, Wauquier C, Soin R, Decaestecker C, Gueydan C, and Kruys V (2013). A masked PY-NLS in Drosophila TIS11 and its mammalian homolog tristetraprolin. PLoS One 8, e71686. [DOI] [PMC free article] [PubMed] [Google Scholar]
- Zhang H, Elbaum-Garfinkle S, Langdon EM, Taylor N, Occhipinti P, Bridges AA, Brangwynne CP, and Gladfelter AS (2015). RNA Controls PolyQ Protein Phase Transitions. Mol Cell 60, 220–230. [DOI] [PMC free article] [PubMed] [Google Scholar]
- Zurek N, Sparks L, and Voeltz G (2011). Reticulon short hairpin transmembrane domains are used to shape ER tubules. Traffic 12, 28–41. [DOI] [PMC free article] [PubMed] [Google Scholar]
Associated Data
This section collects any data citations, data availability statements, or supplementary materials included in this article.
Supplementary Materials
Confocal time lapse video of the TIS granule (red) and the ER (green) in HeLa cells after transfection of mCherry-TIS11B and of GFP-SEC61B to visualize the ER.
(A) FRAP of GFP-HuR in the TIS granule region or in the region of the cytoplasm located outside of TIS granules. GFP-HuR and mC-TIS11B were transfected into HeLa cells. Shown is mean ± SD of fluorescence measured in different granule and cytoplasmic regions (N = 33, each) from 17 cells. Mann Whitney test, P = E-54.
(B) As in (A), but for GFP-HSPA8. N = 32 regions from 16 cells were analyzed. Mann Whitney test, P = E-46.
(C) Confocal imaging of HeLa cells after transfection of GFP-TIS11B (red) and mC-HSPA8 (green). Images were taken in live cells, in cells after fixation by PFA and in cells after 1 hour of permeabilization with Triton X-100. The area of the nucleus is demarcated by the white dotted line.
(D) As in (C), but after transfection of mC-NACA (green). Shown are representative images.
Statistics for TIS11B granule formation upon transfection of WT or mutant TIS11B constructs. The constructs are shown in Figures 7A, S4B, S4C, and S4E. CPM, charge pattern mutant. The total number of transfected cells within a field was counted using a fluorescence microscope. Then, the number of cells containing granules was counted. Shown is the number of cells counted as well as the percentage of cells with granules. The corresponding bar plots are shown in Figure S4D.
(A) Subcellular expression pattern of RNA-binding proteins determined by immunostaining, data base search, and literature survey.
(B) Distribution of mRNA expression of all expressed transcripts across human tissues, cell types, and cell lines as detected by 3′-seq. The log2 transcript per million (TPM) expression of TIS11B is indicated by the red line. Boxplots depict median and interquartile range, error bars show confidence interval (5–95%), and circles and stars show outliers.
(C) Fluorescence confocal microscopy of endogenous TIS11B protein in human and mouse cell lines. The nucleus was stained with DAPI. Shown are representative cells. The right panel shows the region marked by the dotted line in higher magnification.
(D) Confocal live cell imaging (Airyscan) of HeLa cells after transfection of GFP-SEC61B to visualize the ER together with mC, mC-FXR1 or mC-TIS11B. FXR1 granules are shown for comparison reasons as they form sphere-like granules. Note that the TIS11B assemblies cover almost the entire peri-nuclear ER region in cells with high TIS11B expression. Shown are representative images.
(E) 3D-reconstruction of images from cells treated as in (D).
(F) 3D-model of TIS granules and the ER.
(G) Fluorescence recovery after photobleaching (FRAP) of TIS11B assemblies after transfection of GFP-TIS11B into HeLa cells. The top panel shows the normalized FRAP curve. Shown is mean ± SD of three TIS11B assemblies.
(A) Features of mRNAs examined by RNA-FISH for co-localization with TIS granules. TMD, transmembrane domain.
(B) RNA-FISH (green) against GFP in HeLa cells after transfection of GFP-CD47-LU and mC-TIS11B (red), showing that LU mRNA localizes to TIS granules as well as to their surface.
(C) As in (B), but after transfection of GFP-CD47-SU and mC-SEC61B (red) to visualize the ER.
(D) Shown are GFP-tagged constructs that were used for RNA-FISH. They are drawn to scale and AREs are shown as red stars.
(E) RNA-FISH (green) against GFP in HeLa cells after transfection of TP53-GFP-UTR (top panel) and TP53-GFP-NU (without 3′UTR, middle panel), and TP53-GFP-TNFα ARE (bottom panel). BFP-TIS11B (red) was co-transfected. The area of the nucleus is demarcated by the white dotted line. Right panel shows the line profiles with the Pearson’s correlation coefficients. See also Figure 2D.
(F) As in (E), but for GFP-ELAVL1-LU (top panel) and GFP-ELAVL1-NU (bottom panel).
(G) As in (E), but after transfection of GFP-CCND1-LU (top panel) and GFP-CCND1-NU (bottom panel).
(H) As in (E), but after transfection of GFP-FUS-UTR (top panel) and GFP-FUS-NU (bottom panel).
(I) Correlation of mRNA enrichment in TIS granules with AREs and the presence of a TMD. The number of AREs in the mRNA was multiplied by two if the mRNA encodes a membrane protein. Show is the Spearman’s correlation coefficient.
(J) Spearman’s correlation coefficients of various features tested for their association with mRNA enrichment in TIS granules.
(A) Confocal live cell imaging (Airyscan) of HeLa cells after transfection of GFP-TIS11B (red) and mC-NACA (green). The top right panel shows the line profile with the Pearson’s correlation coefficient. The bottom right panel shows the region marked by the dotted line in higher magnification.
(B), (C), (F) and (G) Western blots of HeLa cells stably expressing the indicated shRNAs. The western blots were probed for HuR, KHSRP, SET, TIS11B and TUBULIN, which served as loading control. shRNA Ctrl, control shRNA.
(D), (E), (H) and (I) FACS analysis of endogenous CD47 protein in HeLa cells stably expressing the indicated shRNAs from (C), (F) or (G). MFI values are shown in parentheses. Shown are representative experiments. Quantification of CD47 expression shown as mean ± SD of biological replicates. t-test, ***, P < 0.001.
(J) Confocal live cell imaging (Airyscan) of HeLa cells after transfection of GFP-CD47-LU, mC-TIS11B (red) and BFP-SEC61B (green). GFP-CD47-LU is shown either in green or red to emphasize co-localization (yellow). The white dotted line demarcates the nucleus. As CD47 is a membrane protein, the highest amount of co-localization is seen with the ER. Shown are representative images.
(A) IDR prediction of TIS11B using the IUPRED algorithm. A region is considered disordered if the disorder score is higher than 0.5.
(B) The amino acid sequence of each TIS11B region with a different net charge is shown. Positively charged amino acids (R, K) are colored red, whereas negatively charged amino acids (E, D) are colored green. The number of ′+′ or ′-′ within the domain symbols indicates the number of positive or negative net charges within each region of TIS11B. The RNA-binding domain (RBD) is shown in bold. IDR, intrinsically disordered region.
(C) The wild-type (WT) amino acid sequence of TIS11B together with the introduced point mutations are shown. Also shown are the names of the mutation constructs and the amino acids mutated. CPM, charge pattern mutant.
(D) Quantification of TIS11B granule formation upon transfection of WT or mutant TIS11B constructs. The constructs are shown in Figures 7A, S4B, S4C, and S4E. The total number of transfected cells was counted within a field using a fluorescence microscope. Then, the number of cells with granules were counted. Shown is the fraction of cells with granules as mean ± SD, t-test, ***, P < 0.001, NS, not significant. The corresponding numbers are shown in Table S1.
(E) Net charge pattern of TIS11B CPM1 and CPM4. Confocal live cell imaging of HeLa cells after transfection of the indicated constructs fused to mC together with GFP-SEC61B to visualize the ER.
(F) FACS analysis of GFP after transfection of GFP-CD47-LU and the TIS11B CPM1 or CPM4 constructs into HeLa cells. The introduced mutations are shown in (C). The fold increase in GFP expression (mean MFI values) compared to transfection with mC is shown for surface (left panel) and total GFP (right panel). Shown is mean ± SD of five biological replicates. t-test, ***, P < 0.001.
(G) Western blot showing the expression levels of mC-TIS11B WT and mC-TIS11B CPMs. ACTIN served as loading control.
(H) TIS11B CPM2 retains its ability to bind to the TNFα ARE. RNA oligonucleotide pulldown was performed after transfection of either mC-TIS11B WT or mC-TIS11B CPM2 in HeLa cells and probed for TIS11B. TUBULIN served as loading control. 2.5 % of input was loaded.
(I) As in (H), but after transfection of either mC-TIS11B WT or mC-TIS11B RBDM (RNA binding domain mutant, C135H/C173H). The TIS11B RBDM does not bind to the TNFα ARE and is used as control for (H) to demonstrate specific binding of CPM2 to the TNFα ARE.
(J) FACS analysis of total GFP-CD47-LU after overexpression of either mC (grey), TIS11B WT (blue) or TIS11B CPM2 (green) in HeLa cells. All GFP positive cells were gated for analysis. Shown is a FACS panel of a representative experiment. Right panel shows mean MFI values of total GFP expression as mean ± SD of two biological replicates. t-test, ***, P < 0.001, **, P < 0.01, *, P < 0.05. Overexpression of either TIS11B WT or TIS11B CPM2 results in a significant decrease of total GFP expression, indicating that TIS11B CPM2 retains its function with respect to mRNA destabilization.
(K) As in (J), but after overexpression of either mC (grey), TIS11B WT (blue) or TIS11B RBDM (green) in HeLa cells. This panel is shown as control for (J). In contrast to CPM2, the TIS11B RBDM has largely lost its ability to destabilize mRNAs.
(A) Western blot of HeLa cells stably expressing the indicated shRNAs. The western blot was probed for TIS11B and TUBULIN served as loading control. shRNA Ctrl, control shRNA.
(B) Stable knock-down of endogenous TIS11B in HeLa cells followed by RNA-FISH against GFP-CD274-UTR mRNA after co-transfection of BFP-labeled wildtype or CPM2 TIS11B (red). Shown as in Figure 2B.
(C) Stable knock-down of endogenous TIS11B in HeLa cells followed by confocal microscopy of mC-tagged WT or CPM2 TIS11B and GFP-tagged HuR. Shown as in Figure 3A. mC was used as control and shows no local enrichment. Lack of local enrichment of HuR in cells expressing TIS11B CPM2.
(D) As in (C), but after expression of GFP-tagged NACA.
(A) Amino acid alignment of the RNA-binding domain of TIS11B homologues in different species. Light grey shows conserved amino acids, dark grey shows similar amino acids and white indicates no sequence conservation.
(B) Number of conserved amino acids (aa) of TIS11B homologues in different species in comparison with the sequence of human TIS11B.
(C) Net charge pattern of TIS11B protein homologues in different species.
(D) Confocal live cell imaging (Airyscan) of HeLa cells after transfection of GFP-SEC61B to visualize the ER together with mC or mC-TIS11B homologues from mouse, zebrafish or fly. Fly TIS11 (dTIS11) did not generate TIS assemblies. Shown are representative images.
(E) As in (D), but shown is nucleus for zebrafish mC-Tis11b which forms TIS granules in the nucleus.
(F) As in (D), but mC-dTIS11 was transfected into Drosophila S2R+ cells. GFP-KDEL was used to visualize the ER. dTIS11 assemblies were not observed.